• About WordPress
    • WordPress.org
    • Documentation
    • Learn WordPress
    • Support
    • Feedback
  • Log In
  • Skip to primary navigation
  • Skip to main content
  • Skip to primary sidebar
  • Home
  • Contact us
  • Related Sites
    • InflationData.com
    • Financial Trend Forecaster
    • Your Family Finances
    • Elliott Wave University
    • Optio Money
  • About
    • Terms of Use
    • Disclaimer & Disclosure
    • Privacy Statement
  • Sitemap
    • 2009-2010 Posts
    • 2011 Posts

UnemploymentData.com

Your Source for Employment and Unemployment Data

Unemployment
  • Charts
    • Current Unemployment Rate Chart
    • Current Employment Rate (Chart and Data)
    • Current Employment vs Unemployment Chart
    • Historical Employment Data
    • Employment Population Ratio
    • Misery Index
  • Unemployment
    • Historical Unemployment Rate Tables
    • What Is U-6 Unemployment?
    • Unadjusted vs. Seasonally Adjusted U-3 Unemployment Rate
    • BLS vs. Gallup Unemployment Numbers
    • Current U-6 Unemployment Rate
    • What is the Labor Force Participation Rate?
    • What is the Real Unemployment Rate?
  • Employment
    • Current Employment Rate (Chart and Data)
    • Historical Employment Data
    • Contacting a Live Person at the State Employment Commission
      • How to Talk to a Live Person at the Virginia Unemployment Commission
      • Florida’s FLUID Unemployment Program
    • Benefits
      • Insurance
      • Retirement
    • Careers
    • Employment Costs
    • Experience
    • Government
    • Job Hunting
      • Interview
      • Resume
  • Find Articles
  • Education
    • Skills
  • General
    • Small Business
      • Outsourcing
    • Success
You are here: Home / Archives for Report

Report

September Unemployment Falls… Dragging Market Down

October 8, 2022 by Tim McMahon

Current Seasonally Adjusted Unemployment

Employment Up – Unemployment Down

  • Unadjusted Employment rose from 152.642 million to 153.073
  • Labor Force Participation is Down from 62.4% to 62.3%
  • Adjusted U-3 was Down from 3.7% to 3.5%
  • Unadjusted U-3 was Down from 3.8% to 3.3%
  • Unadjusted U-6 was Down from 7.0% to 6.4%


The U.S. Bureau of Labor Statistics (BLS) released its employment / unemployment report for September on October 7th.

According to the Commissioner of the U.S. Bureau of Labor Statistics:

“Total nonfarm payroll employment increased by 263,000 in September, and the unemployment rate edged down to 3.5 percent, the U.S. Bureau of Labor Statistics reported today. Notable job gains occurred in leisure and hospitality and in health care.”

You can read the full BLS report here.

As usual, they are talking about “Seasonally Adjusted Jobs” from the “Household Survey” rather than looking at the results reported by actual companies in the BLS “Establishment Survey”.

Looking at the Establishment Survey report, we see…
Originally the BLS reported employment of 152.572 million for August, which they adjusted up to 152.642 million. So, 70,000 additional jobs appeared for August.

September gained an additional 431,000 jobs bringing the total up to 153.073 million.

Normally this would be good news, but perversely the market was hoping for a bad report which would indicate that the FED could cut back on its tightening.
A good September 2022 Unemployment report means inflation is not yet under control, so the FED will continue aggressively tightening.

According to Bloomberg:
“The US labor market stayed strong in September as the unemployment rate unexpectedly returned to an historic low, leaving the inflation-phobic Federal Reserve on course to deliver yet another aggressive interest-rate hike.”

In response, the NYSE lost just over 2% of its value on Friday after the release of the report.

However, just 4 days earlier, on Monday, the BLS had released its “Job Openings and Labor Turnover Survey” for August, which in the minds of schizophrenic market analysts, appeared to indicate that the Labor market might possibly be softening just a little, and the market used that as an excuse to rally. So the NYSE opened the week at 13,472… rallied to 14,340… then fell back to 13,798 for the week.  (Actually, a 2.4% net gain for the week).

NOTE: The reason we look at the NYSE rather than the more commonly quoted DOW is breadth. The NYSE covers the vast majority of U.S. stocks rather than just a few major ones covered by the DOW.

ADP® National Employment Report

According to ADP In collaboration with Stanford Digital Economy Lab

  • Businesses created 208,000 jobs in September, up from a revised 185,000 in August, as schools reopened and pandemic concerns receded. But while job growth is stable, it remains below the recent three-month average.

In other words, jobs are still growing but not as fast as they have been. Despite this slowing of job growth and the FED tightening, ADP’s Chief Economist Nela Richardson believes jobs will continue to grow.

ADP September

ADP also lists increases by “firm size”.

At some point, it may look like small-size firms (i.e. 1-19 employees) are increasing, while everything else is decreasing, but that could simply be the result of people starting companies because they can’t find any other jobs (although this isn’t currently the case). Currently, there are increases across the board.

ADP Change by Firm Size 10-22

Establishment Survey Employment

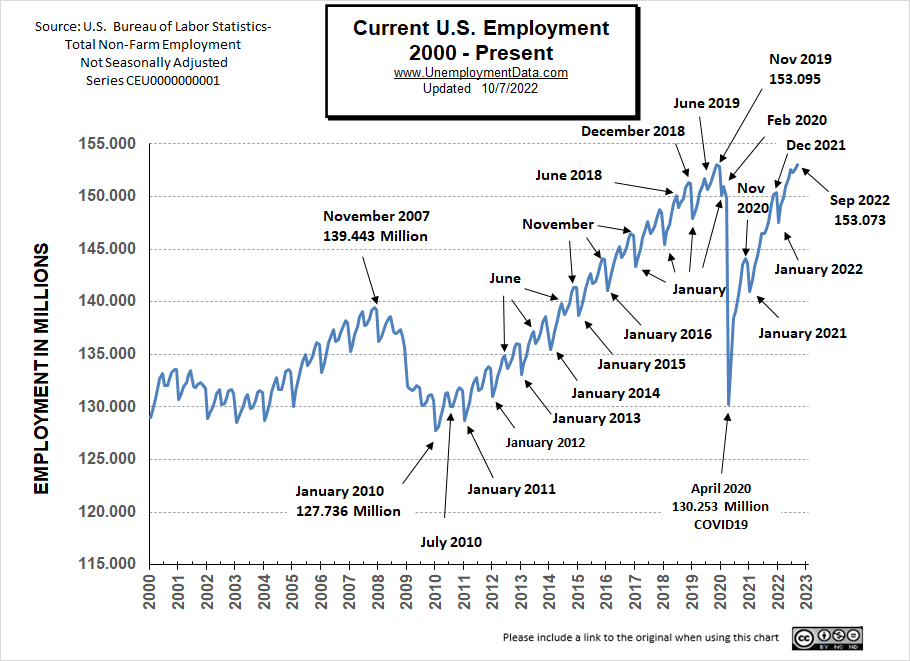
Looking at the chart for employment, we see that current employment (153.073 million) is just a hair under the 2019 peak (153.095 million) although the civilian population is almost 5 million higher now. So despite all the talk of the strong employment situation, there is a slight disconnect.

Current Employment

See Current Employment for more info.

[Read more…] about September Unemployment Falls… Dragging Market Down

Filed Under: BLS Tagged With: BLS, employment, jobs, Report, September 2022

April Unemployment Holds Steady

May 7, 2022 by Tim McMahon

April 2022 Employment — Bureau of Labor Statistics (BLS) Jobs Report

Adj U3 Icon 3-6 flat

  • Adjusted U-3 was Unchanged at 3.6%
  • Unadjusted U-3 was Down from 3.8% to 3.3%
  • Unadjusted U-6 was Down from 7.1% to 6.6%
  • Labor Force Participation Down from 62.4% to 62.2%
  • Unadjusted Employment rose from 149. 912 to 150.938 million

According to the Commissioner of the U.S. Bureau of Labor Statistics:

“Nonfarm payroll employment increased by 428,000 in April, and the unemployment rate was unchanged at 3.6 percent. Job growth was widespread, led by gains in leisure and hospitality, in manufacturing, and in transportation and warehousing.

      Nonfarm employment is down by 1.2 million, or 0.8 percent, from its February 2020 level before the onset of the coronavirus (COVID-19) pandemic.

      In April, employment growth continued in leisure and hospitality (+78,000), with gains in food services and drinking places (+44,000) and accommodation (+22,000). Employment in leisure and hospitality is down by 1.4 million, or 8.5 percent, from its February 2020 level.”

As usual, they are talking about “Seasonally Adjusted Jobs” from the “Household Survey” rather than looking at the results reported by actual companies in the BLS “Establishment Survey”

Looking at the Establishment Survey report we see…
Originally the BLS reported employment of 149.938 million for March which they adjusted to 149.912 million. So 26,000 jobs disappeared for March. They are reporting 150.938 million jobs for April which is actually an increase of exactly 1,000,000 jobs based on their original estimates or an increase of 1,026,000 based on their updated numbers. 

According to Jeffrey Tucker at Gilder’s Daily Prophecy  “The jobs report this morning didn’t look half bad on the surface… The trouble was in the footnotes: The U.S. labor force shrank by 363,000 people in April from a month earlier… The labor force participation rate… ticked down to 62.2% in April from 62.4% in March.

So the dropout economy is getting worse, not better, rendering these unemployment numbers rather pointless… Women with kids have dropped out and child care is too expensive. Many men just moved home to mom and dad and are happy to live off savings and look forward to going into debt. Plus, the demoralization of the workforce after lockdowns has drained American ambition… In addition, wage growth is slowing, a fact which might cheer the Fed, but is bad news for workers because it means the purchasing power of their wages will fall further, after having endured a devastating hit over the last six months.

A former Fed official went public with a very obvious statement, namely that the federal funds rate needs to be 3.5% in order to even begin to make a dent in inflation.
How does Richard Clarida know this? It’s not rocket science: short-term rates need to be positive in real terms rather than negative. That means 3.5%, yes, but more likely double or triple that. The Fed simply won’t go there. The Fed’s theory is that it can put out the house fire by carefully spraying a bit of water here and there in a way that doesn’t cause shock and alarm.”

[Read more…] about April Unemployment Holds Steady

Filed Under: BLS Tagged With: BLS, employment, Jos, Report, unemployment

September Unemployment Disappointing

October 9, 2021 by Tim McMahon

September nonfarm payroll report from the Bureau of Labor Statistics (BLS)

  • Unadjusted U-3 was Down from 5.3% to 4.6%
  • Adjusted U-3 was Down from 5.2% to 4.8%
  • Unadjusted U-6 was Down from 8.9% to 8.1%
  • Labor Force Participation Down from 61.7% to 61.6%
  • Unadjusted employment rose from 147.028 million to 147.682 million

Although these numbers are generally an improvement over last month (except Labor Force Participation), the market expected better. Bloomberg was projecting jobs growth of roughly 2.5x what we actually got.

According to the Commissioner of the U.S. Bureau of Labor Statistics:

Nonfarm payroll employment rose by 194,000 in September, and the unemployment rate fell by 0.4 percentage point to 4.8 percent.
Notable job gains occurred in leisure and hospitality, in professional and business services, in retail trade, and in transportation and warehousing.
Employment declined in public education over the month.

As usual, they are talking about “Seasonally Adjusted Jobs” from the “Current Population Survey (CPS)” rather than looking at the results reported by actual companies in their “Current Employment Statistics survey (CES).”

But looking at the CES report, we see…
Initially, the BLS reported 146.856 for August, which they adjusted to 147.028 million. For September, they are currently saying employment is 147.682 million.
This is an increase of 826,000 jobs based on their original estimates. Or an increase of 654,000 based on their updated numbers.

However, the market considers this a “much softer-than-expected September nonfarm payroll report” since Bloomberg was projecting 500,000 new jobs instead of the CPS Seasonally Adjusted 194,000.

The labor force participation rate dipped to 61.6% from August’s 61.7% rate, compared to forecasts of an increase to 61.8%.

[Read more…] about September Unemployment Disappointing

Filed Under: BLS Tagged With: BLS, employment, jobs, Report, unemployment

January Employment Report- Maybe Not as Good?

February 8, 2020 by Tim McMahon

Adj U3 Icon 3-6 upThe U.S. Bureau of Labor Statistics (BLS) released its employment / unemployment report for January on February 7th.

Last month we told you that the employment report was not as bad as the media tried to paint it. This month The New York Times is saying “Job Growth Gives the Economy an Upbeat Start to the Year” while Marketwatch calls the Labor Market “Astounding” and once again we have a slightly different opinion.

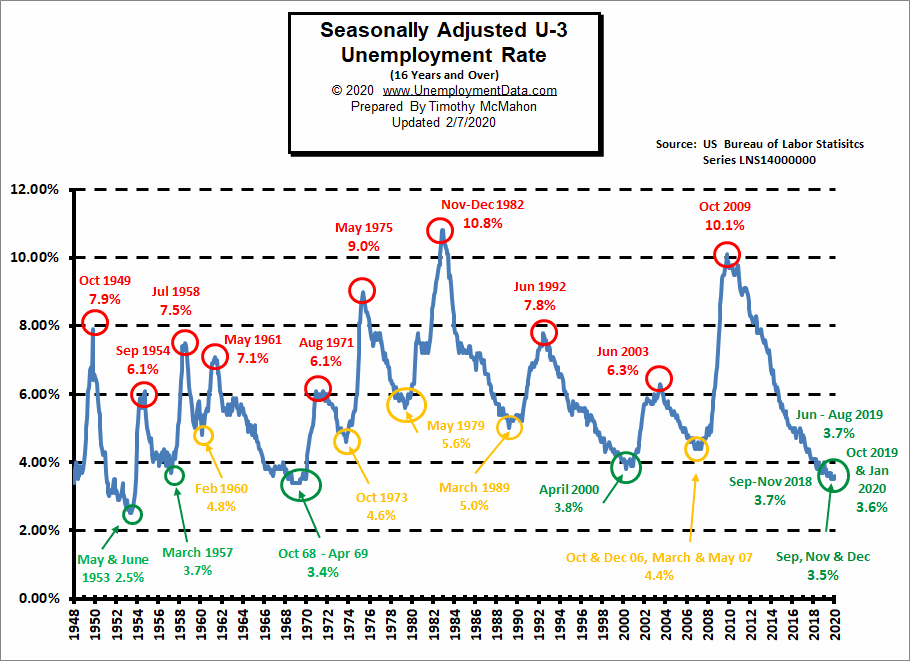
Yes, we are still in record low territory and that won’t change overnight. Seasonally adjusted Unemployment only notched up 1/10th of a percent and the Labor Force Participation Rate (LFPR) has entered territory that it hasn’t seen in years… BUT the unadjusted numbers jumped up significantly (as they do every year) and the BLS adjusted the Population numbers DOWN significantly. This adjustment is what the pundits are not seeing and what makes me think the numbers may not be quite as good as they appear i.e. lower population means a higher percentage appears to be working (even though the actual unadjusted employment fell). This could have given the LFPR the apparent boost and made the Adjusted U-3 increase by less than it would have without the population adjustment. This is still not a bad employment report just perhaps not as rosy as the media made it sound.

Key January Employment and Unemployment Numbers

  • Unadjusted U-3 Unemployment-  4.0% Up from December’s 3.5%… Typically up in January, it was 4.4% in January 2019.
  • Adjusted U-3 Unemployment-    3.6% Up from 3.5% in December.
  • Unadjusted U-6 Unemployment-  7.7% Up from 6.7% in December… was 8.8% in January 2019.
  • Unadjusted Employment (Establishment Survey)- 150.102 million down from 152,934 in December.
  • Labor Force Participation Rate- 63.4% Up from 63.2%.

According to the Commissioner of the U.S. Bureau of Labor Statistics:

Seasonally Adjusted U-3 Unemployment RateNonfarm payroll employment rose by 225,000 in January, and the unemployment rate was little changed at 3.6 percent.
Notable employment gains occurred in construction, in health care, and in transportation and warehousing.
In 2019, job growth averaged 175,000 per month.

Of course, he is talking about “Seasonally Adjusted Jobs” from the “Current Population Survey (CPS)”
rather than looking at the results reported by actual companies in their “Current Employment Statistics survey (CES)” which showed a non-adjusted drop of 2.8 million jobs.

For more info see our Current Unemployment Chart and Current U.S. Employment Chart commentary.

[Read more…] about January Employment Report- Maybe Not as Good?

Filed Under: BLS Tagged With: 2020, BLS, employment, January, Report, unemployment

Primary Sidebar

Search Site

Sponsored:

URGENT: These Stocks Stand Poised to Benefit from President Trump's Trade Wars!

As the Trump administration moves ahead with aggressive tariff policies on key imports, the mainstream media is scrambling.

This Free Report - which you can download now - reveals the names and ticker symbols of 5 Stock Poised to Benefit Most from President Trump's Tariff Wars.

Click Here to Download Your FREE Stock Report Now.

Recent Posts

  • April 2025 Employment / Unemployment Report
  • Would More Jobs Help Social Security?
  • March 2025- Employment / Unemployment Report
  • February 2025 Jobs Report
  • January 2025 BLS Employment Report

Resources

  • Bureau of Labor Statistics Current Population Survey Monthly survey of households conducted by the Bureau of Census for BLS. It provides data on the labor force, employment, unemployment, etc.
  • Capital Professional Services Providing web design and development and Internet marketing services
  • Elliott Wave University Using the Elliott Wave Principle to improve investment performance
  • Financial Trend Forecaster Featuring Moore Inflation Predictor, NYSE Rate of Change and NASDAQ Rate of change
  • InflationData.com Inflation calculators, databases, etc.
  • Intergalactic Web Designers Web design and development services
  • Your Family Finances

Articles by Category

Articles by Date

Disclaimer

At UnemploymentData.com we are not registered investment advisors and do not provide any individualized advice. Past performance is not necessarily indicative of future performance and future accuracy and profitable results cannot be guaranteed.

Privacy & Terms of Use

Privacy Statement & Terms of Use

Do Not Sell My Information

Copyright © 2025 · News Pro on Capital Professional Services, LLC. All rights reserved · Log in