The U.S. Bureau of Labor Statistics (BLS) released its employment / unemployment report for September on October 4th, 2024.
Employment / Unemployment
![]()
- Seasonally Adjusted U3- 4.1% down from 4.2% in August
- Unadjusted U3- 3.9% down from 4.4%
- Unadjusted U6- 7.3% down from 8.0%
- Labor Force Participation Rate 62.7% unchanged
- Employment 159.177 million up from 158.717 million
- Next data release November 1st, 2024
Summary:
Total Employed increased in September, Adjusted and Unadjusted Unemployment were both down.
According to the Commissioner of the U.S. Bureau of Labor Statistics:
“Total nonfarm payroll employment increased by 254,000 in September, and the unemployment rate changed little at 4.1 percent, the U.S. Bureau of Labor Statistics reported today. Employment continued to trend up in food services and drinking places, health care, government, social assistance, and construction…
Both the unemployment rate, at 4.1 percent, and the number of unemployed people, at 6.8 million, changed little in September. These measures are higher than a year earlier, when the jobless rate was 3.8 percent, and the number of unemployed people was 6.3 million. “
You can read the full BLS report here.
As usual, they are talking about “Seasonally Adjusted Jobs”.
Looking at the Unadjusted Establishment Survey report we see…
Originally the BLS reported employment of 158.650 million for August
which they adjusted slightly to 158.717 million in September.
They are currently reporting 159.177 million jobs for September which is actually an increase of 527,000 jobs based on their original numbers or 46,000 based on their new numbers. The LFPR was unchanged at 62.7%.
Good News for the Market?
The stock market responded slightly favorably with the NYSE up 0.78%. But the market doesn’t like uncertainty so it is waiting for election results before making any major moves. Other uncertainty revolves around the Middle-East and Russia.
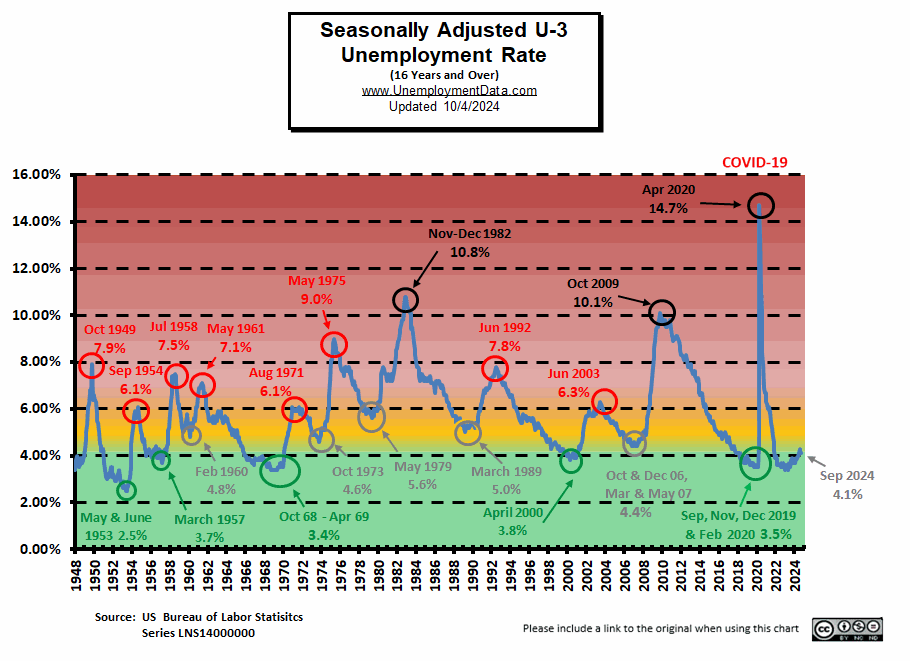
Current Unemployment Rate Chart
Seasonally Adjusted U3 Unemployment remains well above the pre-COVID 2019 cyclical lows of 3.5%, and is approaching the yellow zone.