• About WordPress
    • WordPress.org
    • Documentation
    • Learn WordPress
    • Support
    • Feedback
  • Log In
  • Skip to primary navigation
  • Skip to main content
  • Skip to primary sidebar
  • Home
  • Contact us
  • Related Sites
    • InflationData.com
    • Financial Trend Forecaster
    • Your Family Finances
    • Elliott Wave University
    • Optio Money
  • About
    • Terms of Use
    • Disclaimer & Disclosure
    • Privacy Statement
  • Sitemap
    • 2009-2010 Posts
    • 2011 Posts

UnemploymentData.com

Your Source for Employment and Unemployment Data

Unemployment
  • Charts
    • Current Unemployment Rate Chart
    • Current Employment Rate (Chart and Data)
    • Current Employment vs Unemployment Chart
    • Historical Employment Data
    • Employment Population Ratio
    • Misery Index
  • Unemployment
    • Historical Unemployment Rate Tables
    • What Is U-6 Unemployment?
    • Unadjusted vs. Seasonally Adjusted U-3 Unemployment Rate
    • BLS vs. Gallup Unemployment Numbers
    • Current U-6 Unemployment Rate
    • What is the Labor Force Participation Rate?
    • What is the Real Unemployment Rate?
  • Employment
    • Current Employment Rate (Chart and Data)
    • Historical Employment Data
    • Contacting a Live Person at the State Employment Commission
      • How to Talk to a Live Person at the Virginia Unemployment Commission
      • Florida’s FLUID Unemployment Program
    • Benefits
      • Insurance
      • Retirement
    • Careers
    • Employment Costs
    • Experience
    • Government
    • Job Hunting
      • Interview
      • Resume
  • Find Articles
  • Education
    • Skills
  • General
    • Small Business
      • Outsourcing
    • Success
You are here: Home / Archives for Labor Force Participation

Labor Force Participation

February Employment Shows Improvement in Leisure and Hospitality

March 6, 2021 by Tim McMahon

Highlights from the Bureau of Labor Statistics (BLS) employment / unemployment report for February released on March 5th.

  • Unadjusted U-3 was Down from 6.8% to 6.6%
  • Adjusted U-3 was Down from 6.3% to 6.2%
  • Unadjusted U-6 was Down from 12.0% to 11.6%
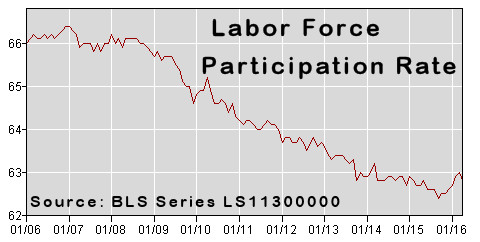
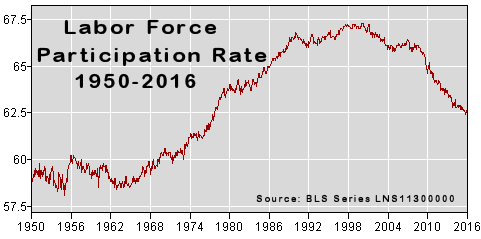
  • Labor Force Participation held steady at 61.4%
  • Unadjusted Employment rose from 140.948 million to 141.926 million

[Read more…] about February Employment Shows Improvement in Leisure and Hospitality

Filed Under: BLS Tagged With: BLS, Bubble Chart, employment, Labor Force Participation, unemployment

October Employment Up 1.6 Million

November 7, 2020 by Tim McMahon

Adjusted U3 6.9%

Employment Increased by 1.6 Million in October

The U.S. Bureau of Labor Statistics (BLS) released its employment / unemployment report for October on November 6th.

  • Unadjusted U-3 was Down from 7.7% to 6.6%.
  • Adjusted U-3 was Down from 7.9% to 6.9%.
  • Unadjusted U-6 was Down from 12.4% to 11.6%.
  • Labor Force Participation rose from 61.4% to 61.7%.
  • Unadjusted Employment up from 141.854 million to 143.459 million.

According to the Commissioner of the U.S. Bureau of Labor Statistics:

 “Total nonfarm payroll employment rose by 638,000 in October, and the unemployment rate declined to 6.9 percent, the U.S. Bureau of Labor Statistics reported today. These improvements in the labor market reflect the continued resumption of economic activity that had been curtailed due to the coronavirus (COVID-19) pandemic and efforts to contain it. In October, notable job gains occurred in leisure and hospitality, professional and business services, retail trade, and construction. Employment in government declined.”

Of course, they are talking about “Seasonally Adjusted Jobs” from the “Current Population Survey (CPS)” rather than looking at the results reported by actual companies in their “Current Employment Statistics survey (CES)”

But looking at the CES report we see…
Originally the BLS reported 141.855 million jobs for September, this month they only adjusted that slightly.
So currently they are saying 141.854 million jobs for September and 143.459 million for October.
which is actually an increase of  1,604,000 jobs based on their original estimates.


[Read more…] about October Employment Up 1.6 Million

Filed Under: BLS Tagged With: BLS, Bubble Chart, Historical Employment, Labor Force Participation, LFPR, U1-U6, unemployment

March Unemployment Numbers Celebrated

April 6, 2019 by Tim McMahon

Adjusted U3 UnemploymentThe U.S. Bureau of Labor Statistics (BLS) released their monthly unemployment survey results for March on April 5th and it has the market pundits celebrating. Last month they worried over the mere 20,000 jobs created after projections were for 175,000 jobs.

This month once again the projections were for 175,000 new jobs but the BLS says there were 195,000 new jobs so the market is happy.

As we said in the Current Unemployment Chart commentary:

According to the BLS Commissioner’s report for this month:
“Total nonfarm payroll employment increased by 196,000 in March, and the unemployment rate was unchanged at 3.8 percent, the U.S. Bureau of Labor Statistics reported today. Notable job gains occurred in health care and in professional and technical services… The employment-population ratio was 60.6 percent in March and has been either 60.6 percent or 60.7 percent since October 2018… Health care added 49,000 jobs in March and 398,000 over the past 12 months… Employment in professional and technical services grew by 34,000 in March and 311,000 over the past 12 months. “

Key factors in the report were the unemployment rate for Women dropped to another mega low of 3.3% from 3.6% last month.
Black unemployment was 6.7% and Hispanic Unemployment was 4.7%.

Last month the media was unpleasantly surprised by the Jobs report being lower than the consensus and this month they were pleasantly surprised by the higher than expected jobs. “Economists surveyed by The Wall Street Journal expected that the jobs report would show solid growth by 175,000 jobs”  but instead the report showed 196,000 “Seasonally Adjusted” jobs created, “making March the 102nd straight month of job growth”. In unadjusted terms February had 149.867 million jobs while March had 149.133 million jobs for an actual increase of 724,000 jobs.

Key March Employment and Unemployment Numbers

  • Adjusted U-3 Unemployment-   3.8% unchanged from February but down from 4.0% in January, and 3.9% in December.
  • Unadjusted U-3 Unemployment-  3.9% down from 4.1% in February, and 4.4% in January, but above the 3.7% in December.
  • Unadjusted U-6 Unemployment-  7.5% down from 7.7% in February and 8.8% in January, 7.5% in December.
  • Unadjusted Employment (Establishment Survey)- 149.867 up from 149.143 in February and 148.295 million in January.
  • February Labor Force Participation Rate- 63.0% down from the peak of 63.2% in February, and 63.1% in December.

Current Seasonally Adjusted U-3 levels are still hovering around the lows of 2000. Prior to that we have to go all the way back to 1969 to see better unemployment levels than we have currently. Current levels are rising a bit from a cyclical low not seen since 1969. Also noteworthy is that levels do not stay this low for very long. The longest low like this was the seven month period from October 1968 through April 1969. Prior to 1969 was a one month low of 3.7% in 1957. On the plus side, [Read more…] about March Unemployment Numbers Celebrated

Filed Under: BLS Tagged With: BLS, Bubble Chart, Bureau of Labor Statistics, employment, Employment by Sector, Labor Force, Labor Force Participation, Labor Force Participation Rate, Seasonally Adjusted, U-6, unemployment

BLS Monthly Employment Report for April

May 6, 2016 by Tim McMahon

The US economy added 160,000 “seasonally adjusted” jobs in April, the lowest figure in the last seven months. The adjusted U-3 unemployment rate remained steady at 5%. The Unadjusted U-3 fell to 4.7% while the Unadjusted U-6 fell to 9.3% from 9.9% last month.
Job Creation April 2016
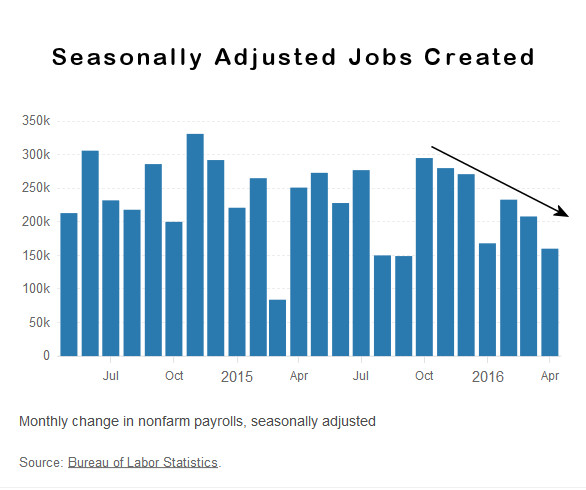
On a seasonally adjusted basis employment has fallen while on a non-adjusted basis the actual number of non-farm employed has increased from 142.887 Million to 143.944 million for a net increase of  1,057,000 jobs but since April traditionally sees a large increase in seasonal workers the seasonally adjusted number says that we were only 160,000 jobs better than what we would expect if there were zero jobs growth.

Labor Force Participation Rate

The Labor Force Participation Rate (LFPR) is the percentage of the Labor Force that is currently either looking for a job or actually has one. So even though it sounds like it is talking about how many people are working it actually is the percentage who “want to work”.  As of  April this stands at 62.8%. This rate has been steadily falling for a number of years and has reached levels not seen since the 1970’s.

Since the Bureau of Labor Statistics measures unemployment as the percentage of the labor force that can’t find work as people stop looking for work they fall out of the labor force and are no longer counted. Thus the unemployment rate can fall even though no new jobs have been created.

Labor Force Participation Rate Apr-2016

Long Term Labor Force Participation Rate

Labor Force Participation Rate 1950-Feb2016As we can see from the above chart the LFPR peaked in the late 1990’s and fell during the recession from 2000 through 2004. From 2004 through 2007 it leveled off  but then the “Great Recession” hit and the LFPR has fallen pretty steadily since. And even though we are supposed to be in a recovery the LFPR continues to fall although there was a bit of an up tick at the end of 2015 and early 2016, April’s LFPR is lower than March’s.

Some people wrongly assume that the LFPR is falling due to retiring baby-boomers.  This premise however has been proven false. See Record Low LFPR which shows the LFPR by age group since 1999. The biggest declines occur in the younger ages while those above age 60 actually show a higher percentage are working. For instance, in 1999 only 24% of those age 65-69 were working but according to the BLS in 2015 30.8% of those age 65-69 were working.

Gallup “Good Jobs” Index

Gallup’s “Good Jobs” Index is their version of the LFPR it is calculated as a percentage of the total population rather than limiting it to the “work force”.  So although the percentage is lower it is a better indicator of the actual situation since it is not subject to fudging through simply redefining who is in the “work force”. Gallup says 44.9% of the total adult population is in the “Good Jobs” Index i.e. has a full-time job. This does not mean that they are employed at their full capacity or that they are earning a “decent wage” simply that they are employed full-time. Gallup defines a full-time as 30+ hours per week for an employer who provides a regular paycheck. This is up from 44.5% last month confirming the seasonal increase in employment mentioned above.

Filed Under: Employment Tagged With: 2016, April, employment, Good Jobs Index, Labor Force Participation, unemployment

Primary Sidebar

Search Site

Sponsored:

URGENT: These Stocks Stand Poised to Benefit from President Trump's Trade Wars!

As the Trump administration moves ahead with aggressive tariff policies on key imports, the mainstream media is scrambling.

This Free Report - which you can download now - reveals the names and ticker symbols of 5 Stock Poised to Benefit Most from President Trump's Tariff Wars.

Click Here to Download Your FREE Stock Report Now.

Recent Posts

  • April 2025 Employment / Unemployment Report
  • Would More Jobs Help Social Security?
  • March 2025- Employment / Unemployment Report
  • February 2025 Jobs Report
  • January 2025 BLS Employment Report

Resources

  • Bureau of Labor Statistics Current Population Survey Monthly survey of households conducted by the Bureau of Census for BLS. It provides data on the labor force, employment, unemployment, etc.
  • Capital Professional Services Providing web design and development and Internet marketing services
  • Elliott Wave University Using the Elliott Wave Principle to improve investment performance
  • Financial Trend Forecaster Featuring Moore Inflation Predictor, NYSE Rate of Change and NASDAQ Rate of change
  • InflationData.com Inflation calculators, databases, etc.
  • Intergalactic Web Designers Web design and development services
  • Your Family Finances

Articles by Category

Articles by Date

Disclaimer

At UnemploymentData.com we are not registered investment advisors and do not provide any individualized advice. Past performance is not necessarily indicative of future performance and future accuracy and profitable results cannot be guaranteed.

Privacy & Terms of Use

Privacy Statement & Terms of Use

Do Not Sell My Information

Copyright © 2025 · News Pro on Capital Professional Services, LLC. All rights reserved · Log in