The U.S. Bureau of Labor Statistics (BLS) released its employment / unemployment report for February on March 7th, 2025.
Employment / Unemployment
![]()
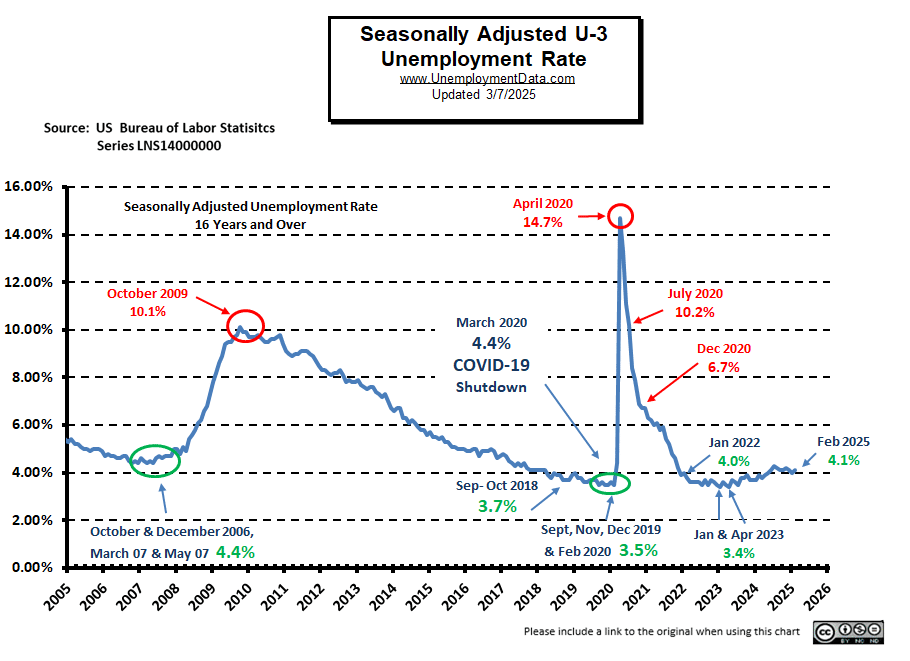
- Seasonally Adjusted U3- 4.1% Up from 4.0%
- Unadjusted U3- 4.5% Up from 4.4% in January
- Unadjusted U6- 8.4% Up from 8.2% in January
- Labor Force Participation Rate 62.4% Down from 62.6%
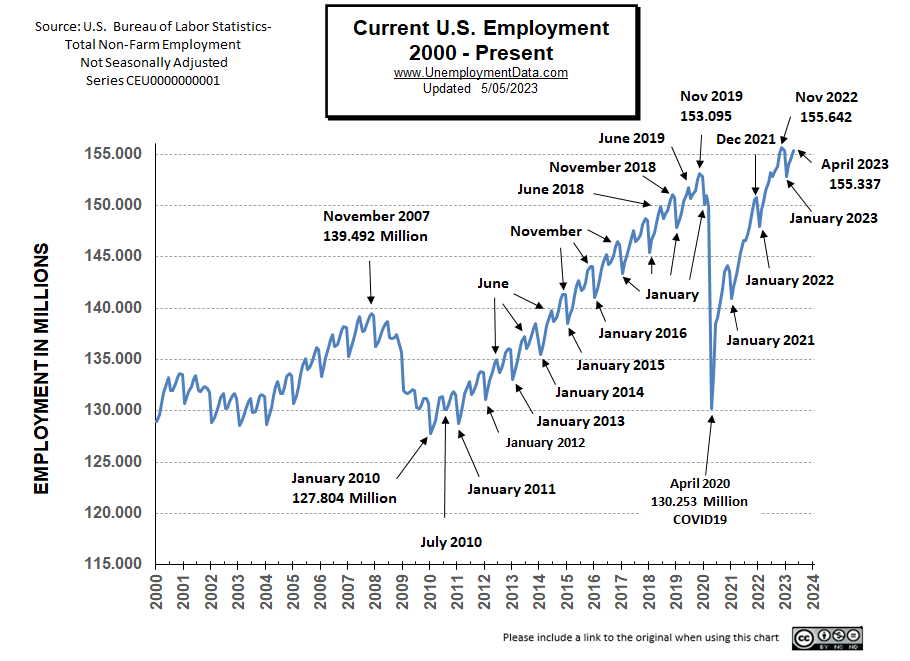
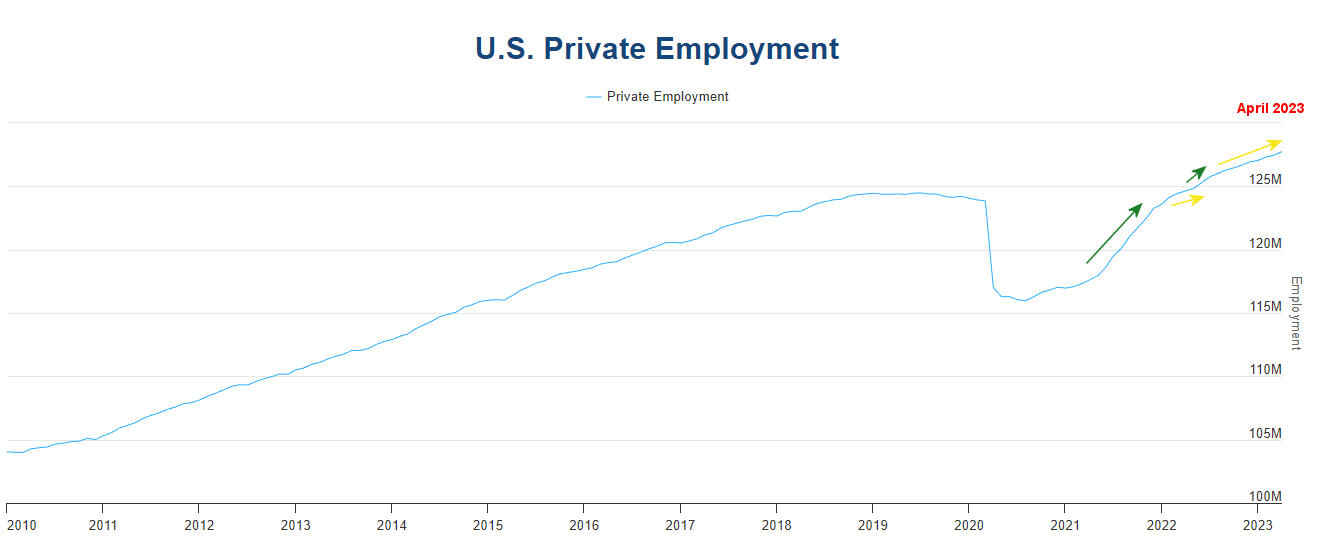
- Employment 157.983 million Up from 157.092 million
- Next data release April 4th, 2025
Summary:
Total Employed increased in February, but Unadjusted Unemployment was up. Seasonally adjusted Unemployment also increased.
According to the Commissioner of the U.S. Bureau of Labor Statistics:
“Total nonfarm payroll employment rose by 151,000 in February, and the unemployment rate changed little at 4.1 percent, the U.S. Bureau of Labor Statistics reported today. Employment trended up in health care, financial activities, transportation and warehousing, and social assistance. Federal government employment declined…
Both the unemployment rate, at 4.1 percent, and the number of unemployed people, at 7.1 million, changed little in February. The unemployment rate has remained in a narrow range of 4.0 percent to 4.2 percent since May 2024…
In February, employment trended up in health care, financial activities, transportation and warehousing, and social assistance. Federal government employment declined.“
You can read the full BLS report here.
As usual, they are talking about “Seasonally Adjusted Jobs”.
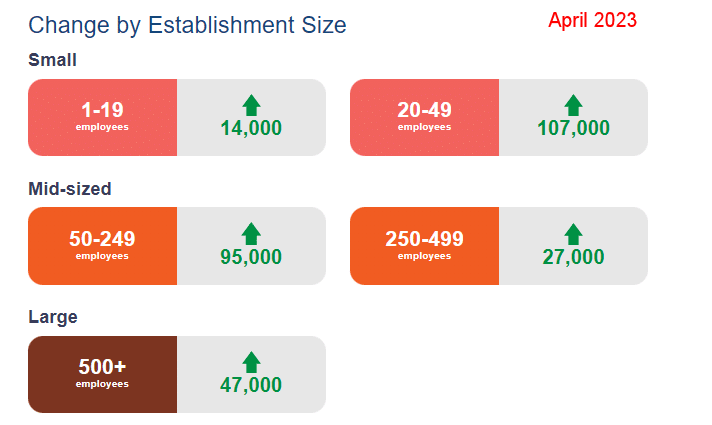
Looking at the Unadjusted Establishment Survey report we see…
Originally the BLS reported employment of 157.091 million jobs for January
which they just adjusted slightly to 157.092 million.
They are currently reporting 157.983 million jobs for February which is actually an increase of 892,000 jobs.
Despite the rise in employment, unemployment was also up, and the Labor Force participation rate was down.
The LFPR was down from 62.6% to 62.4%.
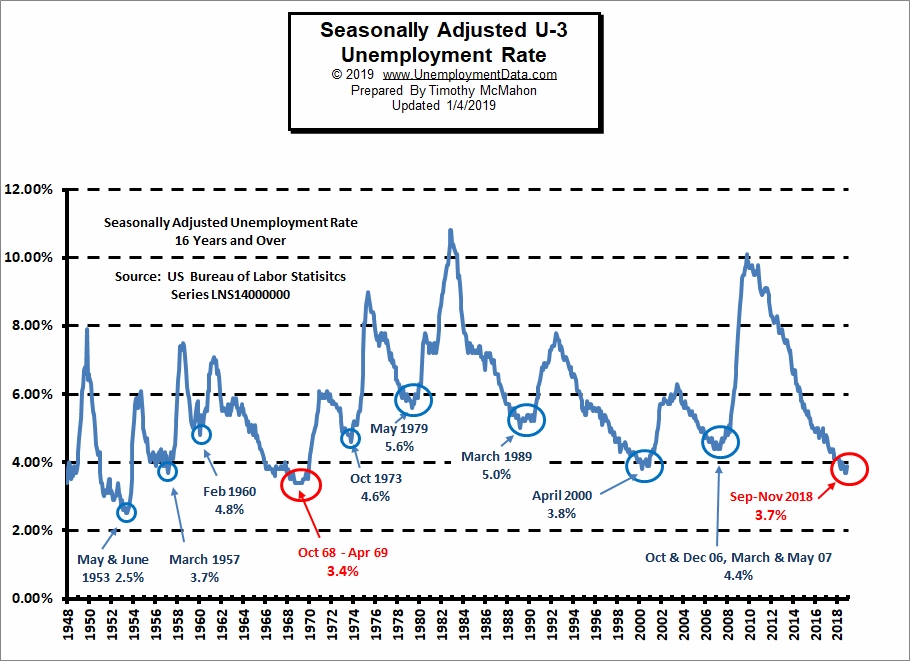
Current Unemployment Rate Chart
As the chart below shows, although unemployment is still low, it is above the lows of 2019 and 2023. At 4.1%, Seasonally Adjusted unemployment is still “Very Good”.