• About WordPress
    • WordPress.org
    • Documentation
    • Learn WordPress
    • Support
    • Feedback
  • Log In
  • Skip to primary navigation
  • Skip to main content
  • Skip to primary sidebar
  • Home
  • Contact us
  • Related Sites
    • InflationData.com
    • Financial Trend Forecaster
    • Your Family Finances
    • Elliott Wave University
    • Optio Money
  • About
    • Terms of Use
    • Disclaimer & Disclosure
    • Privacy Statement
  • Sitemap
    • 2009-2010 Posts
    • 2011 Posts

UnemploymentData.com

Your Source for Employment and Unemployment Data

Unemployment
  • Charts
    • Current Unemployment Rate Chart
    • Current Employment Rate (Chart and Data)
    • Current Employment vs Unemployment Chart
    • Historical Employment Data
    • Employment Population Ratio
    • Misery Index
  • Unemployment
    • Historical Unemployment Rate Tables
    • What Is U-6 Unemployment?
    • Unadjusted vs. Seasonally Adjusted U-3 Unemployment Rate
    • BLS vs. Gallup Unemployment Numbers
    • Current U-6 Unemployment Rate
    • What is the Labor Force Participation Rate?
    • What is the Real Unemployment Rate?
  • Employment
    • Current Employment Rate (Chart and Data)
    • Historical Employment Data
    • Contacting a Live Person at the State Employment Commission
      • How to Talk to a Live Person at the Virginia Unemployment Commission
      • Florida’s FLUID Unemployment Program
    • Benefits
      • Insurance
      • Retirement
    • Careers
    • Employment Costs
    • Experience
    • Government
    • Job Hunting
      • Interview
      • Resume
  • Find Articles
  • Education
    • Skills
  • General
    • Small Business
      • Outsourcing
    • Success
You are here: Home / Archives for full employment

full employment

March: Full Employment?

April 8, 2023 by Tim McMahon

The U.S. Bureau of Labor Statistics (BLS) released its employment / unemployment report for March on April 7th 2023.

Employment Up and Unemployment Down

Current Seasonally Adjusted Unemployment

  • Adjusted U-3 was 3.5% down from 3.6%
  • Unadjusted U-3 was 3.6% down from 3.9%
  • Unadjusted U-6 was Down from 7.3% to 6.8%
  • Labor Force Participation Up from 62.5% to 62.6%
  • Unadjusted Employment rose from 153.997 to 154.517 million


According to the Commissioner of the U.S. Bureau of Labor Statistics:

“Total nonfarm payroll employment rose by 236,000 in March, and the unemployment rate changed little at 3.5 percent, the U.S. Bureau of Labor Statistics reported today. 
Employment continued to trend up in leisure and hospitality, government, professional and business services, and health care.”

You can read the full BLS report here.

As usual, they are talking about “Seasonally Adjusted Jobs”.

Looking at the Establishment Survey report we see…
Originally the BLS reported employment of 153.955 million for February which they adjusted to 153.997 million. So they added 42,000 jobs for February. They are reporting 154.517 million jobs for March which is actually an increase of 562,000 jobs based on their original estimates or an increase of 520,000 based on their updated numbers.
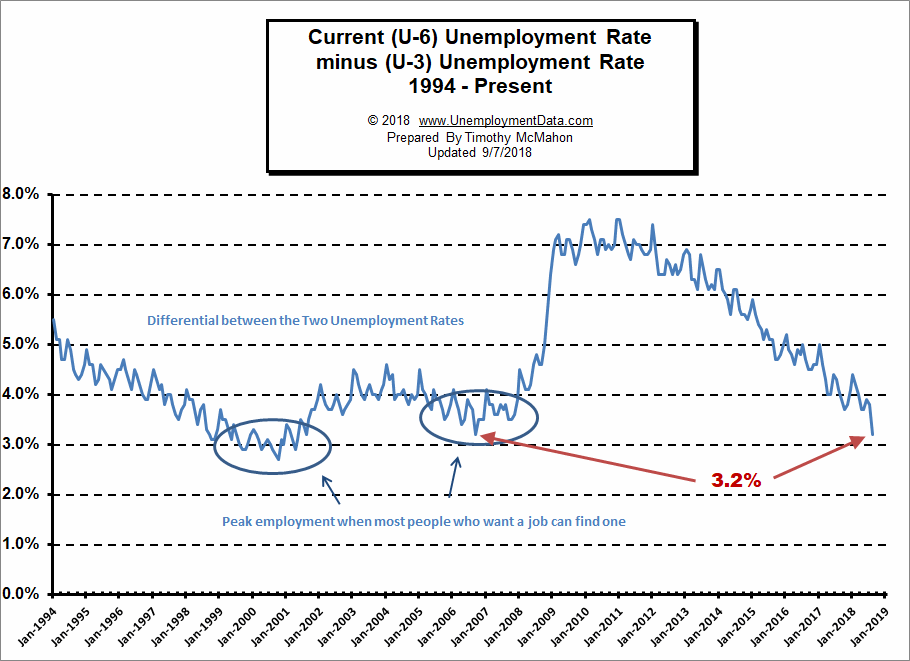
Full Employment?

Full Employment is when everyone who wants a job has one. It is generally considered to be slightly above 3%. Although, other factors, such as unemployment benefits, can shift the level higher or lower. So, if unemployment benefits are extended from 6 months to 1 year, people will tend to stay unemployed longer, thus raising the unemployment rate.

In the following chart, we can see four examples of employment continuing to rise, but unemployment flattens out at just over 3%.

Emp vs Unemployment Chart

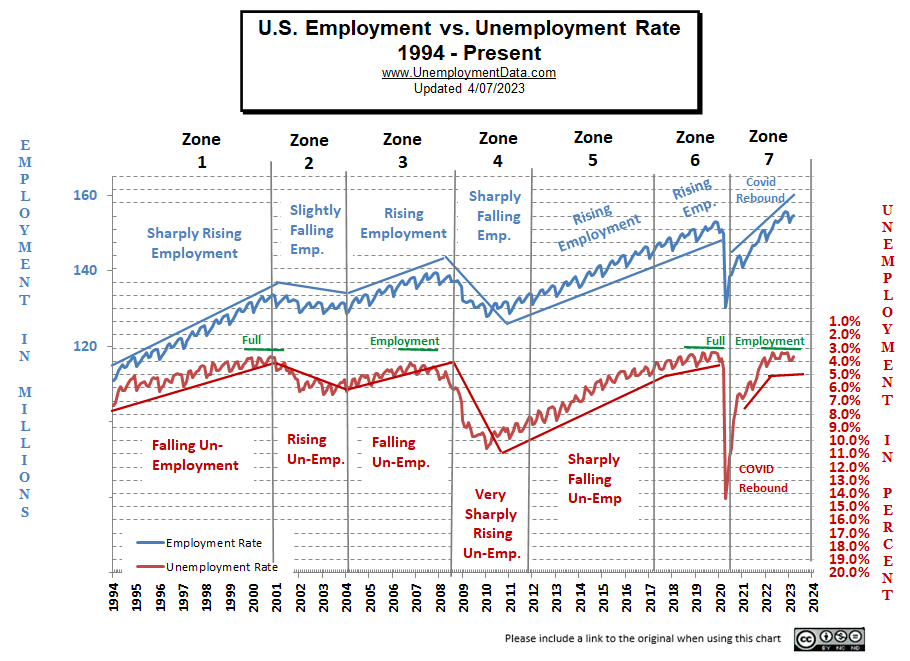
Full employment is not considered to be at zero percent because even when employers are having difficulty finding employees, some people are still unemployed due to either structural unemployment (mismatch between worker skills and job requirements, i.e., not enough training) or simply because they quit their job knowing it would be easy to find another (hopefully better) job. Often referred to as frictional unemployment (there will always be people who have quit or have lost a seasonal job and are in the process of getting a new job). See: Highly Skilled Worker Shortage in a Recession?

If the unemployment rate stays constant, but more people are working, where are these extra workers coming from?

Somehow the workforce has to be growing to accommodate these newly created jobs. They could be long-term unemployed (no longer counted in the workforce) returning to the workforce, they could be immigrants entering the workforce, or possibly retired people coming out of retirement because of an offer too good to turn down.

ADP® National Employment Report

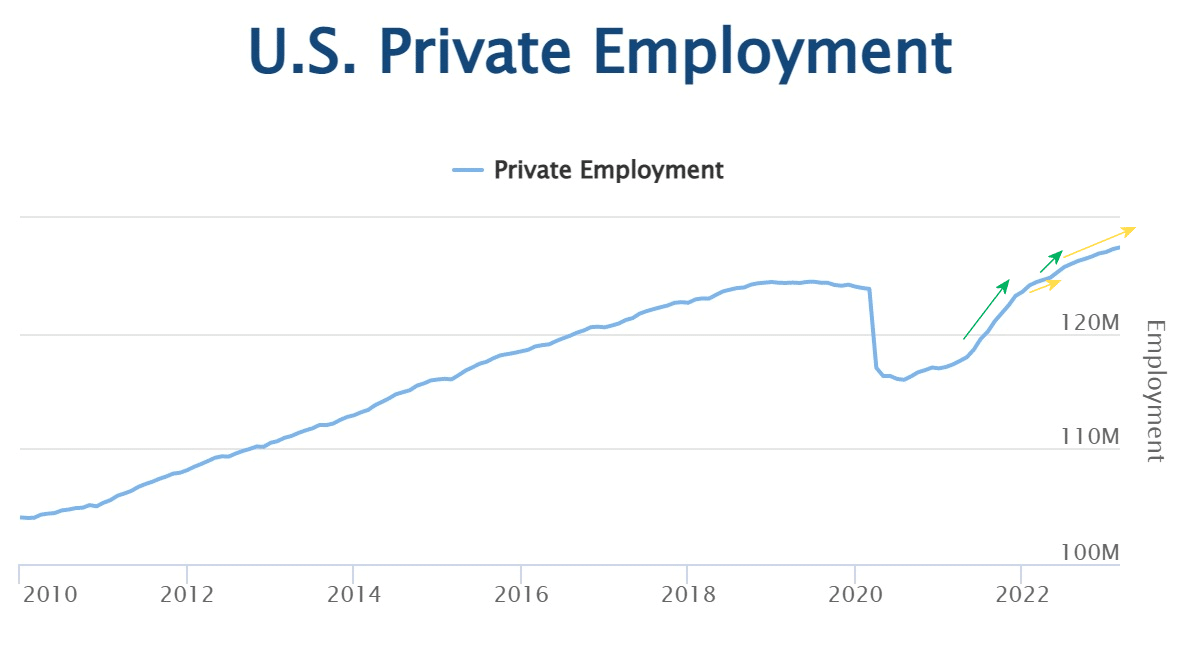
According to ADP® In collaboration with Stanford Digital Economy Lab, private employment was up in March.

ADP: Private employers added 145,000 jobs in March.

ADP Economist

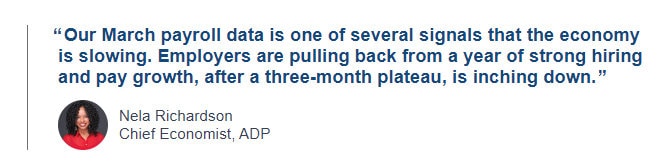
In other words, Ms. Richardson is saying that a 145,000 increase in jobs is not as high as she would have expected for a March with strong growth. And “pay growth” has plateaued and decreased slightly. Last month, “Job stayers” averaged a 7.2% annual increase in pay, while this month, the average annual increase is down to 6.9%.

I’ve added some arrows to their private employment chart to indicate the slope of the line. The long green arrow shows the rapid post-COVID rebound in employment. Then in early 2022, the rate of increase slowed (small yellow arrow). Then around March 2022, the rate of increase picked up again (small green arrow). Perhaps, that is what Ms. Richardson was expecting. But instead, we’ve seen steady growth without the turbo boost of last year.

ADP us-private-employment cHART

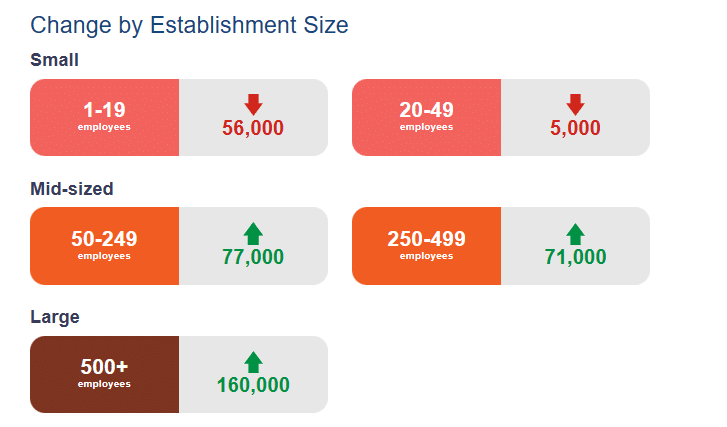
ADP Private Employment by Firm Size

ADP also lists increases by “firm size”.
This month, small companies are reversing the downsizing they did last month, while larger companies cut way back on their hiring.

March ADP Changes:

Change by Est Size for Mar 2023

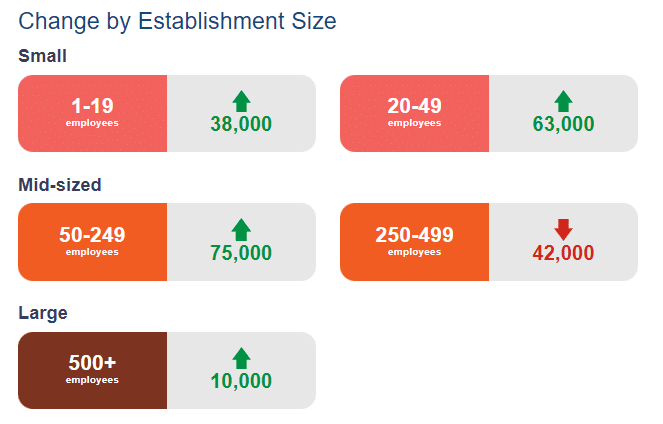
Comparing March changes to February changes we can see that increases shifted from large firm hiring to small firm hiring.

February ADP Changes:

Change by Est Size for Feb 2023

ADP Also Tracks Salary Changes:

[Read more…] about March: Full Employment?

Filed Under: Unemployment Tagged With: full employment, March 2023

Full Employment is Near – Differential between U3 and U6 reaches September 2006 Lows

September 8, 2018 by Tim McMahon

Adj U3 Icon 3-9 unchangedCorrection: The differential was only 3.5% in August 2018 and 3.2% in September 2006 so we are only nearing the 2006 level not at the 2006 level.

The U.S. Bureau of Labor Statistics (BLS) released their monthly employment survey results for the month of August on September 7th .

The current “Seasonally Adjusted” Unemployment Rate for August (released September 7th) is 3.9% unchanged from last month. 

Looking back, Seasonally Adjusted U-3 started 2017 at 4.8% then it bounced around between 4.3% and 4.4% from April through October 2017, then it was 4.1% from October 2017 through March 2018. It was 3.9% in April, 3.8% in May, 4.0% in June, and 3.9% in July.

Typically Unemployment levels are worse in June and July so seasonally adjusting takes that into consideration.


Unadjusted
U-3

Unadjusted
U-3
2017 2018
May 4.1% 3.6%
June 4.5% 4.2%
July 4.6% 4.1%
August 4.5% 3.9%


Key August Employment and Unemployment Numbers

  • Adjusted U-3 Unemployment-   3.9% unchanged from July, down from 4.0% in June but above the 3.8% in May, it was 3.9% in April but still Below the 4.1% October 2017 – March 2018.
  • Unadjusted U-3 Unemployment-  3.9% down from 4.1% in July and 4.2% in June but still above the 3.6% in May, and 3.7% in April below the 4.1% in March.
  • Unadjusted U-6 Unemployment-   7.4% down from 7.9% in July, 8.1% in June, up slightly from record lows of 7.3% in May, and 7.4% in April. Below the 8.1% in March and 8.6% in February.
  • Employment 149.226 million up from 148.901 million in July.
  • August Labor Force Participation Rate 62.7% down from July LFPR 62.9%  

See Current Unemployment Chart for more info.

Full Employment is Near – Differential between U3 and U6 reaches September 2006 Lows

In August we saw a massive drop in the differential between U-3 and U-6 so perhaps we are getting closer to “full employment”  the lows on this chart are at 2.7% in October 2000 and 3.2% in September 2006. Since the current differential is once again 3.2% we have reached the lows of 2006. Back in January 2017 the media was saying that we were at “Full Employment” and we couldn’t expect anything better, manufacturing jobs would never come back etc. At that time I said we had a long way to go and that the differential between the U-6 and U-3 was nowhere near bottoming (the sign of full employment) at the time the differential was around 5%. See: Is the U.S. Really at “Full Employment”? But with the differential currently at 3.2% now we are at or very near that level. Since October 2000 reached a low of 2.7% we could still  go a bit lower.U6 minus U3 Unemployment

See Current U-6 Unemployment Rate for more info.

Employment by Sector

The employment “bubble chart” gives us a good representation of how each sector of the economy is doing (employment wise). As we can see from the chart below [Read more…] about Full Employment is Near – Differential between U3 and U6 reaches September 2006 Lows

Filed Under: BLS, Sector Tagged With: employment, Employment by Sector, full employment, Labor Force Participation Rate, LFPR, Sector, U-6 Unemployment, unemployment

Why the U.S. Isn’t at “Full Employment” Yet

May 5, 2017 by Tim McMahon

The news is bristling with excitement as all the major media outlets are jumping on today’s employment numbers hot off the Bureau of Labor Statistics presses. The BLS reported that the Seasonally Adjusted U-3 unemployment rate was just 4.4% and the unadjusted broader based U-6 was just 8.1%.

In response to all this good news The New York Times said, “We’re Getting Awfully Close to Full Employment” and The Wall Street Journal trumpeted “Jobs Report: This Is What Full Employment Looks Like” so who am I to throw cold water on their parade? Well, at least I’m not the only one to have my doubts. Jared Bernstein at The Washington Post thinks that the current low inflation level is a factor that may indicate that we aren’t quite there yet. So I’m adding my own two-cents with the following chart. We regularly publish the U-6 minus U-3 chart which shows the differential between the ordinary unemployed U-3 and the bottom of the barrel unemployed U-6. By definition, in order to be at “full-employment” everyone who wants a job has to have one.  That doesn’t mean Zero unemployment because there is a bit of friction in the system and so when people change jobs they are temporarily “unemployed” so there will always be some. Historically, this was assumed to be around 3% unemployment. So as the U-3 unemployment approaches 3% the U-6 people get drawn into the market. They may not have the skills or the ambition or the whatever but now they can find a job because companies are desperate.

So by looking at the U-6 minus the U-3 we can get a very good picture of when we are nearing “full employment”. So let’s look at that chart. [Read more…] about Why the U.S. Isn’t at “Full Employment” Yet

Filed Under: Unemployment Tagged With: full employment, gallup, Labor Force, Participation Rate, U6 minus U3

Is the U.S. Really at “Full Employment”?

January 6, 2017 by Tim McMahon

Back in February of 2016 Fortune magazine published an article entitled “The U.S. Economy Is Finally at Full Employment”  and then in May CNN-Money published an article entitled The U.S. is ‘basically at full employment’ quoting San Francisco Federal Reserve President John Williams as saying “We’re basically at full employment…that’s very good news.”

“We’re basically at full employment…that’s very good news.”  San Francisco Federal Reserve President John Williams

So what is “Full-Employment” and are we really there? At first glance you might think that full employment should equal 0% and with the current unemployment rate hovering around 4.7% we obviously aren’t there. But Full employment, in macroeconomics, is defined by many economists as being an acceptable level of unemployment somewhere above 0%.

Even when employers are having difficulty finding employees some people are [Read more…] about Is the U.S. Really at “Full Employment”?

Filed Under: Unemployment Tagged With: full employment, U-3, U-6, unemplyment

What is Full Employment?

September 2, 2012 by Chris Keenan

In the world of employment data, unemployment statistics get a lot of attention. They have a huge impact on the economy as a whole and they also affect several other areas. Although a certain percentage of unemployment is the norm in every economy in the world, economic theory has a concept known as full employment. What exactly is full employment and why is it significant to economists?

Full Employment= Job Eutopia

Full employment is a theoretical scenario that occurs when the entire labor force is being used in the most efficient way possible. All of the skilled labor has a job in the field that they want to be in and all of the unskilled labor has a satisfactory job as well. It is possible for an economy to have full employment, although it’s not very easy to pull off.

See Labor Immobility and the Labor Participation Rate for some limiting factors in the pursuit of full employment.

Frictional Unemployment

Although the term “full employment” sounds like everyone is working, that isn’t necessarily the case. Even during times of full employment, there are still some workers who are not working. Most of these people are considered to be in frictional unemployment. What exactly is frictional unemployment? Frictional unemployment is a term that is used to describe those who are in between jobs, but are still in the workplace. For example, if you are working in a job, and you determine that you don’t like your employer, you might decide to quit and look for a new job. During the time period where you are looking for new employment, you are considered to be in [Read more…] about What is Full Employment?

Filed Under: Employment Tagged With: employment, frictional unemployment, full employment, unemployment, unemployment rate, usa, work

Primary Sidebar

Search Site

Sponsored:

URGENT: These Stocks Stand Poised to Benefit from President Trump's Trade Wars!

As the Trump administration moves ahead with aggressive tariff policies on key imports, the mainstream media is scrambling.

This Free Report - which you can download now - reveals the names and ticker symbols of 5 Stock Poised to Benefit Most from President Trump's Tariff Wars.

Click Here to Download Your FREE Stock Report Now.

Recent Posts

  • April 2025 Employment / Unemployment Report
  • Would More Jobs Help Social Security?
  • March 2025- Employment / Unemployment Report
  • February 2025 Jobs Report
  • January 2025 BLS Employment Report

Resources

  • Bureau of Labor Statistics Current Population Survey Monthly survey of households conducted by the Bureau of Census for BLS. It provides data on the labor force, employment, unemployment, etc.
  • Capital Professional Services Providing web design and development and Internet marketing services
  • Elliott Wave University Using the Elliott Wave Principle to improve investment performance
  • Financial Trend Forecaster Featuring Moore Inflation Predictor, NYSE Rate of Change and NASDAQ Rate of change
  • InflationData.com Inflation calculators, databases, etc.
  • Intergalactic Web Designers Web design and development services
  • Your Family Finances

Articles by Category

Articles by Date

Disclaimer

At UnemploymentData.com we are not registered investment advisors and do not provide any individualized advice. Past performance is not necessarily indicative of future performance and future accuracy and profitable results cannot be guaranteed.

Privacy & Terms of Use

Privacy Statement & Terms of Use

Do Not Sell My Information

Copyright © 2025 · News Pro on Capital Professional Services, LLC. All rights reserved · Log in