
The U.S. Bureau of Labor Statistics (BLS) released their employment / unemployment report for August.
![]()
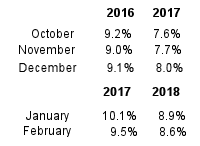
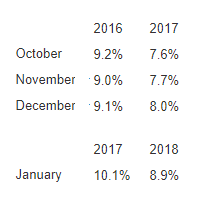
- Unadjusted U-3 was Down from 5.7% to 5.3%
- Adjusted U-3 was Down from 5.4% to 5.2%
- Unadjusted U-6 was Down from 9.6% to 8.9%
- Labor Force Participation unchanged at 61.7%
- Unadjusted Employment rose from 146.544 million to 146.856 million
The Pandemic Emergency Unemployment Compensation program, which extends unemployment benefits by up to 24 weeks for those who have exhausted regular unemployment aid, and the $300 weekly supplement to state unemployment benefits, are due to expire on September 6. This may be the motivation some unemployed individuals needed to get back to work. Many have complained that the government assistance was paying certain people at the lower end of the payscale more to stay home than they could earn by going to work.
According to the Commissioner of the U.S. Bureau of Labor Statistics:
Total nonfarm payroll employment rose by 235,000 in August, and the unemployment rate declined by 0.2 percentage point to 5.2 percent, the U.S. Bureau of Labor Statistics reported today. So far this year, monthly job growth has averaged 586,000. In August, notable job gains occurred in professional and business services, transportation and warehousing, private education, manufacturing, and other services. Employment in retail trade declined over the month.
As usual, they are talking about “Seasonally Adjusted Jobs” from the “Current Population Survey (CPS)” rather than looking at the results reported by actual companies in their “Current Employment Statistics survey (CES)”
But looking at the CES report we see…
Originally the BLS reported 146.470 for July which they adjusted to 146.544 million. For August they are currently saying employment is 146.856 million which is actually an increase of 386,000 jobs based on their original estimates or an increase of 312,000 based on their updated numbers.
[Read more…] about August Unemployment Improves as Pandemic Benefits Expire
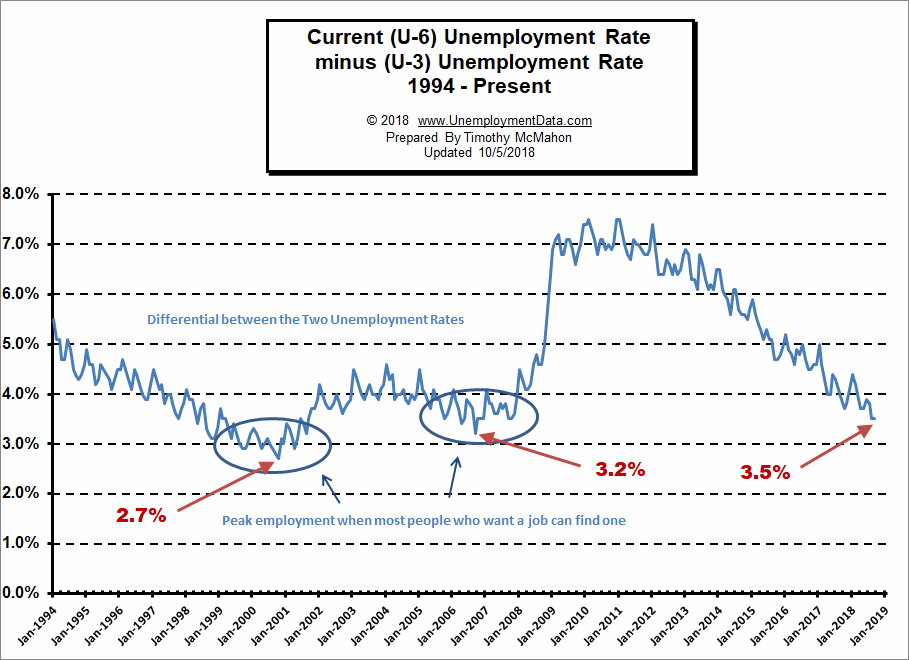
 Looking at the broader measure of Unemployment which includes discouraged workers, we see that the U-6 unemployment rate fell from 8.9% in
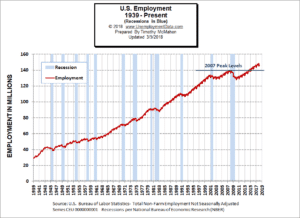
 Over the same period, Unadjusted U-6 unemployment which is a broader measure of Unemployment including discouraged workers, climbed steadily.
 Over the last month, the actual number of people working (not seasonally adjusted) has decreased by