• About WordPress
    • WordPress.org
    • Documentation
    • Learn WordPress
    • Support
    • Feedback
  • Log In
  • Skip to primary navigation
  • Skip to main content
  • Skip to primary sidebar
  • Home
  • Contact us
  • Related Sites
    • InflationData.com
    • Financial Trend Forecaster
    • Your Family Finances
    • Elliott Wave University
    • Optio Money
  • About
    • Terms of Use
    • Disclaimer & Disclosure
    • Privacy Statement
  • Sitemap
    • 2009-2010 Posts
    • 2011 Posts

UnemploymentData.com

Your Source for Employment and Unemployment Data

Unemployment
  • Charts
    • Current Unemployment Rate Chart
    • Current Employment Rate (Chart and Data)
    • Current Employment vs Unemployment Chart
    • Historical Employment Data
    • Employment Population Ratio
    • Misery Index
  • Unemployment
    • Historical Unemployment Rate Tables
    • What Is U-6 Unemployment?
    • Unadjusted vs. Seasonally Adjusted U-3 Unemployment Rate
    • BLS vs. Gallup Unemployment Numbers
    • Current U-6 Unemployment Rate
    • What is the Labor Force Participation Rate?
    • What is the Real Unemployment Rate?
  • Employment
    • Current Employment Rate (Chart and Data)
    • Historical Employment Data
    • Contacting a Live Person at the State Employment Commission
      • How to Talk to a Live Person at the Virginia Unemployment Commission
      • Florida’s FLUID Unemployment Program
    • Benefits
      • Insurance
      • Retirement
    • Careers
    • Employment Costs
    • Experience
    • Government
    • Job Hunting
      • Interview
      • Resume
  • Find Articles
  • Education
    • Skills
  • General
    • Small Business
      • Outsourcing
    • Success
You are here: Home / Archives for Employment by Sector

Employment by Sector

June Unemployment Higher

July 6, 2019 by Tim McMahon

Adjusted U3 3.7%The U.S. Bureau of Labor Statistics (BLS) released their monthly unemployment survey results for June on July 5th. Unemployment is still near record lows but it has ticked up a bit.

According to the Commissioner of the U.S. Bureau of Labor Statistics:

” Nonfarm payroll employment increased by 224,000 in June, and the unemployment rate was little changed at 3.7 percent.
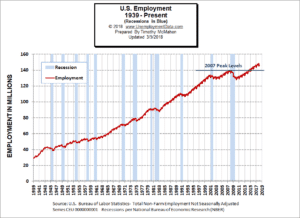
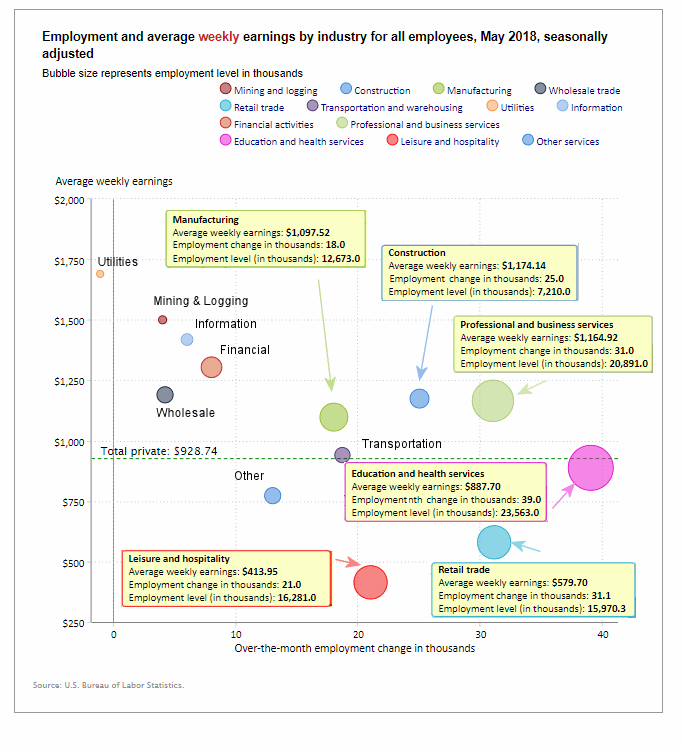
Over the month, notable job gains occurred in professional and business services, in health care, and in transportation and warehousing.”

Of course the Commissioner is talking about “Seasonally Adjusted Jobs” in reality there were 152.307 million people employed in June up from 151.600 million employed in May so the actual increase was 707,000 new jobs in June. There were only 148.295 million employed in January so there are  over 4 million more people employed in June than in January!

Key factors in the report were:

Employment in Professional and Business Services increased by 51,000…
Health care employment increased by 35,000 in June…
Employment in transportation and warehousing increased by 24,000
Construction employment rose by 21,000…

For more info see our Current Unemployment Chart and Current U.S. Employment Chart commentary:

Key June Employment and Unemployment Numbers

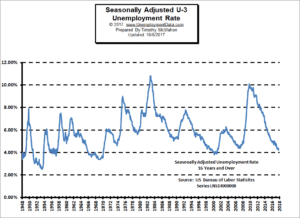
  • Adjusted U-3 Unemployment-   3.7% Up from 3.6% in May 
  • Unadjusted U-3 Unemployment-  3.8% Up from 3.4% in May but still below 4.1% in February, and 4.4% in January.
  • Unadjusted U-6 Unemployment-  7.5% Up from 6.7% in May. It was 7.5% in March, 7.7% in February and 8.8% in January.
  • Unadjusted Employment (Establishment Survey)- 152.307 million up from 151.600 Million in May and  148.295 million in January.
  • Labor Force Participation Rate- 62.9% up from 62.8% in April and May down from 63.0% in March and from the peak of 63.2% in February.

Current Seasonally Adjusted U-3 levels are still below the 3.8% lows of 2000. Prior to that we have to go all the way back to 1969 to see better unemployment levels than we have currently. If we break below 3.4% we have to go all the way back to 1953 to find lower levels and remember that was during the boom that followed WWII with a massive loss of the workforce due to the war so we probably won’t see levels that low again.

[Read more…] about June Unemployment Higher

Filed Under: BLS Tagged With: BLS, Bureau of Labor Statistics, employment, Employment / Population Ratio, Employment by Sector, June 2019, Labor Force Participation Rate, LFPR, unemployment

April Unemployment Lowest since 1969

May 4, 2019 by Tim McMahon

The U.S. Bureau of Labor Statistics (BLS) released their monthly unemployment survey results for April on May 3rd and it is much better than anyone expected.

According to the U.S. Bureau of Labor Statistics:

The U.S. economy created 263,000 jobs in April and the seasonally adjusted unemployment rate dropped to 3.6 percent.

That far exceeded the 180,000 estimated by economists. Last month the economists projected a 175,000 jobs gain and instead got 196,000 for two excellent months in a row.


According to the BLS Commissioner’s report for this month:

“In April, nonfarm payroll employment increased by 263,000, and the unemployment rate declined to 3.6 percent. Over the month, notable job gains occurred in professional and business services, construction, health care, and social assistance. The April employment gain compares with an average monthly gain of 213,000 over the prior 12 months. (The prior 12-month average incorporates revisions for February and March, which increased nonfarm payroll employment by 16,000 on net.)”

Key factors in the report were:
Employment in professional and business services increased by 76,000…
Construction employment rose by 33,000…
Employment in health care increased by 27,000…
Seasonally Adjusted U-3 Unemployment is the lowest rate since December 1969.

Of course the Commissioner is talking about “Seasonally Adjusted” jobs. In unadjusted terms March had 149.862 million jobs while April had 150.988 million jobs for an actual increase of 1,126,000 jobs.

For more info see our Current Unemployment Chart and Current U.S. Employment Chart commentary:

Key April Employment and Unemployment Numbers

  • Adjusted U-3 Unemployment-   3.6% Down from 3.8% in March 
  • Unadjusted U-3 Unemployment-  3.3% down from 3.9% in March and 4.1% in February, and 4.4% in January.
  • Unadjusted U-6 Unemployment-  6.9% down from 7.5% in March, 7.7% in February and 8.8% in January, 7.5% in December.
  • Unadjusted Employment (Establishment Survey)- 150.988 million up from 149.862 million in March, 149.143 million in February and 148.295 million in January.
  • Labor Force Participation Rate- 62.8% down from 63.0% in March and from the peak of 63.2% in February.

Current Seasonally Adjusted U-3 levels are below the 3.8% lows of 2000. Prior to that we have to go all the way back to 1969 to see better unemployment levels than we have currently. If we break below 3.4% we have to go all the way back to 1953 to find lower levels and remember that was during the boom that followed WWII with a massive loss of the workforce due to the war so we probably won’t see levels that low again.

[Read more…] about April Unemployment Lowest since 1969

Filed Under: BLS Tagged With: BLS, employment, Employment by Sector, unemployment

March Unemployment Numbers Celebrated

April 6, 2019 by Tim McMahon

Adjusted U3 UnemploymentThe U.S. Bureau of Labor Statistics (BLS) released their monthly unemployment survey results for March on April 5th and it has the market pundits celebrating. Last month they worried over the mere 20,000 jobs created after projections were for 175,000 jobs.

This month once again the projections were for 175,000 new jobs but the BLS says there were 195,000 new jobs so the market is happy.

As we said in the Current Unemployment Chart commentary:

According to the BLS Commissioner’s report for this month:
“Total nonfarm payroll employment increased by 196,000 in March, and the unemployment rate was unchanged at 3.8 percent, the U.S. Bureau of Labor Statistics reported today. Notable job gains occurred in health care and in professional and technical services… The employment-population ratio was 60.6 percent in March and has been either 60.6 percent or 60.7 percent since October 2018… Health care added 49,000 jobs in March and 398,000 over the past 12 months… Employment in professional and technical services grew by 34,000 in March and 311,000 over the past 12 months. “

Key factors in the report were the unemployment rate for Women dropped to another mega low of 3.3% from 3.6% last month.
Black unemployment was 6.7% and Hispanic Unemployment was 4.7%.

Last month the media was unpleasantly surprised by the Jobs report being lower than the consensus and this month they were pleasantly surprised by the higher than expected jobs. “Economists surveyed by The Wall Street Journal expected that the jobs report would show solid growth by 175,000 jobs”  but instead the report showed 196,000 “Seasonally Adjusted” jobs created, “making March the 102nd straight month of job growth”. In unadjusted terms February had 149.867 million jobs while March had 149.133 million jobs for an actual increase of 724,000 jobs.

Key March Employment and Unemployment Numbers

  • Adjusted U-3 Unemployment-   3.8% unchanged from February but down from 4.0% in January, and 3.9% in December.
  • Unadjusted U-3 Unemployment-  3.9% down from 4.1% in February, and 4.4% in January, but above the 3.7% in December.
  • Unadjusted U-6 Unemployment-  7.5% down from 7.7% in February and 8.8% in January, 7.5% in December.
  • Unadjusted Employment (Establishment Survey)- 149.867 up from 149.143 in February and 148.295 million in January.
  • February Labor Force Participation Rate- 63.0% down from the peak of 63.2% in February, and 63.1% in December.

Current Seasonally Adjusted U-3 levels are still hovering around the lows of 2000. Prior to that we have to go all the way back to 1969 to see better unemployment levels than we have currently. Current levels are rising a bit from a cyclical low not seen since 1969. Also noteworthy is that levels do not stay this low for very long. The longest low like this was the seven month period from October 1968 through April 1969. Prior to 1969 was a one month low of 3.7% in 1957. On the plus side, [Read more…] about March Unemployment Numbers Celebrated

Filed Under: BLS Tagged With: BLS, Bubble Chart, Bureau of Labor Statistics, employment, Employment by Sector, Labor Force, Labor Force Participation, Labor Force Participation Rate, Seasonally Adjusted, U-6, unemployment

Unemployment Reaches Lowest Point Since 1969

October 6, 2018 by Tim McMahon

Seasonally Adjusted U-3 Unemployment RateAccording to the the U.S. Bureau of Labor Statistics (BLS) monthly unemployment survey results for the month of September 2018 the current “Seasonally Adjusted” Unemployment Rate for September is 3.7% the lowest level since December 1969 when it was 3.5%. Unfortunately, by December 1970 unemployment was up to 6.1%.

The lowest level reached in the 1968-1969 timeframe was 3.4% where it hovered from September 1968 through May 1969. The only other time that unemployment was this low since they began tracking unemployment in 1948 was briefly in 1948 and again in 1951-53.


Jan Feb Mar Apr May Jun Jul Aug Sep Oct Nov Dec
1965 4.9% 5.1% 4.7% 4.8% 4.6% 4.6% 4.4% 4.4% 4.3% 4.2% 4.1% 4.0%
1966 4.0% 3.8% 3.8% 3.8% 3.9% 3.8% 3.8% 3.8% 3.7% 3.7% 3.6% 3.8%
1967 3.9% 3.8% 3.8% 3.8% 3.8% 3.9% 3.8% 3.8% 3.8% 4.0% 3.9% 3.8%
1968 3.7% 3.8% 3.7% 3.5% 3.5% 3.7% 3.7% 3.5% 3.4% 3.4% 3.4% 3.4%
1969 3.4% 3.4% 3.4% 3.4% 3.4% 3.5% 3.5% 3.5% 3.7% 3.7% 3.5% 3.5%
1970 3.9% 4.2% 4.4% 4.6% 4.8% 4.9% 5.0% 5.1% 5.4% 5.5% 5.9% 6.1%

Key September Employment and Unemployment Numbers

  • Adjusted U-3 Unemployment:  3.7% down from 3.9% in August, This is the lowest Seasonally Adjusted Unemployment rate since 1969.
  • Unadjusted U-3 Unemployment:  3.6% down from 3.9% in August and 4.1% in July and 4.2% in June.
  • Unadjusted U-6 Unemployment:   7.1% down from 7.4% in August and 7.9% in July, 8.1% in June, and below record lows of 7.3% in May, and 7.4% in April.
  • Employment: 149.741 million up from 149.226 million originally reported for August.
  • September Labor Force Participation Rate: 62.7% unchanged from August but down from July 62.9%.

See Current Unemployment Chart for more info.

Full Employment is Near – Differential between U3 and U6 nearing September 2006 Lows

Last month we incorrectly reported that the differential between the unadjusted U3 and U6 (reached by subtracting U3 from U6) was at 3.2% when in fact it was only at 3.5% so it still had a little way to go to reach the 3.2% low of September 2006. This month, although both U3 and U6 have fallen the differential remains at the 3.5% level.

U6 minus U3 Unemployment Rate

See Current U-6 Unemployment Rate for more info.

Employment by Sector

The employment “bubble chart” gives us a good representation of how each sector of the economy is doing (employment wise). As we can see from the chart below  [Read more…] about Unemployment Reaches Lowest Point Since 1969

Filed Under: BLS Tagged With: 1969, 2018, Differential, employment, Employment / Population Ratio, Employment by Sector, Labor Force Participation Rate, September, U3 and U6, unemployment rate

Full Employment is Near – Differential between U3 and U6 reaches September 2006 Lows

September 8, 2018 by Tim McMahon

Adj U3 Icon 3-9 unchangedCorrection: The differential was only 3.5% in August 2018 and 3.2% in September 2006 so we are only nearing the 2006 level not at the 2006 level.

The U.S. Bureau of Labor Statistics (BLS) released their monthly employment survey results for the month of August on September 7th .

The current “Seasonally Adjusted” Unemployment Rate for August (released September 7th) is 3.9% unchanged from last month. 

Looking back, Seasonally Adjusted U-3 started 2017 at 4.8% then it bounced around between 4.3% and 4.4% from April through October 2017, then it was 4.1% from October 2017 through March 2018. It was 3.9% in April, 3.8% in May, 4.0% in June, and 3.9% in July.

Typically Unemployment levels are worse in June and July so seasonally adjusting takes that into consideration.


Unadjusted
U-3

Unadjusted
U-3
2017 2018
May 4.1% 3.6%
June 4.5% 4.2%
July 4.6% 4.1%
August 4.5% 3.9%


Key August Employment and Unemployment Numbers

  • Adjusted U-3 Unemployment-   3.9% unchanged from July, down from 4.0% in June but above the 3.8% in May, it was 3.9% in April but still Below the 4.1% October 2017 – March 2018.
  • Unadjusted U-3 Unemployment-  3.9% down from 4.1% in July and 4.2% in June but still above the 3.6% in May, and 3.7% in April below the 4.1% in March.
  • Unadjusted U-6 Unemployment-   7.4% down from 7.9% in July, 8.1% in June, up slightly from record lows of 7.3% in May, and 7.4% in April. Below the 8.1% in March and 8.6% in February.
  • Employment 149.226 million up from 148.901 million in July.
  • August Labor Force Participation Rate 62.7% down from July LFPR 62.9%  

See Current Unemployment Chart for more info.

Full Employment is Near – Differential between U3 and U6 reaches September 2006 Lows

In August we saw a massive drop in the differential between U-3 and U-6 so perhaps we are getting closer to “full employment”  the lows on this chart are at 2.7% in October 2000 and 3.2% in September 2006. Since the current differential is once again 3.2% we have reached the lows of 2006. Back in January 2017 the media was saying that we were at “Full Employment” and we couldn’t expect anything better, manufacturing jobs would never come back etc. At that time I said we had a long way to go and that the differential between the U-6 and U-3 was nowhere near bottoming (the sign of full employment) at the time the differential was around 5%. See: Is the U.S. Really at “Full Employment”? But with the differential currently at 3.2% now we are at or very near that level. Since October 2000 reached a low of 2.7% we could still  go a bit lower.U6 minus U3 Unemployment

See Current U-6 Unemployment Rate for more info.

Employment by Sector

The employment “bubble chart” gives us a good representation of how each sector of the economy is doing (employment wise). As we can see from the chart below [Read more…] about Full Employment is Near – Differential between U3 and U6 reaches September 2006 Lows

Filed Under: BLS, Sector Tagged With: employment, Employment by Sector, full employment, Labor Force Participation Rate, LFPR, Sector, U-6 Unemployment, unemployment

Key July Employment and Unemployment Numbers

August 4, 2018 by Tim McMahon

U-3 Unemployment 3.9%The U.S. Bureau of Labor Statistics (BLS) released their monthly employment survey results for the month of July on Friday August 3rd .

The current “Seasonally Adjusted” Unemployment Rate for July (released August 3rd) is 3.9% down from 4.0% last month. It was 3.8% in May and 3.9% in April. Unemployment was  4.1% from October 2017 through March 2018. Seasonally adjusted unemployment bounced around between 4.3% and 4.4% from April through October 2017, after declining from 4.8% in January 2017.

Typically Unemployment levels are worse in June and July so seasonally adjusting takes that into consideration. If we look at Unadjusted Unemployment we see that in 2017 it jumped from 4.1% in May to 4.5% in June at the same time the Seasonally Adjusted numbers simply went from 4.3% to 4.4%.

Key July Employment and Unemployment Numbers

  • Adjusted U-3 Unemployment-   3.9% down from 4.0% in June but up from the 3.8% in May, 3.9% in April but still Below the 4.1% October – March.
  • Unadjusted U-3 Unemployment-  4.1% down from 4.2% in June up from 3.6% in May, 3.7% in April and  4.1% in March.
  • Unadjusted U-6 Unemployment-   7.9% down from 8.1% in June, up from 7.3% in May, 7.4% in April and from 8.1% in March and 8.6% in February.
  • Employment 148.901 million. BLS adjusted June employment up from 148.912 million as released to 150.057 million.
  • NOTE: On 8/3/2018 with the release of the new July numbers the BLS adjusted the June LFPR down to 62.9% from a recent high of 63.4%

See Current Unemployment Chart for more info.

Employment by Sector

The employment “bubble chart” gives us a good representation of how each sector of the economy is doing (employment wise). As we can see from the chart below [Read more…] about Key July Employment and Unemployment Numbers

Filed Under: Unemployment Tagged With: employment, Employment / Population Ratio, Employment by Sector, Labor Force, LFPR, Participation Rate, unemployment

June Employment Up AND Unemployment UP

July 7, 2018 by Tim McMahon

The U.S. Bureau of Labor Statistics (BLS) released their monthly employment survey results for the month of June on Friday July 6th .

According to the BLS, the current “Seasonally Adjusted” Unemployment Rate for June (released July 6th) is 4.0% up from 3.8% in May and 3.9% in April. It was  4.1% where it was stuck from October 2017 through March 2018. Prior to October it was bouncing around between 4.3% and 4.4% since April 2017, after declining from 4.8% in January 2017.

Typically Unemployment levels are worse in June and July, so even though 213,000 more people are employed, unemployment levels still went up. (Probably because students are swelling the labor force for the summer). Last year (2017) Unadjusted Unemployment jumped from 4.1% in May to 4.5% in June while Employment went from 146.937 million to 147.578 million. So even though more people are working more people are also looking for a job. This has driven the Labor Force Participation Rate at 63.4% to levels not seen in several years. NOTE: On 8/3/2018 with the release of the new July numbers the BLS adjusted the June LFPR down to 62.9%.

Key June Employment and Unemployment Numbers

  • Adjusted U-3 Unemployment-   4.0% Up from 3.8% in May, 3.9% in April but still Below the 4.1% October – March.
  • Unadjusted U-3 Unemployment-  4.2% up from 3.6% in May, 3.7% in April and  4.1% in March.
  • Unadjusted U-6 Unemployment-   8.1% up from 7.3% in May, 7.4% in April and from 8.1% in March and 8.6% in February.
  • Employment 149.980 million up from 149.334 million in May, 148.372 million in April and 147.384 million in March.
  • Gallup has discontinued publishing U-6 & U-3 numbers.

See Current Unemployment Chart for more info.

Employment by Sector

The employment “bubble chart” gives us a good representation of how each sector of the economy is doing (employment wise). As we can see from the chart below [Read more…] about June Employment Up AND Unemployment UP

Filed Under: BLS Tagged With: Bubble Chart, employment, Employment by Sector, June 2018, Labor Force Participation Rate, LFPR, unemployment

May Unemployment Lowest Since 2000

June 2, 2018 by Tim McMahon

Unemployment 3.8%

The U.S. Bureau of Labor Statistics (BLS) released their monthly employment survey results for the month of May on Friday June 1st .

According to the BLS the Seasonally Adjusted U-3 Unemployment Rate is at a new low. Unemployment has been falling and has now reached levels not seen since April of 2000. Current levels are even lower than during the boom of 2006. If they drop another 1/10th of a percent we will have to go all the way back to 1969 to find levels that low.

Many Experts consider this to be the new “Full Employment” level i.e. everyone who wants a job has found one however with the Labor Force Participation rate still well below the average that is debatable.  See Is the U.S. Really at “Full Employment”? for more information.

Key May Employment and Unemployment Numbers

  • Adjusted U-3 Unemployment-   May 3.8% Down from 3.9% in April and 4.1% October – March.
  • Unadjusted U-3 Unemployment-  May 3.6% down from 3.7% in April and  4.1% in March.
  • Unadjusted U-6 Unemployment-   May 7.3% Down from 7.4% in April and from 8.1% in March and 8.6% in February.
  • Employment 149.309 million up from 148.367 million in April and 147.369 million in March.
  • Gallup has discontinued publishing U-6 & U-3 numbers.

See Current Unemployment Chart for more info.

Employment by Sector

The employment “bubble chart” gives us a good representation of how each sector of the economy is doing (employment wise). As we can see from the chart below only one sector is to the left of the zero line this month indicating that all other sectors gained employees  except Utilities which lost -1,100 employees. The big gainers were Education and Health, Professional and business Services, Construction, Leisure and Manufacturing.

Employment by Sector Bubble Chart The biggest gainer was Education and Health Services (bubble furthest to the right) which added 39,000+ jobs, followed by Retail and Professional Services which each gained roughly 31,000 jobs, Leisure gained 21,000 jobs and manufacturing gained another 18,000 on top of consistently high gains for the last few months. Average weekly earnings for all industries increased to $928.74.

(See the table below the chart for average weekly earnings and other details.)

How to read this chart:

Bubbles location on the chart tell us two things:

  • Change in Employment Levels over the most recent month.
  • Average Weekly earnings.
  • The further to the right the bubble the larger the increase in the number of jobs.
  • The higher up on the chart the larger the average salary.

Bubble Size tells us:

  • Total Employment for the sector.
  • Larger bubbles mean more people are employed in that sector.

Employment and Average Weekly Earnings by Industry for All Employees

May  2018, Seasonally Adjusted

Industry Monthly Increase Average Weekly Earnings Employment Level
Total Private Employment 218,000 $928.74 126,336,000
Mining and Logging 4,000 $1,500.09 733,000
Construction 25,000 $1,174.14 7,210,000
Manufacturing 18,000 $1,097.52 12,673,000
Wholesale trade 4,200 $1,189.81 5,954,800
Retail trade 31,100 $579.70 15,970,300
Transportation and Warehousing 18,700 $940.41 5,309,300
Utilities -1,100 $1,689.89 554,400
Information 6,000 $1,418.40 2,775,000
Financial Activities 8,000 $1,303.88 8,559,000
Professional and Business Services 31,000 $1,164.92 20,891,000
Education and Health Services 39,000 $887.70 23,563,000
Leisure and Hospitality 21,000 $413.95 16,281,000
Other Services 13,000 $772.53 5,862,000

[Read more…] about May Unemployment Lowest Since 2000

Filed Under: BLS Tagged With: Bubble Chart, Employment / Population Ratio, Employment by Sector, Jobs Data, Labor Force Participation Rate, LFPR, May Unemployment, U-6, U6, unemployment

March Employment Tops 147 Million

April 7, 2018 by Tim McMahon

Seasonally Adjusted Unemployment Rate

The U.S. Bureau of Labor Statistics (BLS) released their monthly employment survey results for the month of March on Friday April 6th .

According to the BLS the Seasonally Adjusted U-3 Unemployment Rate is unchanged for the 6th month in a row. So from October through March the Seasonally Adjusted Unemployment rate has been 4.1%. This month the unadjusted U-3 was also 4.1%.

Many Experts consider this to be the new “Full Employment” level i.e. everyone who wants a job has found one however with the Labor Force Participation rate still well below the average that is debatable.  See Is the U.S. Really at “Full Employment”? for more information.

Key March Employment and Unemployment Numbers

  • Adjusted U-3 Unemployment- 4.1% unchanged since October.
  • Unadjusted U-3 Unemployment- 4.1% down from 4.4% February.
  • Unadjusted U-6 Unemployment- 8.1% down from 8.6% in February.
  • Employment 147,332 million up from 146.667 million in February and 145.473 million in January but down from 148.346 million in December and 148.526 million in November.
  • Gallup has discontinued publishing U-6 & U-3 numbers.

See Current Unemployment Chart for more info.

Employment by Sector

The employment “bubble chart” gives us a good representation of how each sector of the economy is doing (employment wise). As we can see from the chart below three sectors are to the left of the zero line this month indicating that all other sectors gained employees in March except Construction which lost -15,000 employees, Retail which lost -4,400 employees, and “Other Services” which lost -1,000 employees on a “Seasonally Adjusted” basis.

Employment by SectorThe biggest gainer was Professional and Business Services (bubble furthest to the right) which added 33,000 jobs, followed by Education and Health Services which gained 25,000 jobs and Manufacturing which gained 22,000 jobs on top of last months 31,000 manufacturing jobs gained. Average weekly earnings for all industries increased from $922.88 to $925.29.

(See the table below the chart for average weekly earnings and other details.)


How to read this chart:

Bubbles location on the chart tell us two things:

  • Change in Employment Levels over the most recent month.
  • Average Weekly earnings.
  • The further to the right the bubble the larger the increase in the number of jobs.
  • The higher up on the chart the larger the average salary.

Bubble Size tells us:

  • Total Employment for the sector.
  • Larger bubbles mean more people are employed in that sector.

Employment and Average Weekly Earnings by Industry for All Employees

March  2018, Seasonally Adjusted

Industry Monthly Increase Average Weekly Earnings Employment Level
Total Private Employment 102,000 $925.29 125,904,000
Mining and Logging 8,000 $1,501.44 722,000
Construction -15,000 $1,153.66 7,150,000
Manufacturing 22,000 $1,098.57 12,632,000
Wholesale trade 11,400 $1,178.97 5,967,300
Retail trade -4,400 $576.58 15,915,900
Transportation and Warehousing 9,800 $942.35 5,279,300
Utilities 4,000 $1,674.74 559,000
Information 2,000 $1,410.43 2,760,000
Financial Activities 2,000 $1,297.20 8,546,000
Professional and Business Services 33,000 $1,162.42 20,803,000
Education and Health Services 25,000 $882.38 23,483,000
Leisure and Hospitality 5,000 $412.64 16,256,000
Other Services -1,000 $770.31 5,830,000

U-6 Unemployment

U3 vs U6 Unemployment
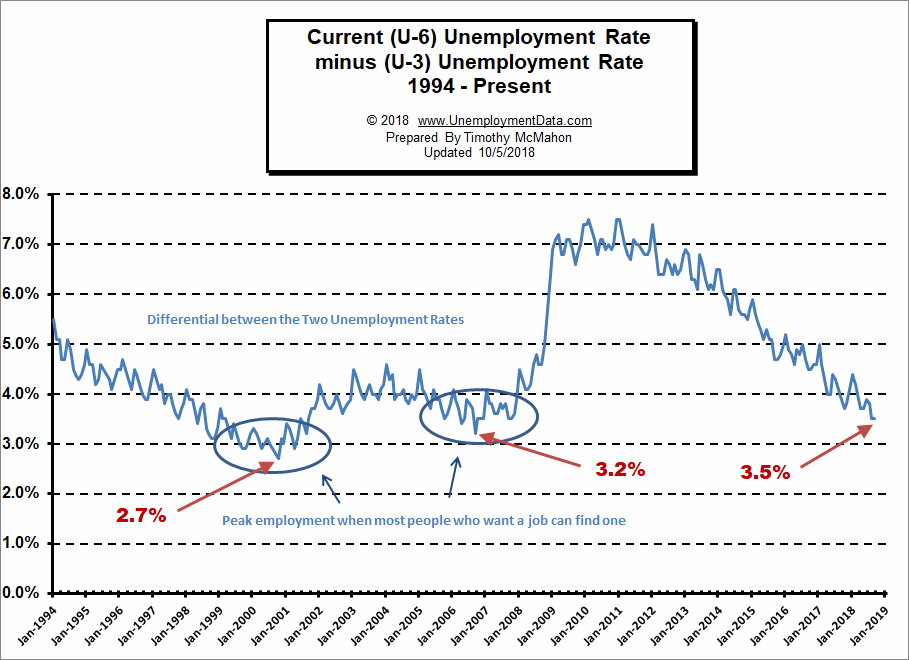
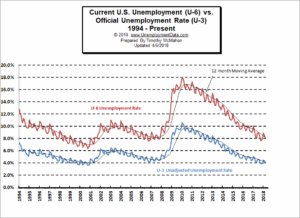
Looking at the broader measure of Unemployment which includes discouraged workers, we see that the U-6 unemployment rate fell from 8.9% in January to 8.6% in February and fell further to 8.1% in March.

See Unadjusted U-6 unemployment for more info.

Employment

Over the last month, the actual number of people working (not seasonally adjusted) has increased by 665,000  jobs in March. The BLS Commissioner said:“ Nonfarm payroll employment edged up by 103,000 in March, following a large gain in February (+326,000)… 

Historical Employment

Over the month, job gains occurred in manufacturing, health care, and mining… Manufacturing employment rose by 22,000… Employment in health care increased by 22,000 in March and has grown by 304,000 over the year…. Mining employment rose by 9,000… Employment in professional and business services continued to trend up in March (+33,000). Over the year, employment in the industry has increased by 502,000, with gains distributed across most of the component industries.” [Read more…] about March Employment Tops 147 Million

Filed Under: Sector Tagged With: employment, Employment / Population Ratio, Employment by Sector, Labor Force Participation Rate, LFPR, March, U6 Unemployment

September Unemployment Rate Down

October 7, 2017 by Tim McMahon

On Friday October 6th the U.S. Bureau of Labor Statistics (BLS) released their monthly employment survey results for the month of September. Every month the BLS conducts two surveys one contacts a sampling of households and the other collects data from businesses. Then they massage some of the numbers to “Seasonally Adjust” them and release them to the media.

According to the BLS, the current “Seasonally Adjusted” Unemployment Rate for September (released October 6th) is 4.2% DOWN from 4.4% in August. The current “Unadjusted” rate is 4.1% down from 4.5% in August.

Seasonal adjustment provides something like a moving average leveling out the bumps due to normal seasonal variations. See: Unadjusted vs. Seasonally Adjusted Unemployment Rate for more information about Seasonal Adjustment.

According to the BLS Commissioner’s report for this month:

“The unemployment rate declined to 4.2 percent in September, and total nonfarm payroll employment changed little (-33,000), the U.S. Bureau of Labor Statistics reported today. A sharp employment decline in food services and drinking places and below-trend growth in some other industries likely reflected the impact of Hurricanes Irma and Harvey. “

Seasonally Adj U-3 Unemployment Rate

See: Current Unemployment Rate Chart for more info.

In the very next paragraph, based on the Household Unemployment Survey, he said, “The unemployment rate decreased by 0.2 percentage point to 4.2 percent in September, and the number of unemployed persons declined by 331,000 to 6.8 million. Both measures were down over the year.”

Declining unemployment means more jobs! So which is it 331,000 more jobs?  -33,000 fewer jobs? Or 340,000 more jobs? [Read more…] about September Unemployment Rate Down

Filed Under: BLS, Employment, Unemployment Tagged With: BLS, Bubble Chart, Bureau of Labor Statistics, employment, Employment Bubbles, Employment by Sector, September 2017, unemployment

Primary Sidebar

Search Site

Sponsored:

URGENT: These Stocks Stand Poised to Benefit from President Trump's Trade Wars!

As the Trump administration moves ahead with aggressive tariff policies on key imports, the mainstream media is scrambling.

This Free Report - which you can download now - reveals the names and ticker symbols of 5 Stock Poised to Benefit Most from President Trump's Tariff Wars.

Click Here to Download Your FREE Stock Report Now.

Recent Posts

  • April 2025 Employment / Unemployment Report
  • Would More Jobs Help Social Security?
  • March 2025- Employment / Unemployment Report
  • February 2025 Jobs Report
  • January 2025 BLS Employment Report

Resources

  • Bureau of Labor Statistics Current Population Survey Monthly survey of households conducted by the Bureau of Census for BLS. It provides data on the labor force, employment, unemployment, etc.
  • Capital Professional Services Providing web design and development and Internet marketing services
  • Elliott Wave University Using the Elliott Wave Principle to improve investment performance
  • Financial Trend Forecaster Featuring Moore Inflation Predictor, NYSE Rate of Change and NASDAQ Rate of change
  • InflationData.com Inflation calculators, databases, etc.
  • Intergalactic Web Designers Web design and development services
  • Your Family Finances

Articles by Category

Articles by Date

Disclaimer

At UnemploymentData.com we are not registered investment advisors and do not provide any individualized advice. Past performance is not necessarily indicative of future performance and future accuracy and profitable results cannot be guaranteed.

Privacy & Terms of Use

Privacy Statement & Terms of Use

Do Not Sell My Information

Copyright © 2025 · News Pro on Capital Professional Services, LLC. All rights reserved · Log in