• About WordPress
    • WordPress.org
    • Documentation
    • Learn WordPress
    • Support
    • Feedback
  • Log In
  • Skip to primary navigation
  • Skip to main content
  • Skip to primary sidebar
  • Home
  • Contact us
  • Related Sites
    • InflationData.com
    • Financial Trend Forecaster
    • Your Family Finances
    • Elliott Wave University
    • Optio Money
  • About
    • Terms of Use
    • Disclaimer & Disclosure
    • Privacy Statement
  • Sitemap
    • 2009-2010 Posts
    • 2011 Posts

UnemploymentData.com

Your Source for Employment and Unemployment Data

Unemployment
  • Charts
    • Current Unemployment Rate Chart
    • Current Employment Rate (Chart and Data)
    • Current Employment vs Unemployment Chart
    • Historical Employment Data
    • Employment Population Ratio
    • Misery Index
  • Unemployment
    • Historical Unemployment Rate Tables
    • What Is U-6 Unemployment?
    • Unadjusted vs. Seasonally Adjusted U-3 Unemployment Rate
    • BLS vs. Gallup Unemployment Numbers
    • Current U-6 Unemployment Rate
    • What is the Labor Force Participation Rate?
    • What is the Real Unemployment Rate?
  • Employment
    • Current Employment Rate (Chart and Data)
    • Historical Employment Data
    • Contacting a Live Person at the State Employment Commission
      • How to Talk to a Live Person at the Virginia Unemployment Commission
      • Florida’s FLUID Unemployment Program
    • Benefits
      • Insurance
      • Retirement
    • Careers
    • Employment Costs
    • Experience
    • Government
    • Job Hunting
      • Interview
      • Resume
  • Find Articles
  • Education
    • Skills
  • General
    • Small Business
      • Outsourcing
    • Success
You are here: Home / Archives for Employment Bubbles

Employment Bubbles

September Employment Up 1.25 Million not 661,000

October 3, 2020 by Tim McMahon

Adj U3 Icon 7-9

Employment Increased by 1.25 Million in September

The U.S. Bureau of Labor Statistics (BLS) released its employment / unemployment report for September on October 2nd.

  • Unadjusted U-3 was Down from 8.5% to 7.7%!
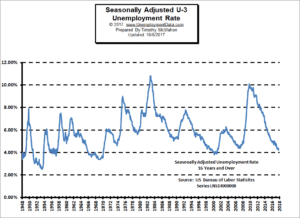
  • Adjusted U-3 was Down from 8.4% to 7.9%!
  • Unadjusted U-6 was Down from 14.3% to 12.4%!
  • Labor Force Participation fell from 61.7% to 61.4%.
  • Unadjusted Employment up from 140.718 million to 141.855 million.

According to the Commissioner of the U.S. Bureau of Labor Statistics:

 “Nonfarm payroll employment increased by 661,000 in September, and the unemployment rate fell to 7.9 percent. These improvements reflect the continued resumption of economic activity that had been curtailed due to the coronavirus (COVID-19) pandemic and efforts to contain it.

In September, employment continued to increase in several industries, with the largest gains in leisure and hospitality, in retail trade, in health care and social assistance, and in professional and business services. By contrast, employment declined in government, mainly in state and local government education.”

Of course, he is talking about “Seasonally Adjusted Jobs” from the “Current Population Survey (CPS)” rather than looking at the results reported by actual companies in their “Current Employment Statistics survey (CES)”

But looking at the CES report we see…
Originally the BLS reported 140.598 million jobs for August, they added 120,000 jobs since that estimate.
So currently they are saying 140.718 million jobs for August and 141.855 million jobs for September which is actually an increase of  1,257,000 jobs based on their original estimates.

[Read more…] about September Employment Up 1.25 Million not 661,000

Filed Under: BLS Tagged With: BLS, education, employment, Employment Bubbles, Layoff Status, LFPR, Net Change, unemployment

September Unemployment Rate Down

October 7, 2017 by Tim McMahon

On Friday October 6th the U.S. Bureau of Labor Statistics (BLS) released their monthly employment survey results for the month of September. Every month the BLS conducts two surveys one contacts a sampling of households and the other collects data from businesses. Then they massage some of the numbers to “Seasonally Adjust” them and release them to the media.

According to the BLS, the current “Seasonally Adjusted” Unemployment Rate for September (released October 6th) is 4.2% DOWN from 4.4% in August. The current “Unadjusted” rate is 4.1% down from 4.5% in August.

Seasonal adjustment provides something like a moving average leveling out the bumps due to normal seasonal variations. See: Unadjusted vs. Seasonally Adjusted Unemployment Rate for more information about Seasonal Adjustment.

According to the BLS Commissioner’s report for this month:

“The unemployment rate declined to 4.2 percent in September, and total nonfarm payroll employment changed little (-33,000), the U.S. Bureau of Labor Statistics reported today. A sharp employment decline in food services and drinking places and below-trend growth in some other industries likely reflected the impact of Hurricanes Irma and Harvey. “

Seasonally Adj U-3 Unemployment Rate

See: Current Unemployment Rate Chart for more info.

In the very next paragraph, based on the Household Unemployment Survey, he said, “The unemployment rate decreased by 0.2 percentage point to 4.2 percent in September, and the number of unemployed persons declined by 331,000 to 6.8 million. Both measures were down over the year.”

Declining unemployment means more jobs! So which is it 331,000 more jobs?  -33,000 fewer jobs? Or 340,000 more jobs? [Read more…] about September Unemployment Rate Down

Filed Under: BLS, Employment, Unemployment Tagged With: BLS, Bubble Chart, Bureau of Labor Statistics, employment, Employment Bubbles, Employment by Sector, September 2017, unemployment

August Unemployment Numbers

September 1, 2017 by Tim McMahon

The U.S.Bureau of Labor Statistics (BLS) released the August unemployment numbers today. The BLS Commissioner says: “Nonfarm payroll employment increased by 156,000 in August, and the unemployment rate was little changed at 4.4 percent. Job gains occurred in manufacturing, construction, professional and technical services, health care, and mining. Employment growth has averaged 176,000 per month thus far this year, about in line with the average monthly gain of 187,000 in 2016.”

Actual employment in July was 146,330,000 and 146,541,000 in August for a net gain of 211,000 even though according to the Commissioner it was 156,000 on a “Seasonally Adjusted” basis.

  • Adjusted U-3 Unemployment was 4.4% up from 4.3% in July.
  • Unadjusted U-3 Unemployment was 4.5% down from 4.6% in July.
  • Employment Increase 156,000 on a “Seasonally Adjusted” or 211,000 non-adjusted.
  • U-6 Unemployment was 8.6% down from 8.9% in July.

August Employment Gain and Loss Bubbles

In the following chart from the BLS we can see [Read more…] about August Unemployment Numbers

Filed Under: Unemployment Tagged With: August 2017, employment, Employment Bubbles, Labor Force Participation Rate

Primary Sidebar

Search Site

Sponsored:

URGENT: These Stocks Stand Poised to Benefit from President Trump's Trade Wars!

As the Trump administration moves ahead with aggressive tariff policies on key imports, the mainstream media is scrambling.

This Free Report - which you can download now - reveals the names and ticker symbols of 5 Stock Poised to Benefit Most from President Trump's Tariff Wars.

Click Here to Download Your FREE Stock Report Now.

Recent Posts

  • April 2025 Employment / Unemployment Report
  • Would More Jobs Help Social Security?
  • March 2025- Employment / Unemployment Report
  • February 2025 Jobs Report
  • January 2025 BLS Employment Report

Resources

  • Bureau of Labor Statistics Current Population Survey Monthly survey of households conducted by the Bureau of Census for BLS. It provides data on the labor force, employment, unemployment, etc.
  • Capital Professional Services Providing web design and development and Internet marketing services
  • Elliott Wave University Using the Elliott Wave Principle to improve investment performance
  • Financial Trend Forecaster Featuring Moore Inflation Predictor, NYSE Rate of Change and NASDAQ Rate of change
  • InflationData.com Inflation calculators, databases, etc.
  • Intergalactic Web Designers Web design and development services
  • Your Family Finances

Articles by Category

Articles by Date

Disclaimer

At UnemploymentData.com we are not registered investment advisors and do not provide any individualized advice. Past performance is not necessarily indicative of future performance and future accuracy and profitable results cannot be guaranteed.

Privacy & Terms of Use

Privacy Statement & Terms of Use

Do Not Sell My Information

Copyright © 2025 · News Pro on Capital Professional Services, LLC. All rights reserved · Log in