The U.S. Bureau of Labor Statistics (BLS) released its employment / unemployment report for February on March 8th, 2024.
Employment / Unemployment
![]()
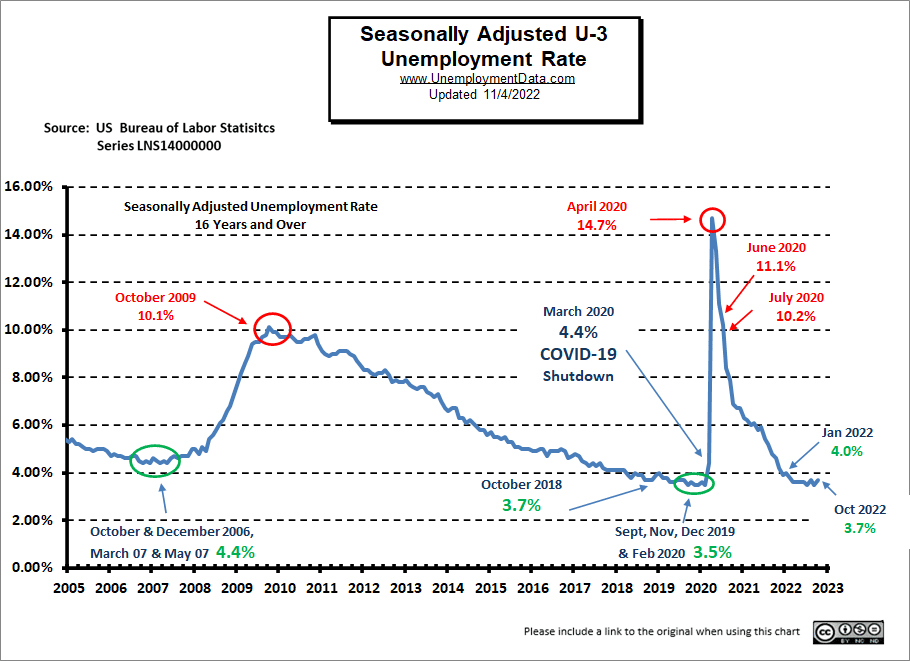
- Seasonally Adjusted U3- 3.9% up from 3.7% in January
- Unadjusted U3- 4.2% up from 4.1% in January
- Unadjusted U6- 7.8% down from 8.0% in January
- Labor Force Participation Rate 62.5% -unchanged
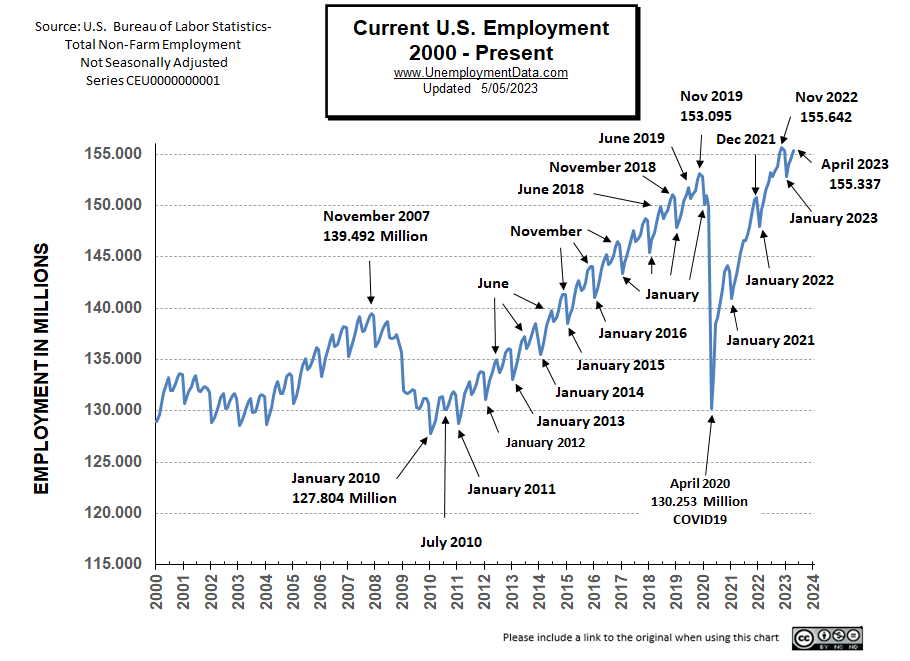
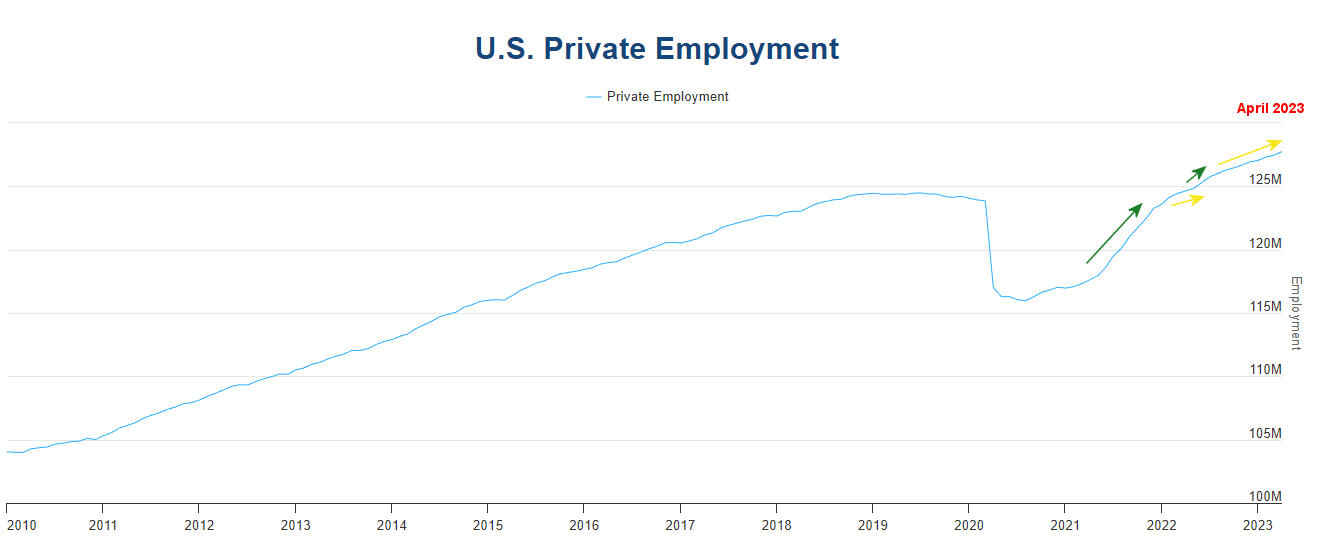
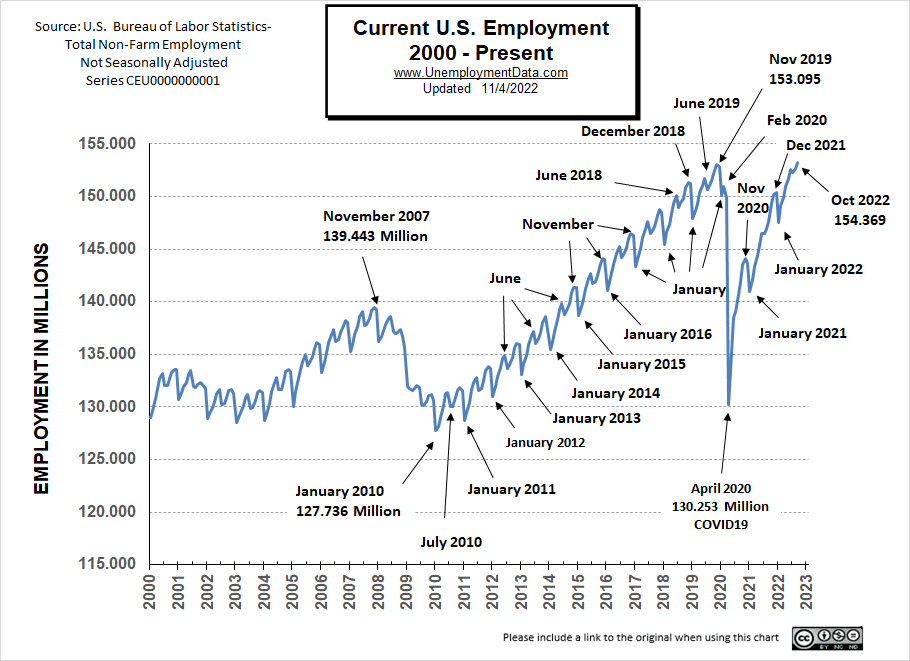
- Employment 156.555 million up from 155.414 million
Summary:
Although employment rose, U3 Unemployment also rose in February in both adjusted and unadjusted rates. Unadjusted U6 fell, but adjusted U6 rose from 7.2% to 7.3%. Labor Force Participation was unchanged.
According to the Commissioner of the U.S. Bureau of Labor Statistics:
“Total nonfarm payroll employment rose by 275,000 in February, and the unemployment rate increased to 3.9 percent, the U.S. Bureau of Labor Statistics reported today. Job gains occurred in health care, in government, in food services and drinking places, in social assistance, and in transportation and warehousing…”
“Among the major worker groups, the unemployment rates for adult women (3.5 percent) and teenagers (12.5 percent) increased over the month…”
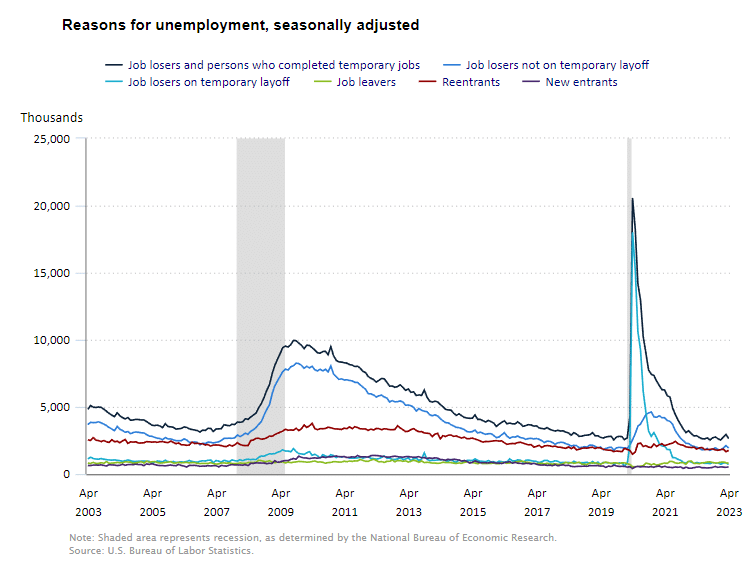
“Among the unemployed, the number of permanent job losers increased by 174,000 to 1.7 million in February.”
You can read the full BLS report here.
As usual, they are talking about “Seasonally Adjusted Jobs”.
Looking at the Unadjusted Establishment Survey report we see…
Originally the BLS reported employment of 155.626 million for January which they adjusted to 155.414 million (for a loss of 212,000 jobs). They are currently reporting 156.555 million jobs for February which is actually a gain of 929,000 jobs compared to their original numbers. But many of these jobs came from government, and social assistance plus food services and drinking places. These are not the type of jobs that build a robust economy. And permanent job losers are increasing.
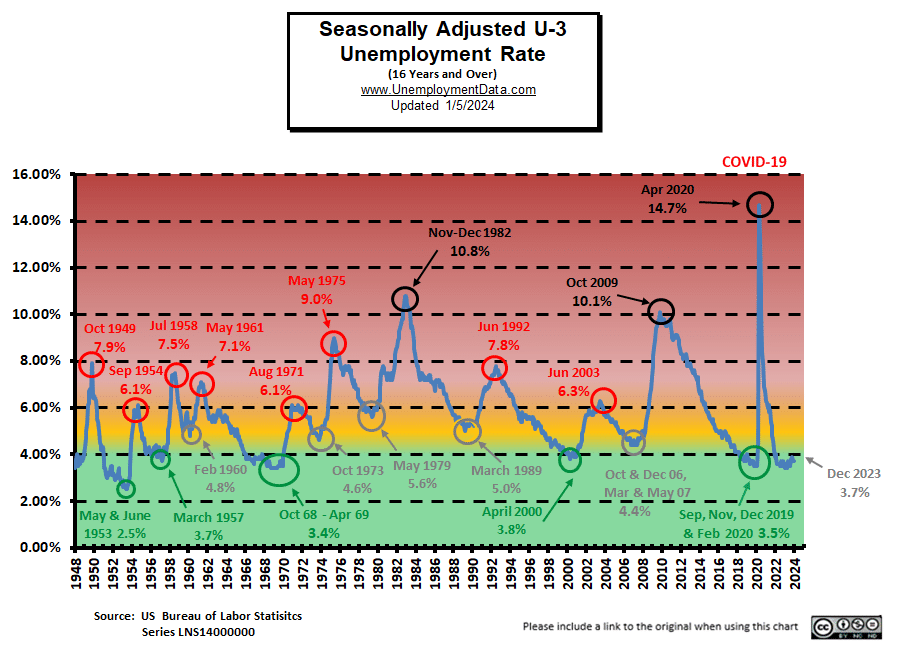
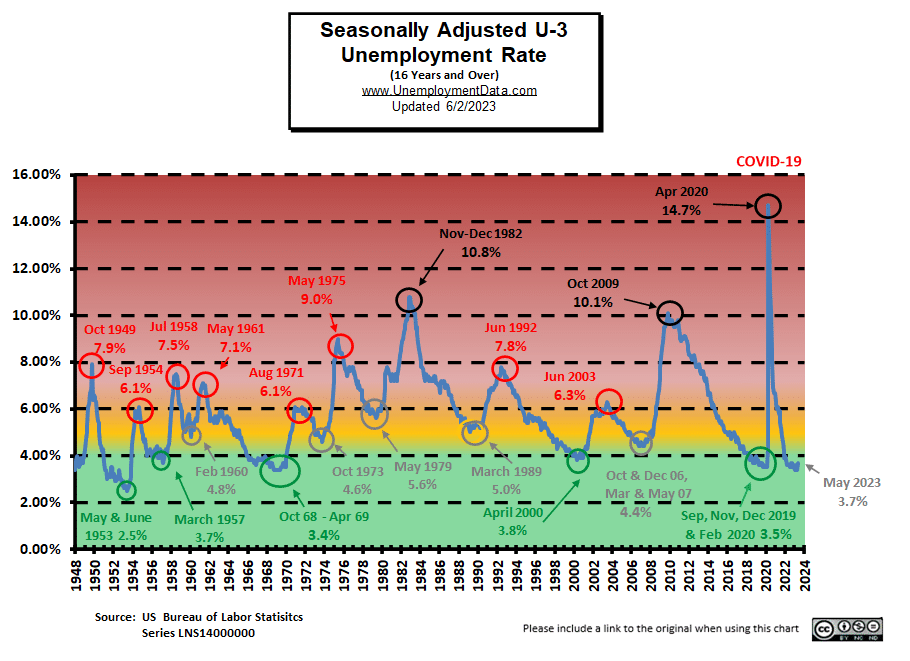
Current Unemployment Rate Chart
Seasonally Adjusted U3 Unemployment is above the pre-COVID 2019 cyclical lows of 3.5% as well as above the lows made early in 2023. Current levels are nearing the beginning of the “Yellow Zone”.