• About WordPress
    • WordPress.org
    • Documentation
    • Learn WordPress
    • Support
    • Feedback
  • Log In
  • Skip to primary navigation
  • Skip to main content
  • Skip to primary sidebar
  • Home
  • Contact us
  • Related Sites
    • InflationData.com
    • Financial Trend Forecaster
    • Your Family Finances
    • Elliott Wave University
    • Optio Money
  • About
    • Terms of Use
    • Disclaimer & Disclosure
    • Privacy Statement
  • Sitemap
    • 2009-2010 Posts
    • 2011 Posts

UnemploymentData.com

Your Source for Employment and Unemployment Data

Unemployment
  • Charts
    • Current Unemployment Rate Chart
    • Current Employment Rate (Chart and Data)
    • Current Employment vs Unemployment Chart
    • Historical Employment Data
    • Employment Population Ratio
    • Misery Index
  • Unemployment
    • Historical Unemployment Rate Tables
    • What Is U-6 Unemployment?
    • Unadjusted vs. Seasonally Adjusted U-3 Unemployment Rate
    • BLS vs. Gallup Unemployment Numbers
    • Current U-6 Unemployment Rate
    • What is the Labor Force Participation Rate?
    • What is the Real Unemployment Rate?
  • Employment
    • Current Employment Rate (Chart and Data)
    • Historical Employment Data
    • Contacting a Live Person at the State Employment Commission
      • How to Talk to a Live Person at the Virginia Unemployment Commission
      • Florida’s FLUID Unemployment Program
    • Benefits
      • Insurance
      • Retirement
    • Careers
    • Employment Costs
    • Experience
    • Government
    • Job Hunting
      • Interview
      • Resume
  • Find Articles
  • Education
    • Skills
  • General
    • Small Business
      • Outsourcing
    • Success
You are here: Home / Archives for December

December

December 2022- Employment and Unemployment by State

January 24, 2023 by Tim McMahon

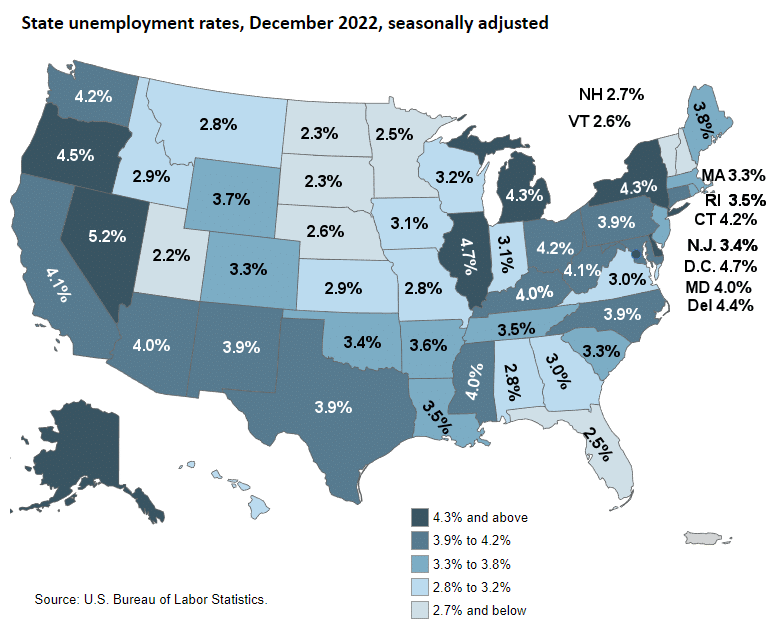
The Bureau of Labor Statistics released its employment report (broken down by state) for the month of December 2022.

The lowest jobless rate was in Utah at 2.2 percent. North and South Dakota had the next lowest rates at 2.3 percent each. Alaska at 4.3%, and Pennsylvania at 3.9% set record lows since the BLS began recording (by state) in 1976. Nevada had the highest unemployment rate, 5.2 percent. 14 states had unemployment rates lower than the U.S. average of 3.5 percent. Washington D.C. and 11 states had rates higher than average, and 25 states had rates that were not appreciably different from that of the nation.

In December, seven states had over-the-month unemployment rate increases, the largest of which was in Nevada (+0.3 percentage point). Five states had over-the-month decreases, the largest of which was in Maryland (-0.3 percentage point). Thirty-eight states and the District of Columbia had jobless rates that were not notably different from those of a month earlier, though some had changes that were at least as large numerically as the significant changes.

unemployment by State Dec 2022
[Read more…] about December 2022- Employment and Unemployment by State
Filed Under: BLS Tagged With: 2023, December, unemployment, Unemployment December 2023

December Job Growth Fails to Meet Expectations… Again

January 8, 2022 by Tim McMahon

December 2021 Unemployment report from the Bureau of Labor Statistics (BLS)

Adj U3 Icon 3-9

  • Unadjusted U-3 was Down from 3.9% to 3.7%
  • Adjusted U-3 was Down from 4.2% to 3.9%
  • Unadjusted U-6 was Down from 7.4% to 7.2%
  • Labor Force Participation Unchanged at 61.9%
  • Unadjusted Employment rose from 150.098 million to 150.170 million

Job growth in December failed to meet expectations for the 2nd month in a row. Economists had predicted more than 400,000 jobs would be added in the month. Instead, according to the BLS, the U.S. economy added less than half that amount.

On a positive note, Seasonally adjusted unemployment fell from 4.2% to 3.9%.

According to the Commissioner of the U.S. Bureau of Labor Statistics:

“Nonfarm payroll employment rose by 199,000 in December, and the unemployment rate declined by 0.3 percentage point to 3.9 percent. Employment continued to trend up in leisure and hospitality, in professional and business services, in manufacturing, in construction, and in transportation and warehousing. In 2021, job growth averaged 537,000 per month. Employment has increased by 18.8 million since April 2020 but is down by 3.6 million, or 2.3 percent, from its level before the onset of the coronavirus (COVID-19) pandemic in February 2020.”

As usual, they are talking about “Seasonally Adjusted Jobs” from the “Current Population Survey (CPS)” rather than looking at the results reported by actual companies in their “Current Employment Statistics survey (CES).”

But looking at the CES report, we see…
Initially, the BLS reported 150.004 million for November, which they adjusted to 150.098 million. For December, they are reporting 150.170 million.
This is an increase of 166,000 jobs based on their original estimates or an increase of 72,000 based on their updated numbers.

Although Employment is 6.568 million Above Year-Ago Levels…

Employment numbers are still about 800,000 short of February 2020 numbers, but the Civilian Population has increased by about 2.6 MILLION people since then.

[Read more…] about December Job Growth Fails to Meet Expectations… Again

Filed Under: Unemployment Tagged With: 2021, BLS, December, employment, job growth, unemployment

December “Monster” Jobs Report (or is it?)

January 5, 2019 by Tim McMahon

The U.S. Bureau of Labor Statistics (BLS) released their monthly unemployment survey results for December on January 4th and some are calling it a “monster” jobs report causing the DOW to gain almost 747 points (3.29%). The reason for this is that the “Seasonally Adjusted” jobs number was up 312,000 while the consensus was expecting an increase of only 176,000.

However all is not roses in employment land. There are a few thorns in the jobs report. Both Adjusted and Unadjusted Unemployment were actually up and Unadjusted Employment was down.

Adjusted U-3 was 3.9% up from 3.7% in November. Unadjusted U-3 was 3.7% up from 3.5% in November. Unadjusted U-6 was also up from 7.2% in November to 7.5% in December. Unadjusted Employment- 151.190 million down from 151.244 million in November. All of this sounds Bad! The major factor that the market has latched onto in this report is the Labor Force Participation Rate which has bounced above 63% for the first time since 2014. See Labor Force Participation below for more.

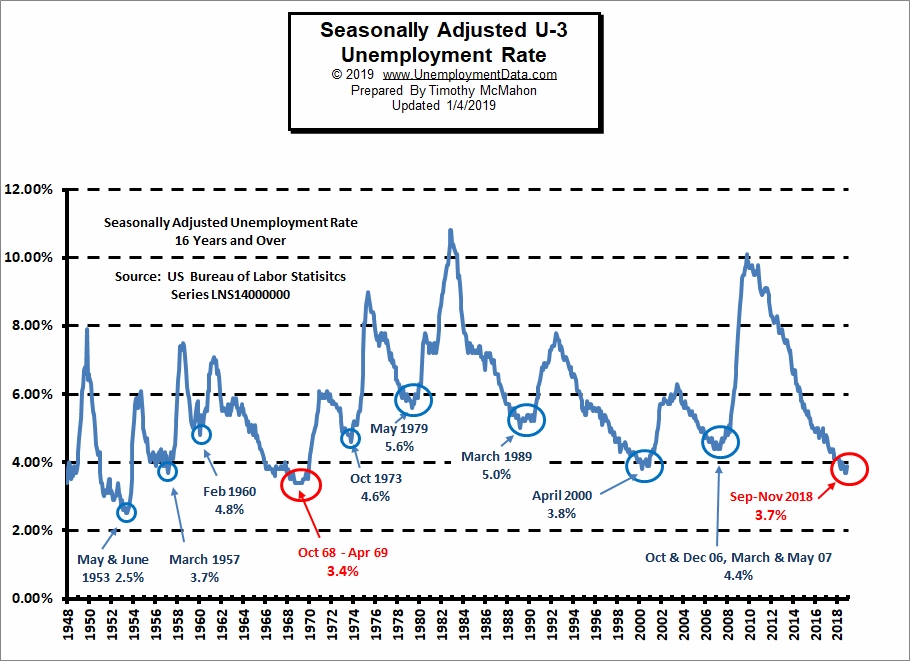
As I have been saying for a while typically unemployment doesn’t stay below 4% for very long. As we can see from the chart below the dip in 2006-7 didn’t even get below 4%. The 2000 dip only spent a couple of months below 4%. The 1960, 1973, ’79 and ’89 dips didn’t get below 4% at all.

Seasonally Adj U-3 Unemployment Rate

The three major exceptions are: [Read more…] about December “Monster” Jobs Report (or is it?)

Filed Under: BLS Tagged With: BLS, December, DOW, employment, Jobs Report, LFPR, Monster, unemployment

December Retail Employment Down

January 6, 2018 by Tim McMahon

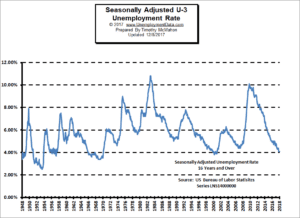
Seasonally Adjusted Unemployment RateOn Friday January 5th the U.S. Bureau of Labor Statistics (BLS) released their monthly employment survey results for the month of December. Many of the numbers remained unchanged from November which was also unchanged from October.

Unemployment

According to the BLS Seasonally Adjusted U-3 was 4.1% since October while Unadjusted U-3 was 3.9% for three months. Unadjusted U-6 unemployment which is a broader measure of Unemployment rose from 7.6% in October to 7.7% in November to 8.0% in December. This is still significantly better than a year ago when in November 2016 Unadjusted U-6  was 9% and December was 9.1%.

Typically January sees an uptick in unemployment as all the seasonal employees get laid-off. So we would expect some sort of uptick next month.

According to the BLS Commissioner’s report for this month:

“Among the major worker groups, the unemployment rate for teenagers declined to 13.6 percent in December, offsetting an increase in November. In December, the unemployment rates for adult men (3.8 percent), adult women (3.7 percent), Whites (3.7 percent), Blacks (6.8 percent), Asians (2.5 percent), and Hispanics (4.9 percent) showed little or no change.”

See: Current Unemployment Rate Chart for more info.

Employment

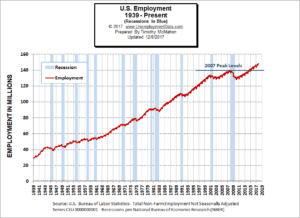
Historical Employment ChartBack in October, employment was 147,952,000 in November it rose to 148,526,000 but then it fell slightly in December to 148,346,000 for a net loss from November to December of 180,000 jobs. The BLS Commissioner’s report however said, “Total nonfarm payroll employment rose by 148,000 in December…”  That is because he is talking about “Seasonally Adjusted” jobs. Meaning that although actual jobs are down, they are down by 148,000 less than average for this time of year.

See Current Employment Commentary and Historical Employment Commentary


Labor Force Participation Rate

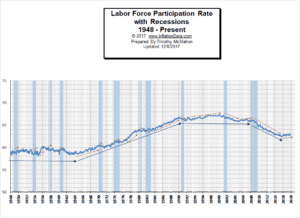
Labor Force Participation Rate w/ RecessionsYou might be wondering if [Read more…] about December Retail Employment Down

Filed Under: BLS Tagged With: BLS, Bureau of Labor Statistics, Data, December, employment, Statistics, unemployment

Primary Sidebar

Search Site

Sponsored:

Here's the Best Day to Buy Nvidia

Did you know Nvidia has an 86% history of soaring, beginning on one particular day every single spring? We call this the "Green Day phenomenon." It works on 5,000 stocks. For example, Tesla has a 100% history of soaring beginning on one particular day every single year.

Click here to see the green days for 5 major stocks today.

Recent Posts

  • Blue-Collar Wages Surge in 2025
  • Does Raising The Minimum Wage Make A Substantial Difference?
  • May Employment Nothing Burger
  • April 2025 Employment / Unemployment Report
  • Would More Jobs Help Social Security?

Resources

  • Bureau of Labor Statistics Current Population Survey Monthly survey of households conducted by the Bureau of Census for BLS. It provides data on the labor force, employment, unemployment, etc.
  • Capital Professional Services Providing web design and development and Internet marketing services
  • Elliott Wave University Using the Elliott Wave Principle to improve investment performance
  • Financial Trend Forecaster Featuring Moore Inflation Predictor, NYSE Rate of Change and NASDAQ Rate of change
  • InflationData.com Inflation calculators, databases, etc.
  • Intergalactic Web Designers Web design and development services
  • Your Family Finances

Articles by Category

Articles by Date

Disclaimer

At UnemploymentData.com we are not registered investment advisors and do not provide any individualized advice. Past performance is not necessarily indicative of future performance and future accuracy and profitable results cannot be guaranteed.

Privacy & Terms of Use

Privacy Statement & Terms of Use

Do Not Sell My Information

Copyright © 2025 · News Pro on Capital Professional Services, LLC. All rights reserved · Log in