• About WordPress
    • WordPress.org
    • Documentation
    • Learn WordPress
    • Support
    • Feedback
  • Log In
  • Skip to primary navigation
  • Skip to main content
  • Skip to primary sidebar
  • Home
  • Contact us
  • Related Sites
    • InflationData.com
    • Financial Trend Forecaster
    • Your Family Finances
    • Elliott Wave University
    • Optio Money
  • About
    • Terms of Use
    • Disclaimer & Disclosure
    • Privacy Statement
  • Sitemap
    • 2009-2010 Posts
    • 2011 Posts

UnemploymentData.com

Your Source for Employment and Unemployment Data

Unemployment
  • Charts
    • Current Unemployment Rate Chart
    • Current Employment Rate (Chart and Data)
    • Current Employment vs Unemployment Chart
    • Historical Employment Data
    • Employment Population Ratio
    • Misery Index
  • Unemployment
    • Historical Unemployment Rate Tables
    • What Is U-6 Unemployment?
    • Unadjusted vs. Seasonally Adjusted U-3 Unemployment Rate
    • BLS vs. Gallup Unemployment Numbers
    • Current U-6 Unemployment Rate
    • What is the Labor Force Participation Rate?
    • What is the Real Unemployment Rate?
  • Employment
    • Current Employment Rate (Chart and Data)
    • Historical Employment Data
    • Contacting a Live Person at the State Employment Commission
      • How to Talk to a Live Person at the Virginia Unemployment Commission
      • Florida’s FLUID Unemployment Program
    • Benefits
      • Insurance
      • Retirement
    • Careers
    • Employment Costs
    • Experience
    • Government
    • Job Hunting
      • Interview
      • Resume
  • Find Articles
  • Education
    • Skills
  • General
    • Small Business
      • Outsourcing
    • Success
You are here: Home / Archives for COVID

COVID

Unemployment Goes From Extraordinarily Bad to “Only” Normally Bad

February 6, 2021 by Tim McMahon

Highlights from the Bureau of Labor Statistics (BLS) employment / unemployment report for January released on February 5th.

  • Unadjusted U-3 was Up from 6.5% to 6.8%
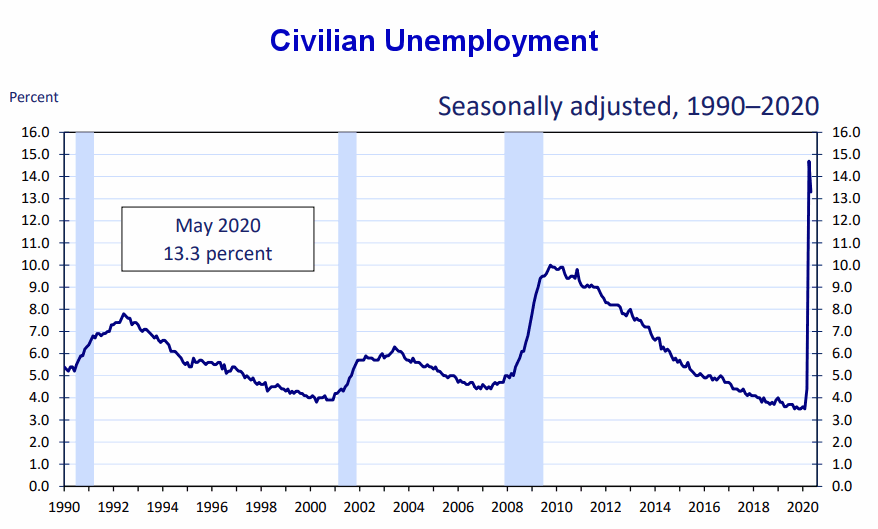
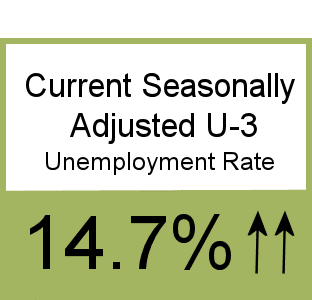
  • Adjusted U-3 was Down from 6.7% to 6.3%
  • Unadjusted U-6 was Up from 11.6% to 12.0%
  • Labor Force Participation was Down from 61.5% to 61.4%
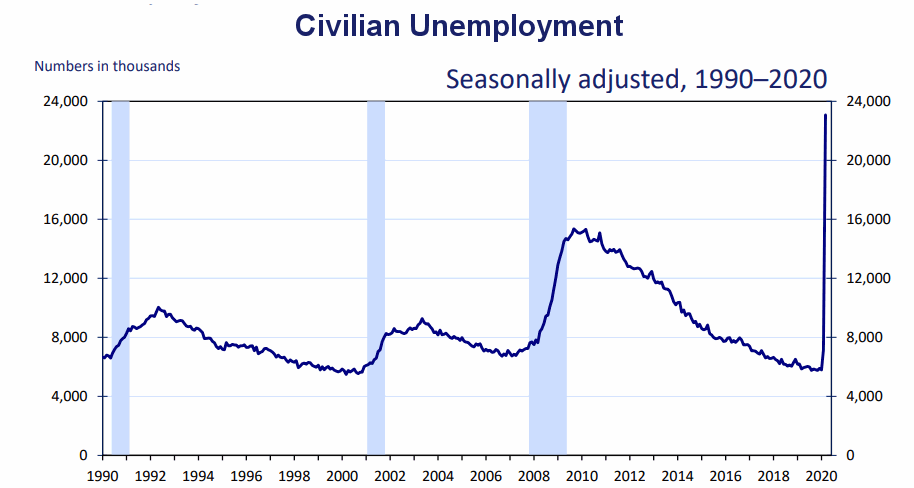
  • Unadjusted Employment Down from 143.700 million to 140.927 million

According to the Commissioner of the U.S. Bureau of Labor Statistics:

“The unemployment rate fell by 0.4 percentage point to 6.3 percent in January, and nonfarm payroll employment changed little (+49,000). The labor market continued to be impacted by the coronavirus (COVID-19) pandemic and efforts to contain it. Notable job gains in professional and business services and in both public and private education were offset by losses in leisure and hospitality, in retail trade, in health care, and in transportation and warehousing.”

Of course, they are talking about “Seasonally Adjusted Jobs” from the “Current Population Survey (CPS)” rather than looking at the results reported by actual companies in their “Current Employment Statistics survey (CES)”

But looking at the CES report we see…
Originally the BLS reported 143.777 million jobs for December, this month they adjusted that slightly.
So currently they are saying 143.700 million jobs for December and 140.927 million for January.
which is actually a decrease of  2,850,000 jobs based on their original estimates.


[Read more…] about Unemployment Goes From Extraordinarily Bad to “Only” Normally Bad

Filed Under: BLS Tagged With: BLS, COVID, Duration of Unemployment, Layoff Status, LFPR, Reasons for Unemployment, unemployment

Unemployment Rate Falls Contrary to Economist’s Projections

June 6, 2020 by Tim McMahon

13.3% Unemployment

The U.S. Bureau of Labor Statistics (BLS) released its employment / unemployment report for May on June 5th.

COVID-19 Unemployment Decreases as People Return to Work

  • Unadjusted U-3 was Down from 14.4% to 13.0%.
  • Adjusted U-3 was Down from 14.7% to 13.3%.
  • Unadjusted U-6 was Down from 22.4% to 20.7%.
  • Labor Force Participation rose from 60.2% to 60.8%.
  • Unadjusted Employment rose by approx. 2.9 million jobs.

Civilian Unemployment

Economists were predicting another stairstep increase in unemployment in May. According to a CNBC article “Economists surveyed by Dow Jones had been expecting payrolls to drop by 8.33 million and the unemployment rate to rise to 19.5% from April’s 14.7%.”

Instead, Unemployment fell to 13.3% and payrolls rose by 2.9 million making the “experts” wrong by roughly 11 million.

Civilian Unemployment

According to the Commissioner of the U.S. Bureau of Labor Statistics:

“Nonfarm payroll employment increased by 2.5 million in May, and the unemployment rate declined by 1.4 percentage points to 13.3 percent. These improvements in the labor market reflected a limited resumption of economic activity that had been curtailed in March and April due to the coronavirus (COVID-19) pandemic and efforts to contain it.
      
In May, employment rose in several major industry sectors, with the largest gains in leisure and hospitality, construction, education and health services, and retail trade. By contrast, employment in government continued to decline sharply.”

Of course, he is talking about “Seasonally Adjusted Jobs” from the “Current Population Survey (CPS)”
rather than looking at the results reported by actual companies in their “Current Employment Statistics survey (CES)”

But looking at the CES report we see…
Originally the BLS reported 131.071 million jobs for April and then they subtracted 660,000 jobs from that estimate.
So currently they are saying 130.411 million jobs for April and 133.342 million jobs for May which is actually an increase of  2.271 million jobs compared to what they originally reported last month. Or 2.931 million jobs based on their current estimates of April’s employment.

[Read more…] about Unemployment Rate Falls Contrary to Economist’s Projections

Filed Under: BLS Tagged With: Age Group, Audiologist Degree, BLS, Bubble Chart, Coronavirus, COVID, COVID-19, employment, May 2020, Rebound, unemployment

Coronavirus Shutdown Causes 20 Million Job Losses

May 9, 2020 by Tim McMahon

Unemployment 14.7%

The U.S. Bureau of Labor Statistics (BLS) released its employment / unemployment report for April on May 8th.

COVID-19 Shutdowns Send Unemployment Rate Soaring

  • Unadjusted U-3 was Up from 4.5% to 14.4%!
  • Adjusted U-3 was Up from 4.4% to 14.7%!
  • Unadjusted U-6 was Up from 8.9% to 22.4%!
  • Labor Force Participation fell from 62.7% to 60.2%.
  • Unadjusted Employment down by approx. -19.5 MILLION jobs.

Civilian Unemployment

In April, the ranks of the unemployed swelled by almost 20 million bringing it up to approximately 23 million in total. Rather than looking at percentages, the following chart looks at the actual number of unemployed individuals. The current number of unemployed is considerably higher than at the peak of the 2008-2010 “great recession”.

Civilian Unemployment Chart

According to the Commissioner of the U.S. Bureau of Labor Statistics:

Nonfarm payroll employment declined by 20.5 million in April, and the unemployment rate increased to 14.7 percent, reflecting the widespread impact on the job market of the coronavirus (COVID-19) pandemic and efforts to contain it. Employment fell sharply in all major industry sectors, with a
particularly large decline in the leisure and hospitality sector.

The response rate for the household survey continued to be adversely affected by pandemic-related issues, while that for the establishment survey returned to a normal range in April. In addition, there were changes to the estimation methods for the establishment survey to better account for the historic number of temporary or permanent business closures in April. The impacts of the pandemic on the household and payroll surveys are detailed in the April Employment Situation news release and accompanying materials (available on the BLS website)). For both surveys, we were able to obtain estimates that met BLS standards for accuracy and reliability.

The substantial job declines related to the coronavirus pandemic started in March, as payroll employment declined by 870,000, as revised. Job losses accelerated in April, as an additional 20.5 million jobs were lost. These April losses were pervasive across all industry sectors, and brought nonfarm employment to its lowest level since February 2011.

Of course, he is talking about “Seasonally Adjusted Jobs” from the “Current Population Survey (CPS)”
rather than looking at the results reported by actual companies in their “Current Employment Statistics survey (CES)”

Looking at the CES report we see…
Originally the BLS reported 150.804 million jobs for March and then they subtracted 221,000 jobs from that estimate.
So currently they are saying 150.583 million jobs for March and 131.071 million jobs for April which is actually a decrease of  -19.733 million jobs compared to what they originally reported last month. Or -19.512 million jobs based on their current estimates of March’s employment.

[Read more…] about Coronavirus Shutdown Causes 20 Million Job Losses

Filed Under: General Tagged With: 20 Million, 2020, April, BLS, Commissioner, Coronavirus, COVID, COVID-19, employment, Hispanic, Peak, unemployment

Primary Sidebar

Search Site

Sponsored:

URGENT: These Stocks Stand Poised to Benefit from President Trump's Trade Wars!

As the Trump administration moves ahead with aggressive tariff policies on key imports, the mainstream media is scrambling.

This Free Report - which you can download now - reveals the names and ticker symbols of 5 Stock Poised to Benefit Most from President Trump's Tariff Wars.

Click Here to Download Your FREE Stock Report Now.

Recent Posts

  • April 2025 Employment / Unemployment Report
  • Would More Jobs Help Social Security?
  • March 2025- Employment / Unemployment Report
  • February 2025 Jobs Report
  • January 2025 BLS Employment Report

Resources

  • Bureau of Labor Statistics Current Population Survey Monthly survey of households conducted by the Bureau of Census for BLS. It provides data on the labor force, employment, unemployment, etc.
  • Capital Professional Services Providing web design and development and Internet marketing services
  • Elliott Wave University Using the Elliott Wave Principle to improve investment performance
  • Financial Trend Forecaster Featuring Moore Inflation Predictor, NYSE Rate of Change and NASDAQ Rate of change
  • InflationData.com Inflation calculators, databases, etc.
  • Intergalactic Web Designers Web design and development services
  • Your Family Finances

Articles by Category

Articles by Date

Disclaimer

At UnemploymentData.com we are not registered investment advisors and do not provide any individualized advice. Past performance is not necessarily indicative of future performance and future accuracy and profitable results cannot be guaranteed.

Privacy & Terms of Use

Privacy Statement & Terms of Use

Do Not Sell My Information

Copyright © 2025 · News Pro on Capital Professional Services, LLC. All rights reserved · Log in