• About WordPress
    • WordPress.org
    • Documentation
    • Learn WordPress
    • Support
    • Feedback
  • Log In
  • Skip to primary navigation
  • Skip to main content
  • Skip to primary sidebar
  • Home
  • Contact us
  • Related Sites
    • InflationData.com
    • Financial Trend Forecaster
    • Your Family Finances
    • Elliott Wave University
    • Optio Money
  • About
    • Terms of Use
    • Disclaimer & Disclosure
    • Privacy Statement
  • Sitemap
    • 2009-2010 Posts
    • 2011 Posts

UnemploymentData.com

Your Source for Employment and Unemployment Data

Unemployment
  • Charts
    • Current Unemployment Rate Chart
    • Current Employment Rate (Chart and Data)
    • Current Employment vs Unemployment Chart
    • Historical Employment Data
    • Employment Population Ratio
    • Misery Index
  • Unemployment
    • Historical Unemployment Rate Tables
    • What Is U-6 Unemployment?
    • Unadjusted vs. Seasonally Adjusted U-3 Unemployment Rate
    • BLS vs. Gallup Unemployment Numbers
    • Current U-6 Unemployment Rate
    • What is the Labor Force Participation Rate?
    • What is the Real Unemployment Rate?
  • Employment
    • Current Employment Rate (Chart and Data)
    • Historical Employment Data
    • Contacting a Live Person at the State Employment Commission
      • How to Talk to a Live Person at the Virginia Unemployment Commission
      • Florida’s FLUID Unemployment Program
    • Benefits
      • Insurance
      • Retirement
    • Careers
    • Employment Costs
    • Experience
    • Government
    • Job Hunting
      • Interview
      • Resume
  • Find Articles
  • Education
    • Skills
  • General
    • Small Business
      • Outsourcing
    • Success
You are here: Home / Archives for Bureau of Labor Statistics

Bureau of Labor Statistics

April Employment Nears All-Time Highs

May 6, 2023 by Tim McMahon

The U.S. Bureau of Labor Statistics (BLS) released its employment / unemployment report for April on May 5th 2023.

Employment Near All-Time High 

Seasonally Adjusted U3 down to 3.4%

  • Adjusted U-3 was 3.4% down from 3.5%
  • Unadjusted U-3 was 3.1% down from 3.6%
  • Unadjusted U-6 was 6.1% Down from 6.8%
  • Labor Force Participation unchanged at 62.6%
  • Unadjusted Employment rose from 154.445 million to 155.337 million


According to the Commissioner of the U.S. Bureau of Labor Statistics:

“Total nonfarm payroll employment rose by 253,000 in April, and the unemployment rate changed little at 3.4 percent, the U.S. Bureau of Labor Statistics reported today. Employment continued to trend up in professional and business services, health care, leisure and hospitality, and social assistance.”

You can read the full BLS report here.

As usual, they are talking about “Seasonally Adjusted Jobs”.

Looking at the Establishment Survey report, we see…
Originally the BLS reported employment of 154.517 million for March which they adjusted to 154.445 million. So they subtracted 72,000 jobs for March. They are now reporting 155.337 million jobs for April, which is an increase of 820,000 based on their original estimates or an increase of 892,000 based on their updated numbers. 

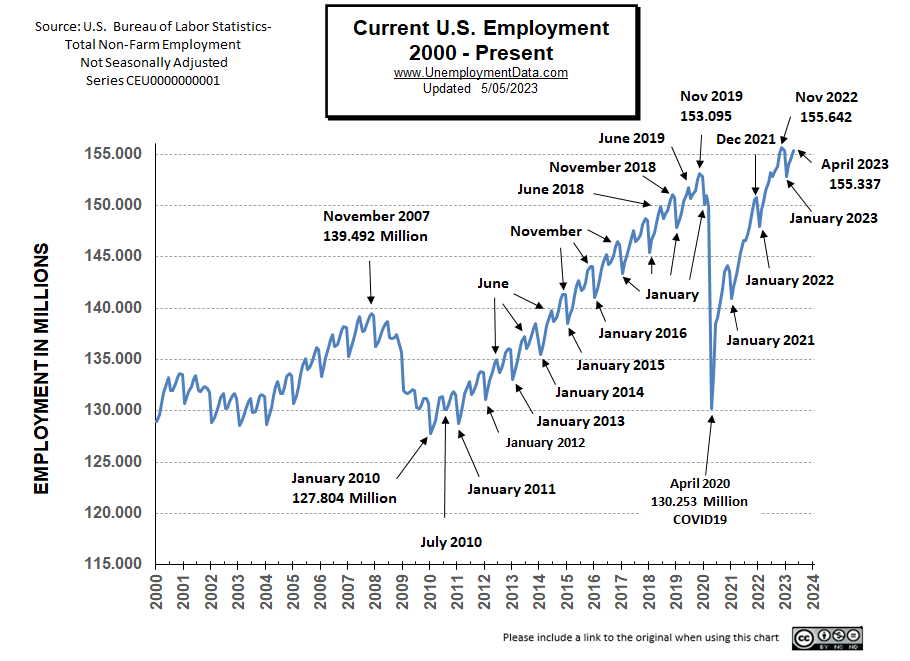
Current Employment Rate Chart

November 2022 had the highest number of people employed in the history of the United States at 155,642,000. Then the typical January slump hit, taking employment down by roughly 3 million. But now employment is once again nearing that high. And if history is any indicator, we can expect employment to peak in June above November’s level before taking another breather. So far, as of April, employment is just a little over 300,000 shy of the all-time high. One way we can tell if the economy is beginning to falter is if the June high doesn’t exceed the previous November, or if November 2023 employment doesn’t exceed June 2023.

Current Employment ChartSee Current Employment for more info.

Full Employment?

Last month we said, “Full Employment is when everyone who wants a job has one. It is generally considered to be slightly above 3%. Although, other factors, such as unemployment benefits, can shift the level higher or lower. So, if unemployment benefits are extended from 6 months to 1 year, people will tend to stay unemployed longer, thus raising the unemployment rate.”

The following chart shows four examples of employment continuing to rise, but unemployment flattens out at just over 3%. Currently, the unadjusted unemployment rate is at 3.1%, as close to the theoretical full employment as you can get. Over the next few months, we will see how well reality relates to theory and if unemployment can actually get below 3%.

Note: The Unemployment rate is inverted to track the employment rate, neither is Seasonally Adjusted.

Employment vs Unemployment Chart

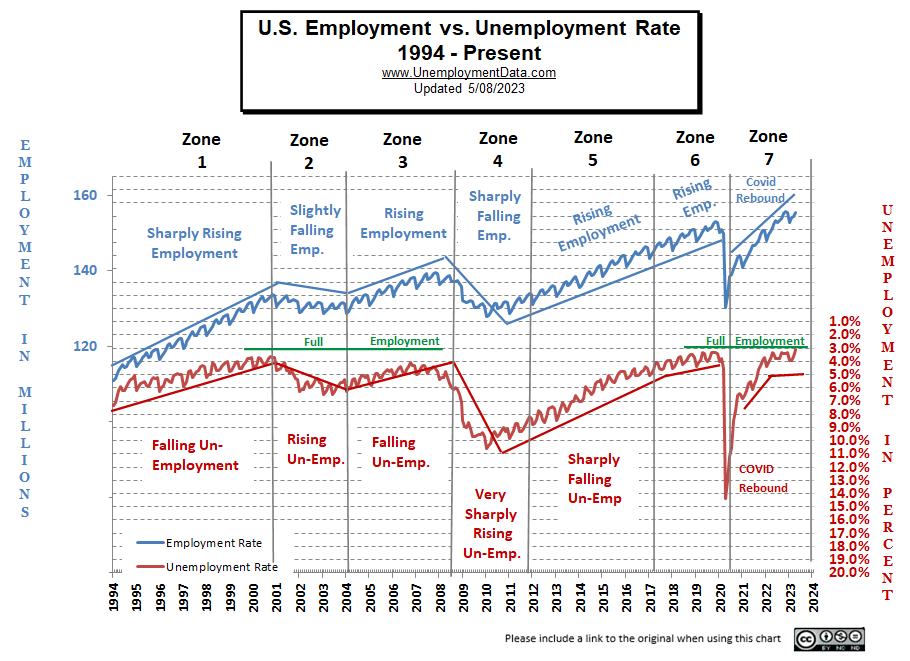
Full employment is not considered to be at zero percent because even when employers are having difficulty finding employees, some people are still unemployed due to either structural unemployment (mismatch between worker skills and job requirements, i.e., not enough training) or simply because they quit their job knowing it would be easy to find another (hopefully better) job. Often referred to as frictional unemployment (there will always be people who have quit or have lost a seasonal job and are in the process of getting a new job). See: Highly Skilled Worker Shortage in a Recession?

If the unemployment rate stays constant, but more people are working, where are these extra workers coming from?

Somehow the workforce has to be growing to accommodate these newly created jobs. They could be long-term unemployed (no longer counted in the workforce) returning to the workforce, they could be immigrants entering the workforce, or possibly retired people coming out of retirement because of an offer too good to turn down. This is generally facilitated by rising wages, but this month’s ADP report indicates that wage growth has slowed, possibly indicating that we are nearing the end of this boom.

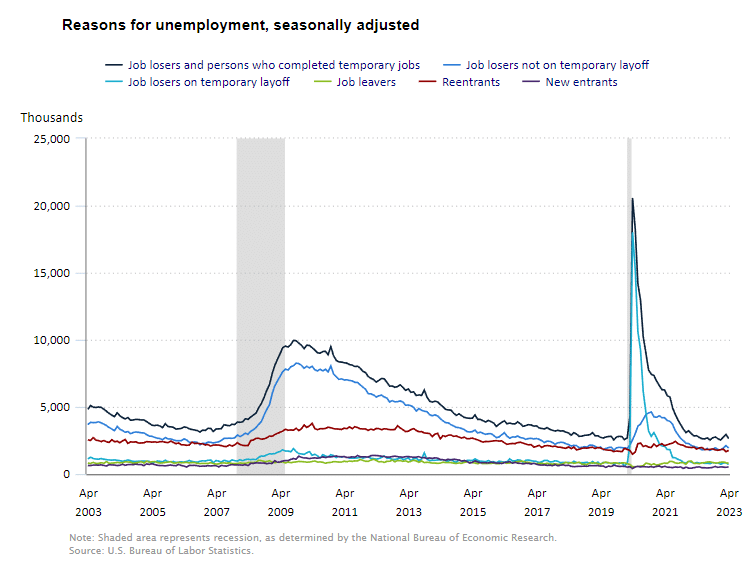
Reasons for Unemployment

As we can see from the following chart, Job losers and persons who completed temporary jobs (black line) always creates some job turnover (i.e. temporary unemployment), although this month the level of turnover decreased somewhat. There is also a steady stream of reentrants, new entrants, and those on temporary layoff.

Reasons for unemployment

Duration of Unemployment

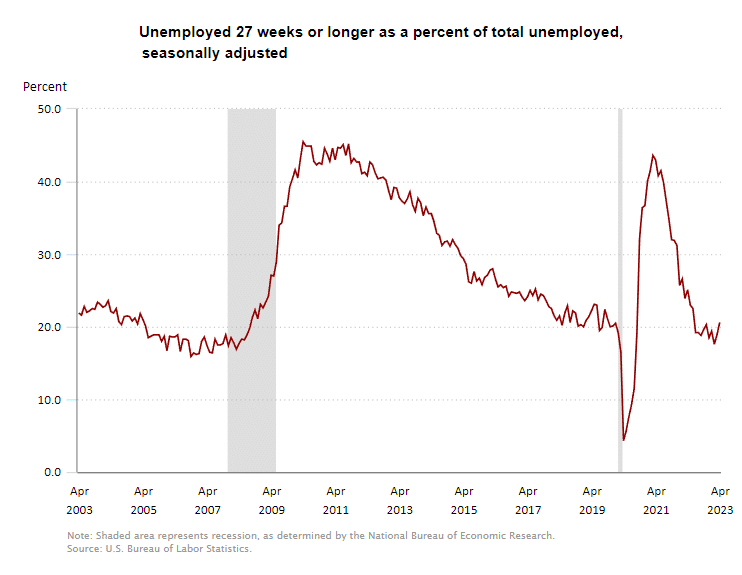
If the duration of unemployment begins climbing, it generally indicates a worsening economic climate. The following chart shows a falling less than 5 weeks of unemployment (which could indicate people are starting to be unemployed for longer times or simply that it is easy to find a new job). 5-14 week unemployment rose slightly, 15-26 week unemployment fell, and 27 weeks and over was relatively unchanged. The trouble starts when 15-26 week unemployment begins rising, followed by longer-term unemployment.

Duration of Unemployment 
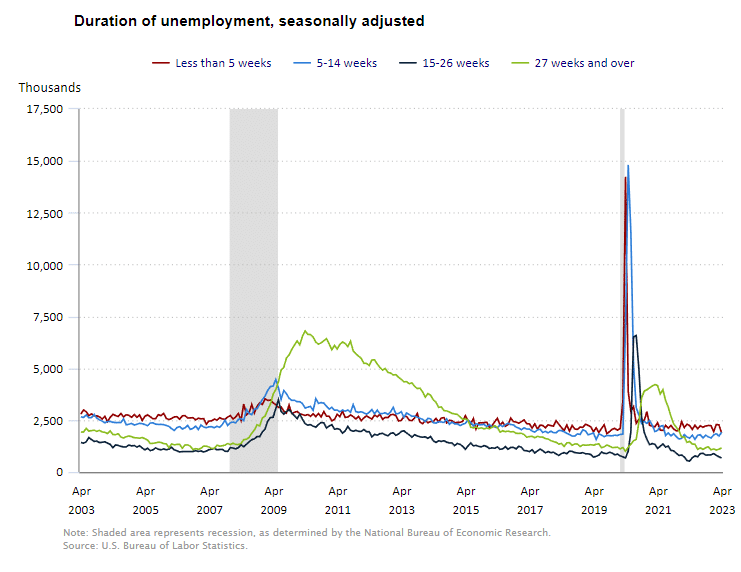
The following chart shows an uptick in the percentage of people unemployed 27 weeks or longer, which could be an early warning indicator.

Unemployed 27+ weeks

ADP® National Employment Report

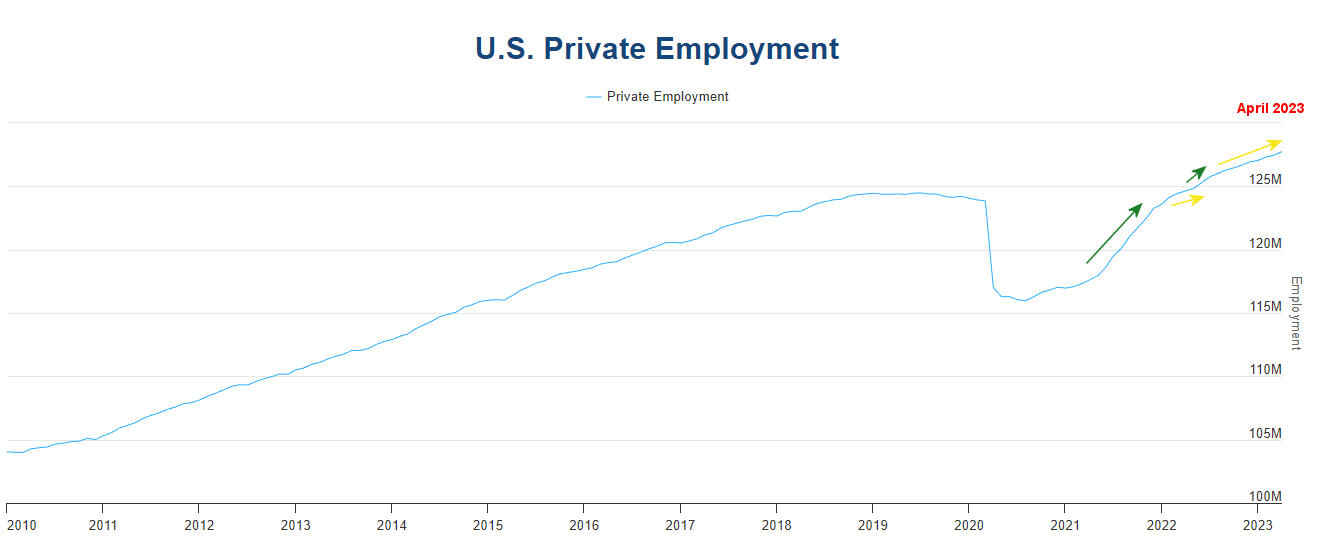
ADP provides an independent (non-government) estimate of private-sector employment and pay, based on data derived from ADP client payrolls. According to ADP®, In collaboration with Stanford Digital Economy Lab, private employment was up in April.

ADP: Private employers added 296,000 jobs in April compared to 145,000 jobs in March.

ADP Employment Comments


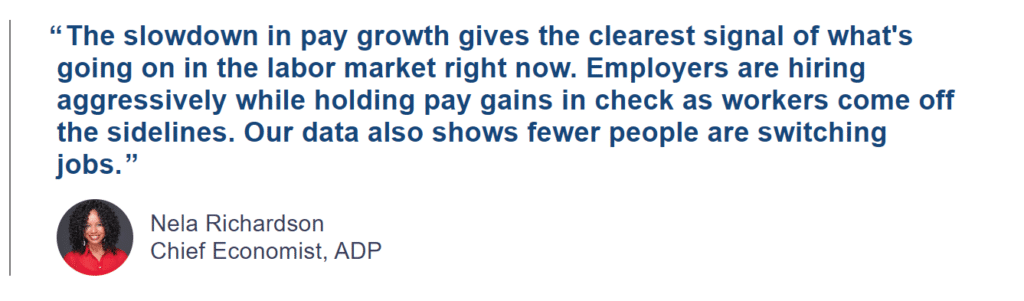
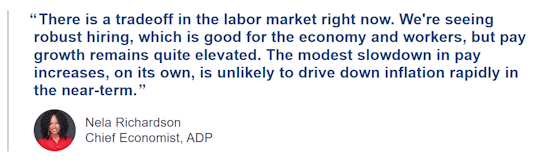
Ms. Richardson is saying that although employers are still hiring, upward pressure on salaries has eased somewhat.

I’ve added some arrows to the ADP private employment chart, to indicate the slope of the line. The long green arrow shows the rapid post-COVID rebound in employment. Then in early 2022, the rate of increase slowed (small yellow arrow). Then around March 2022, the rate of increase picked up again (small green arrow). More recently, the rate of growth has moderated, possibly due to nearing full employment. As long as the slope is upward, the economy is still growing, despite the difficulty in finding qualified employees.


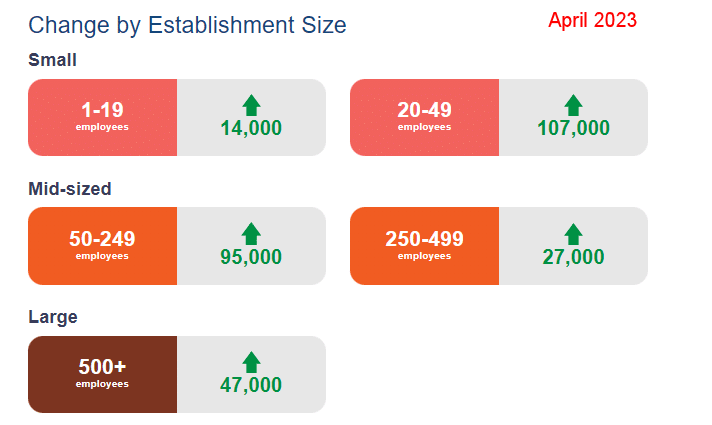
ADP Private Employment by Firm Size

ADP also lists increases by “firm size”.
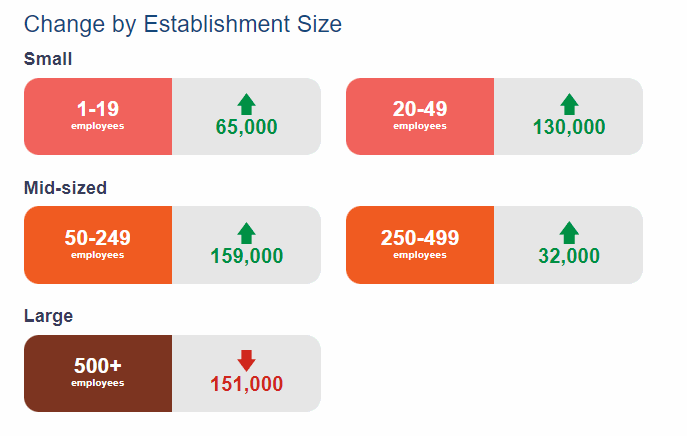
This month, all-size companies added employees. Last month the only one that decreased was companies with 250-499 employees.

April ADP Changes:

Change by Est Size for Apr 2023


ADP Also Tracks Salary Changes:

[Read more…] about April Employment Nears All-Time Highs

Filed Under: Employment Tagged With: ADP, April, BLS, Bureau of Labor Statistics, employment, Jobs Report, unemployment

February 2023 Unemployment Report

March 11, 2023 by Tim McMahon

The U.S. Bureau of Labor Statistics (BLS) released its employment / unemployment report for February on March 10th 2023.

Employment Up and Unemployment Up? 

Adj U3 Icon 3-6 up


  • Unadjusted Employment rose from 152.836 million to 153.955 million
  • Labor Force Participation rose from 62.4% to 62.5%
  • Adjusted U-3 rose from 3.4% to 3.6%
  • Unadjusted U-3 unchanged at 3.9%
  • Unadjusted U-6 fell from 7.4% to 7.3%


According to the Commissioner of the U.S. Bureau of Labor Statistics:

“Total nonfarm payroll employment rose by 311,000 in February, and the unemployment rate edged up to 3.6 percent, the U.S. Bureau of Labor Statistics reported today. Notable job gains occurred in leisure and hospitality, retail trade, government, and health care. Employment declined in information and in transportation and warehousing.”

You can read the full BLS report here.

As usual, they are talking about “Seasonally Adjusted Jobs”.

Looking at the Unadjusted Establishment Survey report, we see…

Originally the BLS reported employment of 152.844 million for January, which they adjusted down slightly to 152.836 million.

The current estimate for February is 153.955 million which is up 1.11 million from the original number and up 1.12 million from the revised numbers. According to the BLS, this increase didn’t change the unadjusted U-3 number and actually resulted in an increase in unemployment on a seasonally adjusted basis.

ADP® National Employment Report

According to ADP In collaboration with Stanford Digital Economy Lab, private employment was up from January to February by 242,000.

ADP: Private employers added 242,000 jobs in February

Nela Richardson Feb 2023


ADP also lists increases by “firm size” and they posted this comment:

  • Job gains are solid and wage growth remains elevated. A particular area of weakness is with small establishments, which shed jobs every month since August 2022.

But their December report showed small businesses gaining.

December Changes:

ADP Change by Establishment Size

February Changes:


Change by Est Size for Feb 2023

ADP Also Tracks Salary Changes:

[Read more…] about February 2023 Unemployment Report

Filed Under: BLS Tagged With: BLS, Bureau of Labor Statistics, employment, February 2023, Salary, unemployment

January 2022 Unemployment Up not DOWN as Reported

February 5, 2022 by Tim McMahon

January 2022 Unemployment report from the Bureau of Labor Statistics (BLS)

January 2022 Unemployment report

  • Adjusted U-3 was UP from 3.9% to 4.0%
  • Unadjusted U-3 was Up from 3.7% to 4.4%
  • Unadjusted U-6 was Up from 7.2% to 7.9%
  • Labor Force Participation Up from 61.9% 62.2%
  • Unadjusted Employment fell from 150.349 million to 147. 525 million

January 2022 Unemployment report: Establishment news media chose to put a positive spin on this month’s Jobs report focusing on the Bureau of Labor Statistics 467,000 jobs number. U.S. News says, US Economy Defies Omicron and Adds 467,000 Jobs in January. Long-time readers of this site will remember that this is a Seasonally Adjusted number based on the “Current Population Survey (CPS)” rather than looking at the results reported by actual companies in their “Current Employment Statistics survey (CES)”. As we explain below, more people were NOT employed in January than in December all that the adjusted number indicates is that fewer people lost their jobs in January than in a typical January.  In actuality, there were 2.6 million fewer employed in January 2022 than in December 2021 and even the Seasonally Adjusted Unemployment rate INCREASED from 3.9% to 4.0% while UNADJUSTED unemployment increased even more.

According to the Commissioner of the U.S. Bureau of Labor Statistics:

“Nonfarm payroll employment increased by 467,000 in January, and the unemployment rate was little changed at 4.0 percent. Employment growth continued in leisure and hospitality, in professional and business services, in retail trade, and in transportation and warehousing. Employment has increased by 19.1 million since April 2020 but is down by 2.9 million, or 1.9 percent, from its level before the onset of the coronavirus (COVID-19) pandemic in February 2020. Monthly job growth averaged 555,000 in 2021.”

As usual, they are talking about “Seasonally Adjusted Jobs” from the “Current Population Survey (CPS)” rather than looking at the results reported by actual companies in their “Current Employment Statistics survey (CES)”

But looking at the CES report we see…
Originally the BLS reported 150.170 million for December which they adjusted to 150.349 million. For January they are reporting 147.525 million.
which is actually a decrease of 2,645,000 jobs based on their original estimates or a decrease of 2,824,000 based on their updated numbers. Typically January loses a significant number of jobs due to post-holiday layoffs so January employment decreases are not that unusual. But if we look at the adjusted numbers we see that even the seasonally adjusted unemployment was up suggesting that the layoff was a bit worse than usual.

[Read more…] about January 2022 Unemployment Up not DOWN as Reported

Filed Under: BLS Tagged With: BLS, Bureau of Labor Statistics, employment, January 2022, unemployment, US News

November Jobs Up But…

December 4, 2021 by Tim McMahon

November 2021 Unemployment report from the Bureau of Labor Statistics (BLS)

  • Unadjusted U-3 was Down from 4.3% to 3.9%
  • Adjusted U-3 was Down from 4.6% to 4.2%
  • Unadjusted U-6 was Down from 7.7% to 7.4%
  • Labor Force Participation Up 61.6% to 61.8%
  • Unadjusted employment rose from 149.226 million to 150.004 million

Although November’s job numbers are generally an improvement over October, Bloomberg called them”weird” and “the smallest jobs gain this year”.  This jobs report is so weird because retail employment is DOWN by -20,400 in a month, known for increased retail employment. Market commentators are also blaming the Jobs report for Friday’s market drop.

According to the Commissioner of the U.S. Bureau of Labor Statistics:

“Nonfarm payroll employment rose by 210,000 in November, and the unemployment rate fell by 0.4 percentage point to 4.2 percent. Notable job gains occurred in professional and business services, transportation and warehousing, construction, and manufacturing. Employment in retail trade declined over the month.”

As usual, they are talking about “Seasonally Adjusted Jobs” from the “Current Population Survey (CPS)” rather than looking at the results reported by actual companies in their “Current Employment Statistics survey (CES).”

But looking at the CES report, we see…
Initially, the BLS reported 149.217 million for October, which they adjusted to 149.226 million. For November, they are reporting 150.004 million,
which is an increase of 787,000 jobs based on their original estimates or an increase of 778,000 based on their updated numbers.

[Read more…] about November Jobs Up But…

Filed Under: BLS Tagged With: 2021, BLS, Bureau of Labor Statistics, employment, jobs, Labor Force Participation Rate, LFPR, November, unemployment

April Unemployment Report “Disappointing”

May 10, 2021 by Tim McMahon

Highlights from the Bureau of Labor Statistics (BLS) employment / unemployment report for April released on May 7th.

Adj U3 Icon 6-1

  • Unadjusted U-3 was Down from 6.2% to 5.7%
  • Adjusted U-3 was Up from 6.0% to 6.1%
  • Unadjusted U-6 was Down from 10.9% to 9.9%
  • Labor Force Participation rose from 61.5% to 61.7%
  • Unadjusted Employment rose from 143.309 million to 144.398


MSN classified this unemployment report as “disappointing” and the “greatest test yet of President Biden’s strategy to revive the pandemic economic recovery“.
There has been speculation that expanded unemployment benefits are making people reluctant to renter the labor market since generous unemployment benefits are more than they earn at minimum wage jobs.  To counteract this, states like Montana are canceling Federal COVID unemployment benefits in an effort to encourage people to go back to work.

According to CNBC: “Montana opts to end $300 unemployment boost. Other states may, too.”

CNBC KEY POINTS:
  • Montana Gov. Greg Gianforte, a Republican, is ending participation in federal programs that expanded and raised unemployment benefits on June 27.
  • The American Rescue Plan, a $1.9 trillion Covid relief bill President Joe Biden signed in March, offered them through Labor Day.
  • Gianforte is instead offering a $1,200 return-to-work bonus to address a labor shortage. Some experts question the move.

Buried in the middle of the article is this quote:

“Montana is turning down expanded federal benefits to address a “severe workforce shortage,” Gianforte said. The state’s labor force is 10,000 workers smaller than before the pandemic and its 3.8% unemployment rate is near pre-Covid lows.

So despite the fact that “Some ‘experts’ question the move” unemployment levels are not “disappointing” in Montana at least, in fact, quite the opposite… they are having trouble finding workers.

[Read more…] about April Unemployment Report “Disappointing”

Filed Under: BLS Tagged With: BLS, Bureau of Labor Statistics, CNBC, employment, Montana, MSN, unemployment

October Unemployment- Jobs Much Better Than Expected

November 2, 2019 by Tim McMahon

Adj U3 Icon 3-6 upThe U.S. Bureau of Labor Statistics (BLS) released its employment / unemployment report for October on November 1st.

Unemployment is still near record lows. Although the “Seasonally Adjusted” Unemployment Rate for October ticked up from 3.5% in September to 3.6%. However, the unadjusted U-3 Unemployment rate was unchanged at 3.3%. This Jobs report was unexpectedly good despite counting 30,000 “unemployed” strikers at auto manufacturers.

According to the Commissioner of the U.S. Bureau of Labor Statistics:

“Nonfarm payroll employment increased by 128,000 in October, and the unemployment rate was little changed at 3.6 percent. Notable employment gains occurred in food services and drinking places, social assistance, and financial activities. Within manufacturing, employment declined in motor vehicles and parts due to strike activity. Federal government employment was down, reflecting a drop in the number of temporary jobs for the 2020 Census.”

Experts had been predicting that the economy would add no more than 75,000 jobs. In fact, MarketWatch on Thursday told readers that
the report would be “a big dud” due to the impact of the General Motors strike on the overall numbers.
If it hadn’t been for the strike the October numbers would have been even better.

Of course, the Commissioner is talking about “Seasonally Adjusted Jobs” from the “Current Population Survey (CPS)”
rather than looking at the results reported by actual companies in the BLS’ “Current Employment Statistics survey (CES)”
in reality, the BLS has done a lot of “Adjusting” over the last few months.
The original CES numbers the BLS reported for August was 151.517 million people employed in August
then later they adjusted it up to 151.607 million. And for September they originally reported there were 151.949 million employed
and currently they are reporting 152.962 million employed so that is an actual increase of 1.013 million NOT and adjusted increase of 128,000!
But in addition to “Seasonal Adjustment”, they adjusted September’s number up to 152.015 million
so the difference between September and October appears to be less than it actually was.

For more info see our Current Unemployment Chart and Current U.S. Employment Chart commentary:

October Jobs Report Smashes Expectations

  • Unadjusted U-3 was Unchanged at 3.3%!
  • Adjusted U-3 was up slightly from 3.5% to 3.6%!
  • Unadjusted U-6 was Unchanged at 6.5%!
  • Labor Force Participation hits levels not seen since 2013 at recent peak levels of 63.3%.
  • Unadjusted Employment Up
  • The unemployment rate for black Americans nudged lower to 5.4 percent, setting a new record,

Key factors in the BLS report were:
Employment in food services and drinking places rose by 48,000 over the month.
Financial activities employment rose by 15,000, with nearly half of the gain occurring in insurance carriers and related activities (+7,000).

Social assistance added 20,000 jobs in October, with most of the gain occurring in individual and family services.

Financial activities added 16,000 jobs.
Professional and business services added 22,000 jobs.

Health care added 15,000 jobs.

Manufacturing employment declined by 36,000 in October.
Employment in motor vehicles and parts manufacturing decreased
by 42,000, reflecting strike activity.

[Read more…] about October Unemployment- Jobs Much Better Than Expected

Filed Under: BLS Tagged With: BLS, Bureau of Labor Statistics, employment, jobs, Labor, Labor Force, Labor Force Participation Rate, Participation Rate, productivity, Sector, unemployment

September Unemployment Rate Hits 50-Year Low

October 5, 2019 by Tim McMahon

The U.S. Bureau of Labor Statistics (BLS) released its employment / unemployment report for September released on October 4th. Unemployment is at record lows. According to the BLS, the “Seasonally Adjusted” Unemployment Rate for September fell to 3.5% after spending 3 months at 3.7%. The last time unemployment was this low was in December 1969 almost exactly 50 years ago.

According to the Commissioner of the U.S. Bureau of Labor Statistics:

“The unemployment rate declined by 0.2 percentage point to 3.5 percent in September, and nonfarm payroll employment increased by 136,000. Employment continued to trend up in health
care and in professional and business services… Health care employment rose by +39,000 in September… employment continued to trend up in professional and business services +34,000… Employment in transportation and warehousing edged up by +16,000… Government employment also continued to trend up in September +22,000…”

Of course, he is talking about “Seasonally Adjusted Jobs” in reality last month the BLS reported there were 151.517 million people employed in August and this month they are reporting there are 151.949 million employed in September, so that is an increase of 432,000 jobs.

For more info see our Current Unemployment Chart and Current U.S. Employment Chart commentary:

Key September Employment and Unemployment Numbers

This month’s Unemployment report was full of positive news.

  • Adjusted U-3 Unemployment-    3.5% down from 3.7% June through August.
  • Unadjusted U-3 Unemployment-  3.3% down from 3.8% in August and 4.0% in July, it was 4.4% in January.
  • Unadjusted U-6 Unemployment-  6.5% down a whopping -0.8% from 7.3% in August.
  • Unadjusted Employment (Establishment Survey)- 151.949 up from the 151.517 million the BLS reported in August.
  • Labor Force Participation Rate- 63.2% unchanged from August but up from 63.0% in July, and 62.9% June.

Key factors in the BLS report were:

Health care employment increased by 39,000

Professional and business services increased by 34,000

Transportation and warehousing increased by 16,000

Government employment increased by 22,000 approximately 1,000 of those were related to the upcoming census.

Hispanic and African American unemployment are both at the lowest levels on record.


[Read more…] about September Unemployment Rate Hits 50-Year Low

Filed Under: General Tagged With: BLS, Bureau of Labor Statistics, education, employment, Labor, productivity, unemployment

August Unemployment Report

September 7, 2019 by Tim McMahon

Adjusted U3 3.7%The U.S. Bureau of Labor Statistics (BLS) released its employment / unemployment report for August on September 6th. Unemployment is still near record lows. According to the BLS, the “Seasonally Adjusted” Unemployment Rate for August is unchanged at 3.7% for the 3rd month in a row. But up from 3.6% in May and down from 3.8% in February and March.

According to the Commissioner of the U.S. Bureau of Labor Statistics:

“Total nonfarm payroll employment rose by 130,000 in August, and the unemployment rate was unchanged at 3.7 percent, the U.S. Bureau of Labor Statistics reported today. Employment in federal government rose, largely reflecting the hiring of temporary workers for the 2020 Census. Notable job gains also occurred in health care and financial activities, while mining lost jobs.”

Of course, he is talking about “Seasonally Adjusted Jobs” in reality there were 151.517 million people employed in August up from 151.169 million employed in July. Although the BLS originally reported 151.183 jobs for July.

For more info see our Current Unemployment Chart and Current U.S. Employment Chart commentary:

Key August Employment and Unemployment Numbers

This month’s Unemployment report was full of positive news.

  • Seasonally adjusted Unemployment remained at historically low levels. 
  • Unadjusted U-3 was Down.
  • Unadjusted U-6 remains good.
  • Labor Force Participation Up Again
  • Unadjusted Employment Up

Key factors in the BLS report were:

Health care employment increased by 24,000 and 392,000 over the past 12 months.

Financial activities employment rose by 15,000, with nearly half of the gain occurring in insurance carriers and related activities (+7,000). Financial activities has added 111,000 jobs over the year.

Not sure if this is good or bad but…

“Social assistance employment continued on an upward trend in August (+13,000). Within the industry, individual and family services added 17,000 jobs. Social assistance has added 100,000 jobs in the last 6 months.”

[Read more…] about August Unemployment Report

Filed Under: BLS Tagged With: August Unemployment, Bureau of Labor Statistics, employment

June Unemployment Higher

July 6, 2019 by Tim McMahon

Adjusted U3 3.7%The U.S. Bureau of Labor Statistics (BLS) released their monthly unemployment survey results for June on July 5th. Unemployment is still near record lows but it has ticked up a bit.

According to the Commissioner of the U.S. Bureau of Labor Statistics:

” Nonfarm payroll employment increased by 224,000 in June, and the unemployment rate was little changed at 3.7 percent.
Over the month, notable job gains occurred in professional and business services, in health care, and in transportation and warehousing.”

Of course the Commissioner is talking about “Seasonally Adjusted Jobs” in reality there were 152.307 million people employed in June up from 151.600 million employed in May so the actual increase was 707,000 new jobs in June. There were only 148.295 million employed in January so there are  over 4 million more people employed in June than in January!

Key factors in the report were:

Employment in Professional and Business Services increased by 51,000…
Health care employment increased by 35,000 in June…
Employment in transportation and warehousing increased by 24,000
Construction employment rose by 21,000…

For more info see our Current Unemployment Chart and Current U.S. Employment Chart commentary:

Key June Employment and Unemployment Numbers

  • Adjusted U-3 Unemployment-   3.7% Up from 3.6% in May 
  • Unadjusted U-3 Unemployment-  3.8% Up from 3.4% in May but still below 4.1% in February, and 4.4% in January.
  • Unadjusted U-6 Unemployment-  7.5% Up from 6.7% in May. It was 7.5% in March, 7.7% in February and 8.8% in January.
  • Unadjusted Employment (Establishment Survey)- 152.307 million up from 151.600 Million in May and  148.295 million in January.
  • Labor Force Participation Rate- 62.9% up from 62.8% in April and May down from 63.0% in March and from the peak of 63.2% in February.

Current Seasonally Adjusted U-3 levels are still below the 3.8% lows of 2000. Prior to that we have to go all the way back to 1969 to see better unemployment levels than we have currently. If we break below 3.4% we have to go all the way back to 1953 to find lower levels and remember that was during the boom that followed WWII with a massive loss of the workforce due to the war so we probably won’t see levels that low again.

[Read more…] about June Unemployment Higher

Filed Under: BLS Tagged With: BLS, Bureau of Labor Statistics, employment, Employment / Population Ratio, Employment by Sector, June 2019, Labor Force Participation Rate, LFPR, unemployment

March Unemployment Numbers Celebrated

April 6, 2019 by Tim McMahon

Adjusted U3 UnemploymentThe U.S. Bureau of Labor Statistics (BLS) released their monthly unemployment survey results for March on April 5th and it has the market pundits celebrating. Last month they worried over the mere 20,000 jobs created after projections were for 175,000 jobs.

This month once again the projections were for 175,000 new jobs but the BLS says there were 195,000 new jobs so the market is happy.

As we said in the Current Unemployment Chart commentary:

According to the BLS Commissioner’s report for this month:
“Total nonfarm payroll employment increased by 196,000 in March, and the unemployment rate was unchanged at 3.8 percent, the U.S. Bureau of Labor Statistics reported today. Notable job gains occurred in health care and in professional and technical services… The employment-population ratio was 60.6 percent in March and has been either 60.6 percent or 60.7 percent since October 2018… Health care added 49,000 jobs in March and 398,000 over the past 12 months… Employment in professional and technical services grew by 34,000 in March and 311,000 over the past 12 months. “

Key factors in the report were the unemployment rate for Women dropped to another mega low of 3.3% from 3.6% last month.
Black unemployment was 6.7% and Hispanic Unemployment was 4.7%.

Last month the media was unpleasantly surprised by the Jobs report being lower than the consensus and this month they were pleasantly surprised by the higher than expected jobs. “Economists surveyed by The Wall Street Journal expected that the jobs report would show solid growth by 175,000 jobs”  but instead the report showed 196,000 “Seasonally Adjusted” jobs created, “making March the 102nd straight month of job growth”. In unadjusted terms February had 149.867 million jobs while March had 149.133 million jobs for an actual increase of 724,000 jobs.

Key March Employment and Unemployment Numbers

  • Adjusted U-3 Unemployment-   3.8% unchanged from February but down from 4.0% in January, and 3.9% in December.
  • Unadjusted U-3 Unemployment-  3.9% down from 4.1% in February, and 4.4% in January, but above the 3.7% in December.
  • Unadjusted U-6 Unemployment-  7.5% down from 7.7% in February and 8.8% in January, 7.5% in December.
  • Unadjusted Employment (Establishment Survey)- 149.867 up from 149.143 in February and 148.295 million in January.
  • February Labor Force Participation Rate- 63.0% down from the peak of 63.2% in February, and 63.1% in December.

Current Seasonally Adjusted U-3 levels are still hovering around the lows of 2000. Prior to that we have to go all the way back to 1969 to see better unemployment levels than we have currently. Current levels are rising a bit from a cyclical low not seen since 1969. Also noteworthy is that levels do not stay this low for very long. The longest low like this was the seven month period from October 1968 through April 1969. Prior to 1969 was a one month low of 3.7% in 1957. On the plus side, [Read more…] about March Unemployment Numbers Celebrated

Filed Under: BLS Tagged With: BLS, Bubble Chart, Bureau of Labor Statistics, employment, Employment by Sector, Labor Force, Labor Force Participation, Labor Force Participation Rate, Seasonally Adjusted, U-6, unemployment

  • Page 1
  • Page 2
  • Go to Next Page »

Primary Sidebar

Search Site

Sponsored:

URGENT: These Stocks Stand Poised to Benefit from President Trump's Trade Wars!

As the Trump administration moves ahead with aggressive tariff policies on key imports, the mainstream media is scrambling.

This Free Report - which you can download now - reveals the names and ticker symbols of 5 Stock Poised to Benefit Most from President Trump's Tariff Wars.

Click Here to Download Your FREE Stock Report Now.

Recent Posts

  • April 2025 Employment / Unemployment Report
  • Would More Jobs Help Social Security?
  • March 2025- Employment / Unemployment Report
  • February 2025 Jobs Report
  • January 2025 BLS Employment Report

Resources

  • Bureau of Labor Statistics Current Population Survey Monthly survey of households conducted by the Bureau of Census for BLS. It provides data on the labor force, employment, unemployment, etc.
  • Capital Professional Services Providing web design and development and Internet marketing services
  • Elliott Wave University Using the Elliott Wave Principle to improve investment performance
  • Financial Trend Forecaster Featuring Moore Inflation Predictor, NYSE Rate of Change and NASDAQ Rate of change
  • InflationData.com Inflation calculators, databases, etc.
  • Intergalactic Web Designers Web design and development services
  • Your Family Finances

Articles by Category

Articles by Date

Disclaimer

At UnemploymentData.com we are not registered investment advisors and do not provide any individualized advice. Past performance is not necessarily indicative of future performance and future accuracy and profitable results cannot be guaranteed.

Privacy & Terms of Use

Privacy Statement & Terms of Use

Do Not Sell My Information

Copyright © 2025 · News Pro on Capital Professional Services, LLC. All rights reserved · Log in