![]() The U.S. Bureau of Labor Statistics (BLS) released its employment / unemployment report for December on January 10th.
The U.S. Bureau of Labor Statistics (BLS) released its employment / unemployment report for December on January 10th.
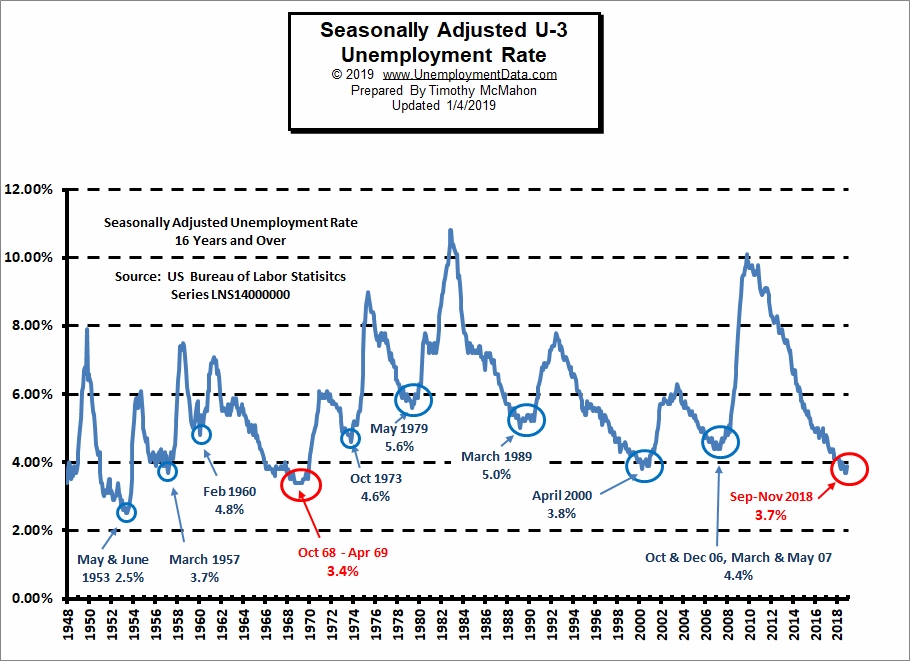
CNBC was quick to label it “disappointing” but at 1/10th of a percent off a 50 year low how disappointing can it really be? The unadjusted numbers were up slightly but that isn’t unusual for December and they weren’t even up by as much as they were last year. In December 2018 the unadjusted U-6 went from 7.2% to 7.5% (i.e. 0.3%). This year it went from 6.5% to 6.7% (up 0.2%). Last year the unadjusted U-3 went from 3.5% to 3.7% (up 0.2%) this year it went from 3.3% to 3.4% (up 0.1%). Last year the adjusted U-3 went from 3.7% to 3.9%. This year it went from… wait for it… 3.5% to 3.5%… what? Yes, it was unchanged. On a seasonally adjusted basis, unemployment is exactly the same as last month (i.e. one of the best months in recorded history). What about Labor Force Participation? Unchanged at 63.2%… slightly off recent highs of 63.3% which it reached in October. The only “fly in the ointment” was actual unadjusted employment which was down slightly while adjusted Employment was still up by 145,000.
December Jobs Report
- Adjusted U-3 was Unchanged at 3.5%!
- Unadjusted U-3 was up slightly from 3.3% to 3.4%!
- Unadjusted U-6 was Up from 6.5% to 6.7%
- Labor Force Participation was unchanged at 63.2%.
- Unadjusted Employment down slightly while adjusted Employment was up by 145,000.
According to the Commissioner of the U.S. Bureau of Labor Statistics:
Nonfarm payroll employment rose by 145,000 in December, and the unemployment rate was unchanged at 3.5 percent. Notable employment gains occurred in retail trade and health care, while mining lost jobs. In 2019, payroll employment growth totaled 2.1 million, compared with a gain of 2.7 million in 2018.
Of course, he is talking about “Seasonally Adjusted Jobs” from the “Current Population Survey (CPS)”
rather than looking at the results reported by actual companies in their “Current Employment Statistics survey (CES)”This was not a bad jobs report!
For more info see our Current Unemployment Chart and Current U.S. Employment Chart commentary.