![]()
The U.S. Bureau of Labor Statistics (BLS) released its employment / unemployment report for December on January 8th.
- Unadjusted U-3 was Up from 6.4% to 6.5%
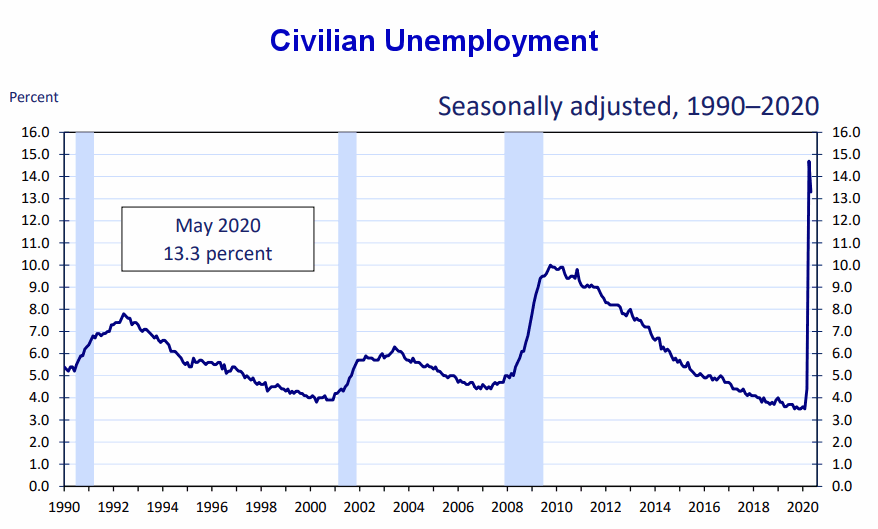
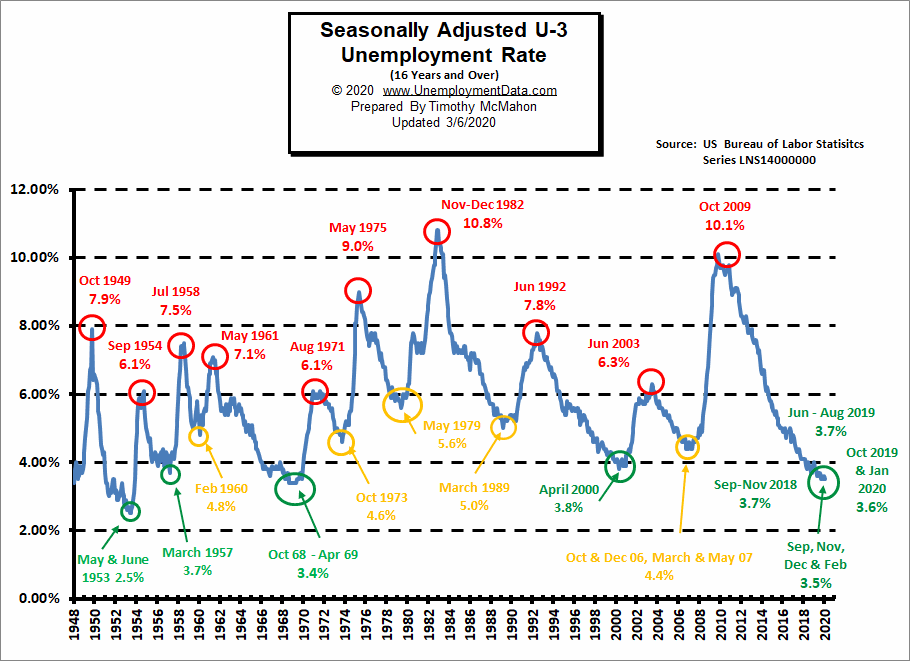
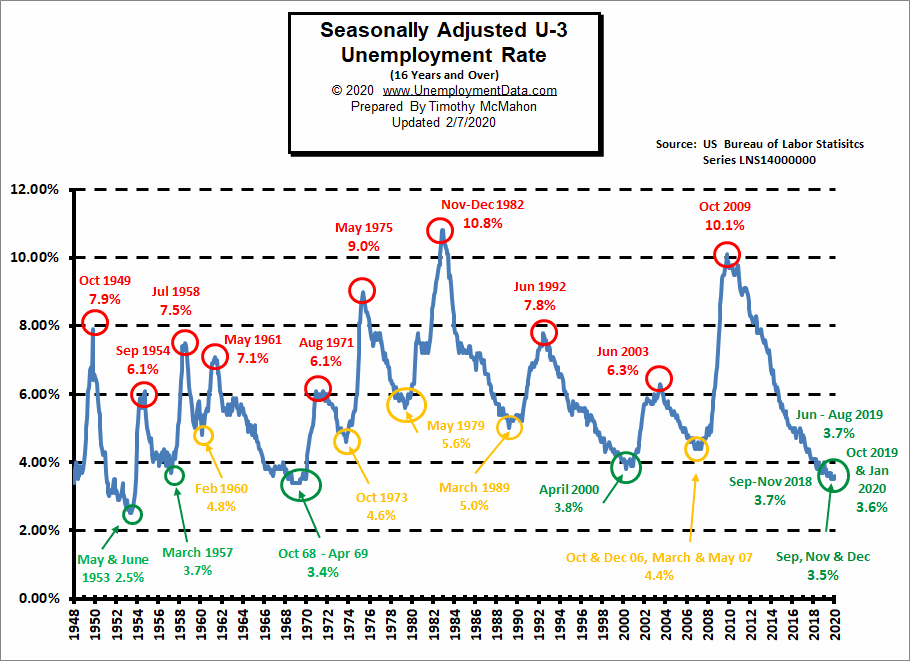
- Adjusted U-3 was unchanged at 6.7%
- Unadjusted U-6 was unchanged at 11.6%
- Labor Force Participation was unchanged at 61.5%
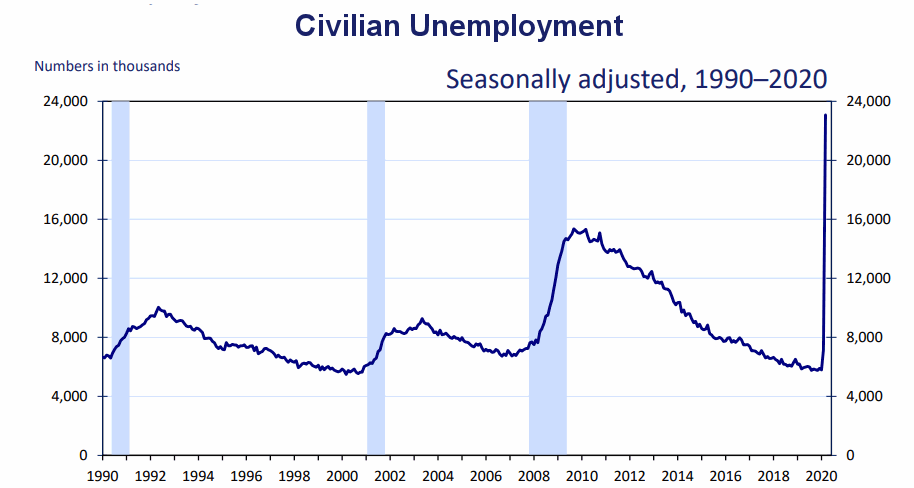
- Unadjusted Employment Down from 144.105 million to 143.777 million
According to the Commissioner of the U.S. Bureau of Labor Statistics:
“Nonfarm payroll employment declined by 140,000 in December, and the unemployment rate was unchanged at 6.7 percent. The decline in payroll employment reflects the recent rise in the number of coronavirus (COVID-19) cases and increased efforts to contain the pandemic. In December, job losses in leisure and hospitality and in private education were partially offset by gains elsewhere, particularly in professional and business services, retail trade, and construction.“
Of course, they are talking about “Seasonally Adjusted Jobs” from the “Current Population Survey (CPS)” rather than looking at the results reported by actual companies in their “Current Employment Statistics survey (CES)”
Looking at the CES report we see…
Originally the BLS reported 144.005 million jobs for November, this month they adjusted that to 144.105 million.
So currently they are saying 143.777 million jobs for December and 144.105 million for November.
which is actually a decrease of 228,000 jobs based on their original estimates.
[Read more…] about Unadjusted Employment Down Slightly in December