The U.S. Bureau of Labor Statistics (BLS) released its employment / unemployment report for August on September 1st 2023.
August Unemployment Up Slightly
![]()
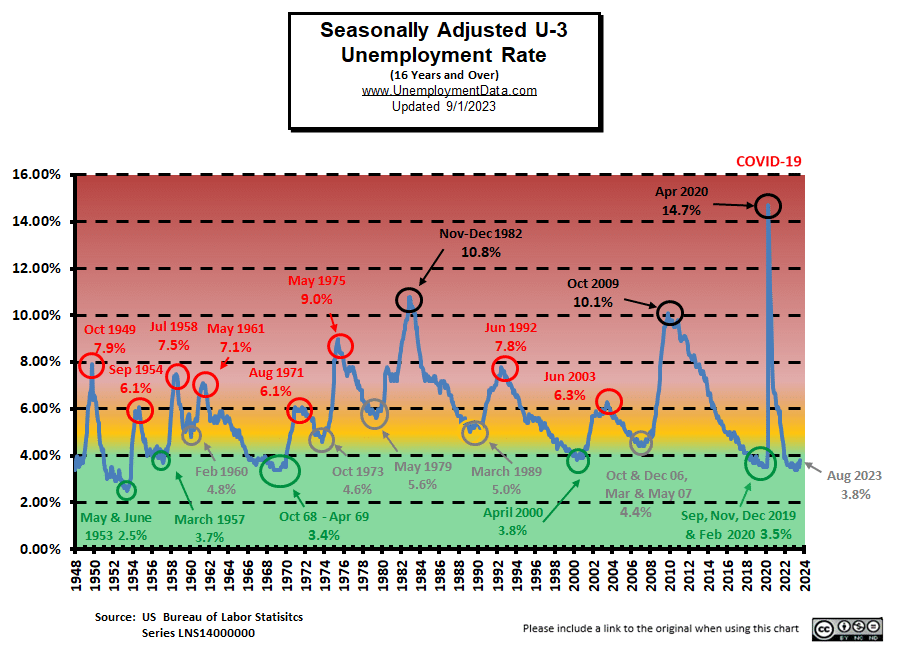
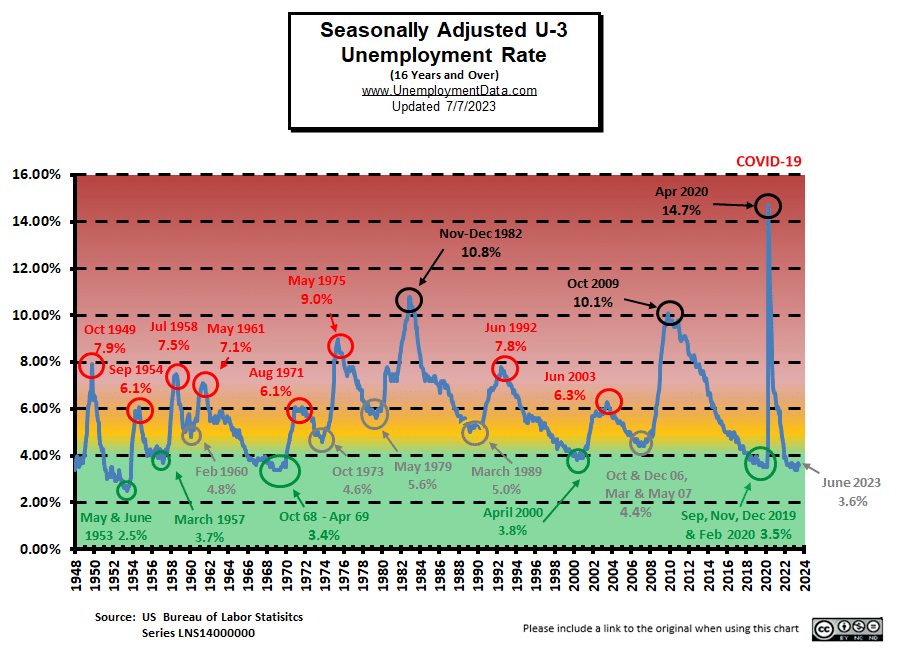
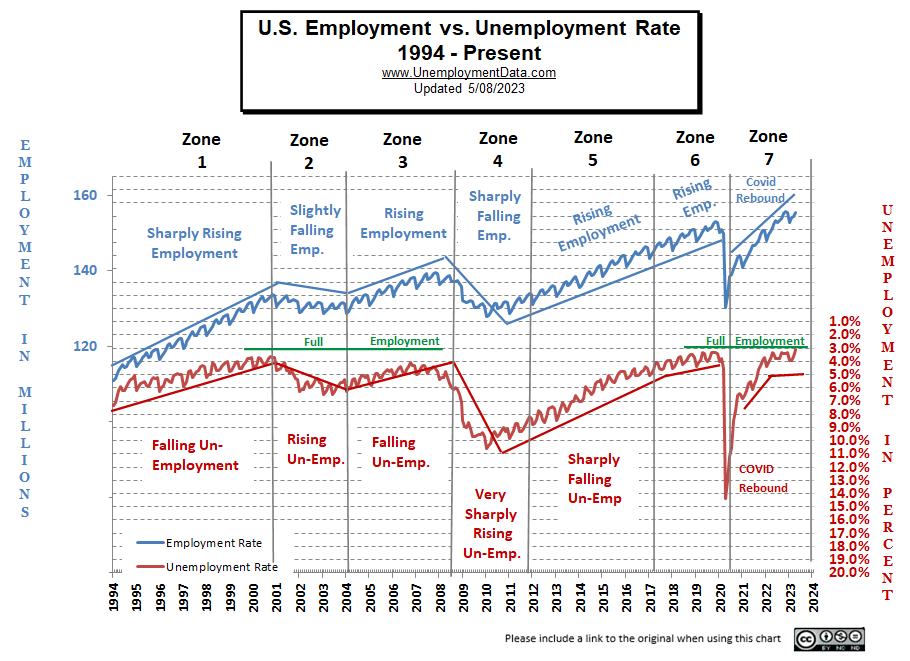
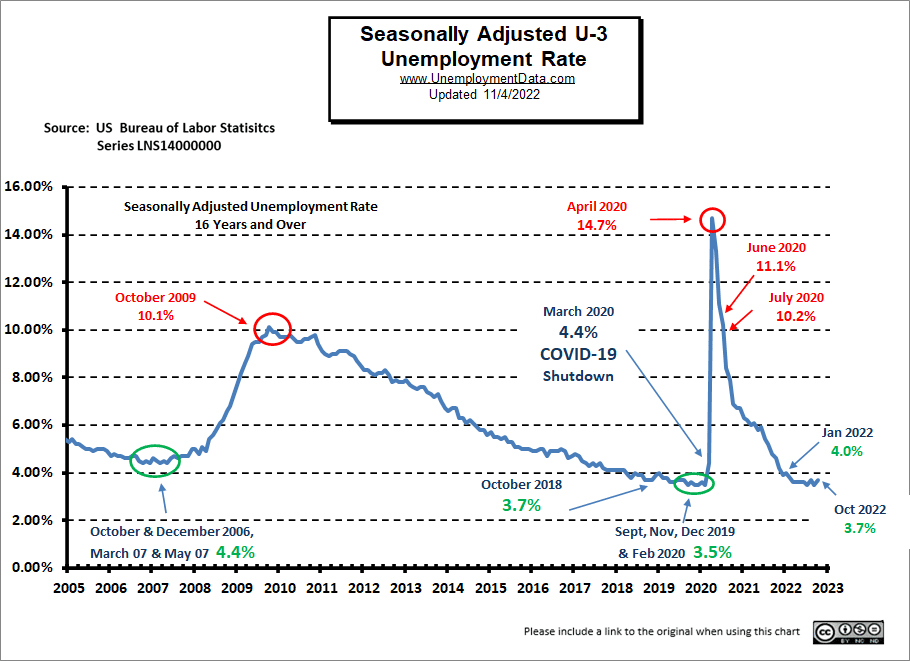
- Adjusted U-3 was 3.8% up from 3.5%
- Unadjusted U-3 was 3.9% up from 3.8%
- Unadjusted U-6 was 7.2% up from 7.1%
- Labor Force Participation was 62.8% up from 62.6%
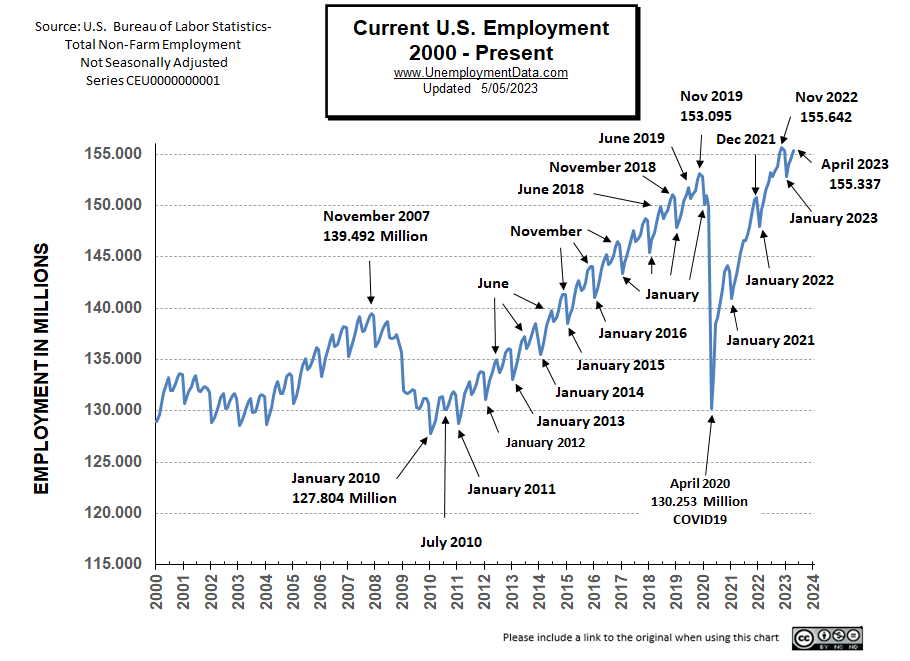
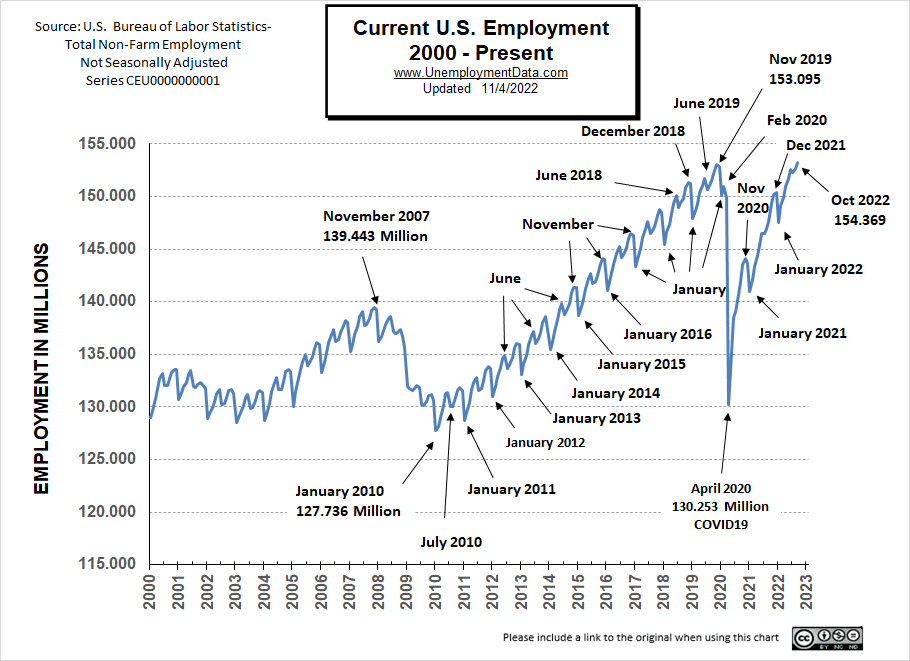
- Unadjusted Employment rose from 156.034 to 156.302 million
Summary:
Despite the fact that the adjusted U3 unemployment rate was up,
slightly more people were working in August than in July.
Total Employed went up from 156.034 million in July to 156.302 million in August.
According to the Commissioner of the U.S. Bureau of Labor Statistics:
“Total nonfarm payroll employment increased by 187,000 in August, and the unemployment rate rose to 3.8 percent, the U.S. Bureau of Labor Statistics reported today. Employment continued to trend up in health care, leisure and hospitality, social assistance, and construction. Employment in transportation and warehousing declined.”
You can read the full BLS report here.
As usual, they are talking about “Seasonally Adjusted Jobs”.
Looking at the Unadjusted Establishment Survey report we see…
Originally the BLS reported employment of 155.126 million for July which they adjusted to 156.034 million. So they subtracted 92,000 jobs for July. They are currently reporting 156.302 million jobs for August which is actually an increase of 176,000 jobs based on their original estimates or an increase of 268,000 based on their updated numbers.
BLS Source
Current Employment Rate Chart
Adjusted Unemployment is slightly above the pre-COVID 2019 cyclical lows of 3.5%. Current levels are still within the “Green Zone”.