The U.S. Bureau of Labor Statistics (BLS) released its employment / unemployment report for August on September 6th, 2024.
Employment / Unemployment
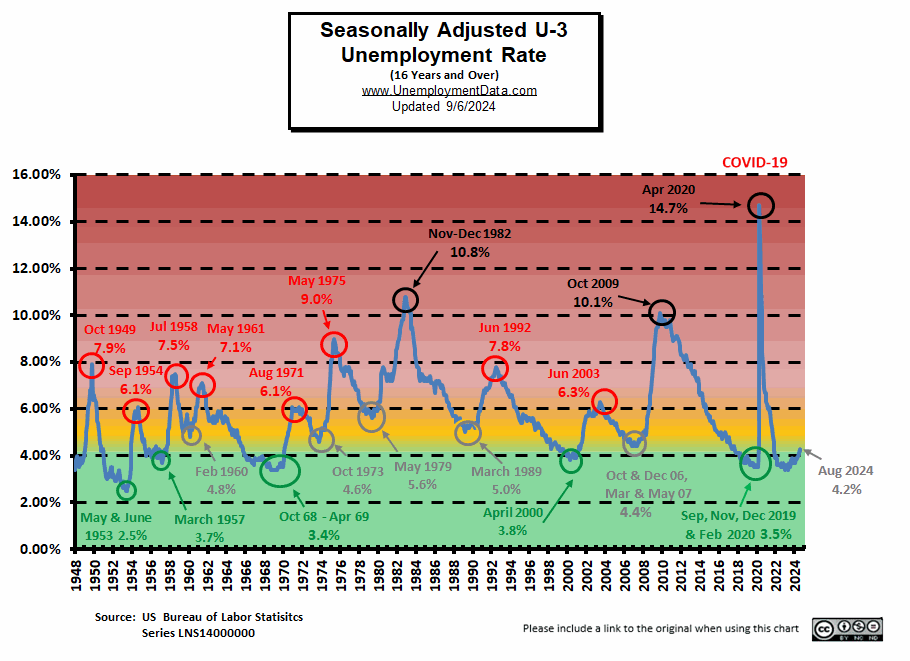
- Seasonally Adjusted U3- 4.2% down from 4.3% in July
- Unadjusted U3- 4.4% down from 4.5% in July
- Unadjusted U6- 8.0% down from 8.2% in July
- Labor Force Participation Rate 62.7% unchanged
- Employment 158.650 million up from 158.387 million
- Next data release October 4th, 2024
Summary:
Total Employed increased in August increased by 205,000 while the Civilian non-institutional population (a relatively narrow definition) increased by 212,000 over the same period so jobs didn’t even keep up with the population.
To make matters worse, jobs decreased by -947,000 in July and then the BLS announced the March 2024 Jobs numbers will be adjusted down by 818,000 in January. So, we can expect the January adjustment report to show all the numbers for 2024 to be pretty much fiction.
But… According to the Commissioner of the U.S. Bureau of Labor Statistics:
“Total nonfarm payroll employment increased by 142,000 in August, and the unemployment rate changed little at 4.2 percent, the U.S. Bureau of Labor Statistics reported today. Job gains occurred in construction and health care…
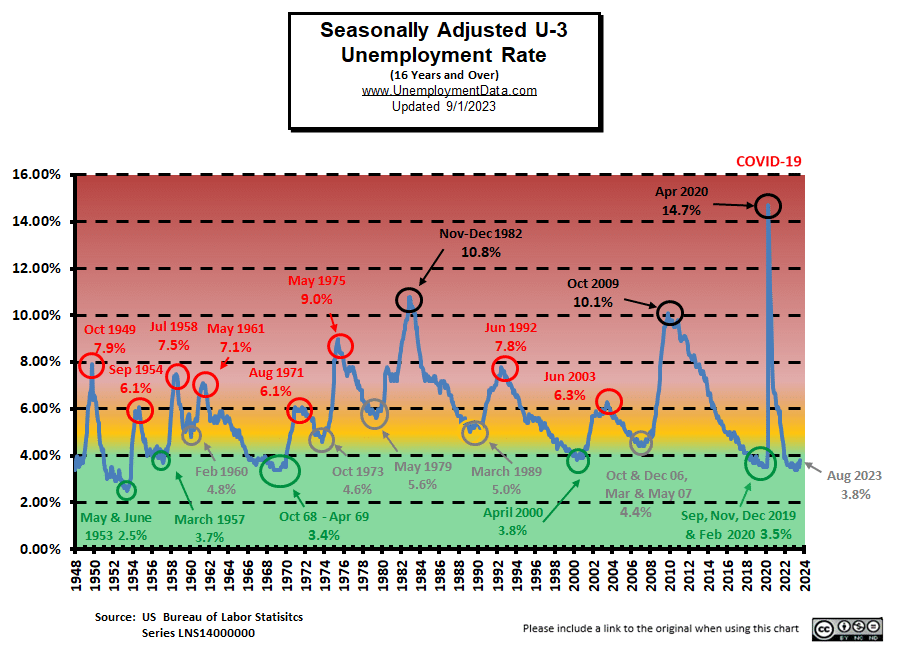
Both the unemployment rate, at 4.2 percent, and the number of unemployed people, at 7.1 million, changed little in August. These measures are higher than a year earlier, when the jobless rate was 3.8 percent, and the number of unemployed people was 6.3 million.”
You can read the full BLS report here.
As usual, they are talking about “Seasonally Adjusted Jobs”.
Looking at the Unadjusted Establishment Survey report we see…
Originally the BLS reported employment of 158.445 million for July
which they adjusted down -58,000 to 158.387 million in today’s report .
They are currently reporting 158.650 million jobs for August which is actually an increase of 205,000 jobs based on their originally reported July numbers. But still below the 159.392 million originally reported in June and not that much different than the 158.461 originally reported last November. The LFPR was unchanged from July at 62.7%.
Bad News for the Market?
The stock market peaked on August 30th and has fallen since then and the jobs report didn’t help stem the decline. After the Friday jobs report the NYSE fell another 1.14%. Our NYSE ROC chart created based on August month-end numbers showed a cross above the top line of a long-term channel and we said “The market is definitely at a point of exuberance. We can expect it to correct back down to at least the yellow Mid-Term Support.”
The current drop just brings the NYSE back within the channel, so it still has a long way to go to get to the channel mid-point.
On the geopolitical front, Hamas killed several hostages rather than let them be rescued. So the market still fears a war in the Middle East. The Japanese financial problems seem to have settled down now and the market is anticipating a FED rate cut shortly.
Current Unemployment Rate Chart
Seasonally Adjusted U3 Unemployment is well above the pre-COVID 2019 cyclical lows of 3.5%, but is approaching the yellow zone.


