• About WordPress
    • WordPress.org
    • Documentation
    • Learn WordPress
    • Support
    • Feedback
  • Log In
  • Skip to primary navigation
  • Skip to main content
  • Skip to primary sidebar
  • Home
  • Contact us
  • Related Sites
    • InflationData.com
    • Financial Trend Forecaster
    • Your Family Finances
    • Elliott Wave University
    • Optio Money
  • About
    • Terms of Use
    • Disclaimer & Disclosure
    • Privacy Statement
  • Sitemap
    • 2009-2010 Posts
    • 2011 Posts

UnemploymentData.com

Your Source for Employment and Unemployment Data

Unemployment
  • Charts
    • Current Unemployment Rate Chart
    • Current Employment Rate (Chart and Data)
    • Current Employment vs Unemployment Chart
    • Historical Employment Data
    • Employment Population Ratio
    • Misery Index
  • Unemployment
    • Historical Unemployment Rate Tables
    • What Is U-6 Unemployment?
    • Unadjusted vs. Seasonally Adjusted U-3 Unemployment Rate
    • BLS vs. Gallup Unemployment Numbers
    • Current U-6 Unemployment Rate
    • What is the Labor Force Participation Rate?
    • What is the Real Unemployment Rate?
  • Employment
    • Current Employment Rate (Chart and Data)
    • Historical Employment Data
    • Contacting a Live Person at the State Employment Commission
      • How to Talk to a Live Person at the Virginia Unemployment Commission
      • Florida’s FLUID Unemployment Program
    • Benefits
      • Insurance
      • Retirement
    • Careers
    • Employment Costs
    • Experience
    • Government
    • Job Hunting
      • Interview
      • Resume
  • Find Articles
  • Education
    • Skills
  • General
    • Small Business
      • Outsourcing
    • Success
You are here: Home / Archives for April

April

April Unemployment- Bad News is Good News?

May 4, 2024 by Tim McMahon

The U.S. Bureau of Labor Statistics (BLS) released its employment / unemployment report for April on May 3rd, 2024.

Employment / Unemployment 

Adj U3 Icon 3-9up

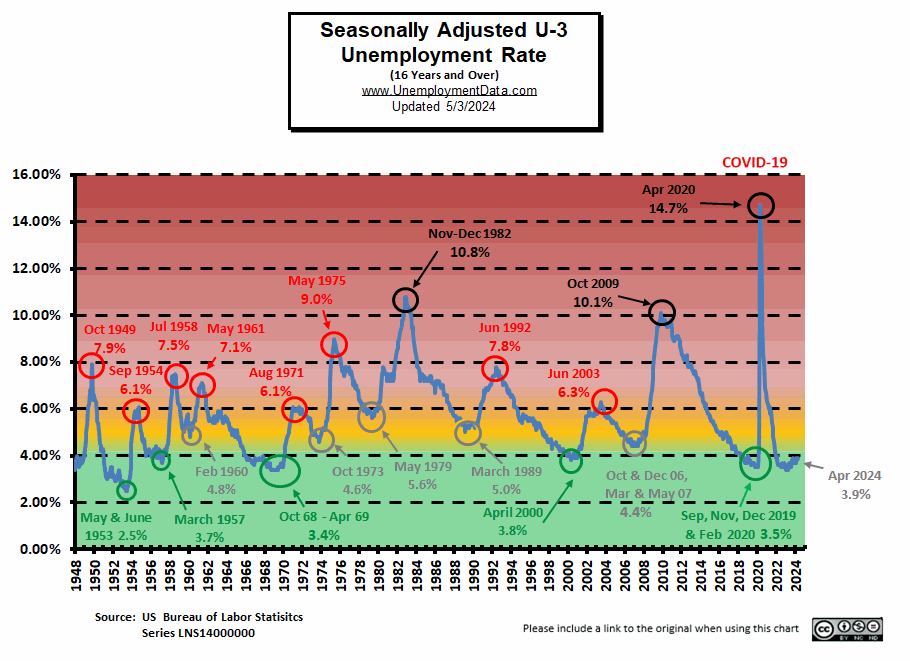
  • Seasonally Adjusted U3:  3.9% up from 3.8% in March
  • Unadjusted U3: 3.5% down from 3.9% in March
  • Unadjusted U6: 6.9% down from 7.4% in March
  • Labor Force Participation was 62.7% unchanged
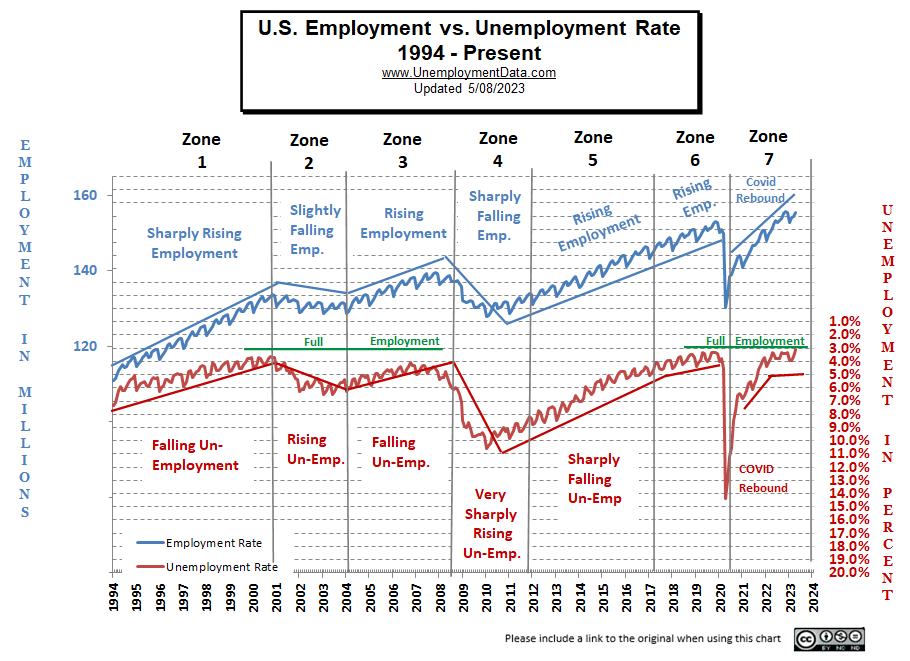
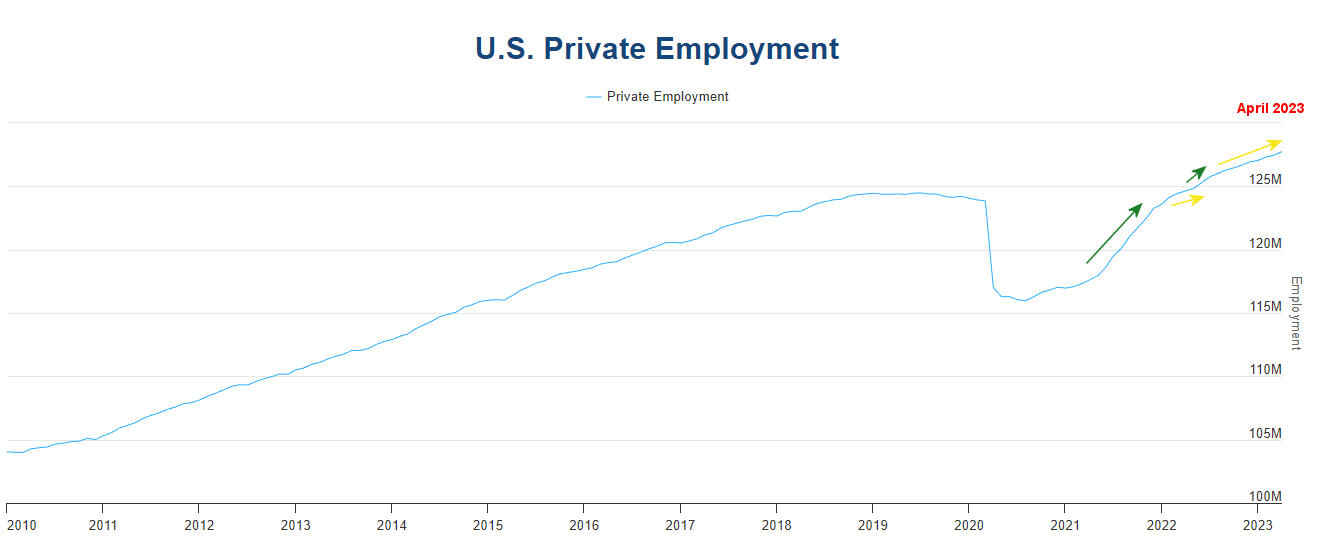
  • Unadjusted Employment rose from 157.213 million to 158.016 million
  • Next data release June 7th 2024

Summary:
Total Employed increased in April, Unadjusted Unemployment was down, but Seasonally adjusted Unemployment increased.

According to the Commissioner of the U.S. Bureau of Labor Statistics:

“Total nonfarm payroll employment increased by 175,000 in April, and the unemployment rate changed little at 3.9 percent, the U.S. Bureau of Labor Statistics reported today. Job gains
occurred in health care, in social assistance, and in transportation and warehousing. 

Both the unemployment rate, at 3.9 percent, and the number of unemployed people, at 6.5 million changed little in April. The unemployment rate has remained in a narrow range of 3.7 percent to 3.9 percent since August 2023.”

You can read the full BLS report here.

As usual, they are talking about “Seasonally Adjusted Jobs”.

Looking at the Unadjusted Establishment Survey report we see…
Originally the BLS reported employment of 157.218 million for March which they adjusted slightly to 157.213 million.

They are currently reporting 158.016 million jobs for April which is actually an increase of 798,000 jobs compared to the original numbers or 803,000 based on their new numbers.

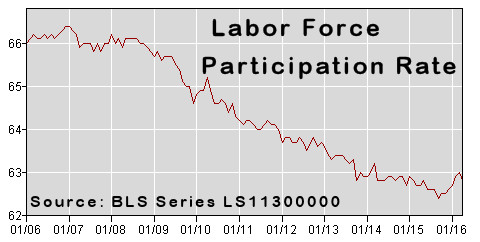
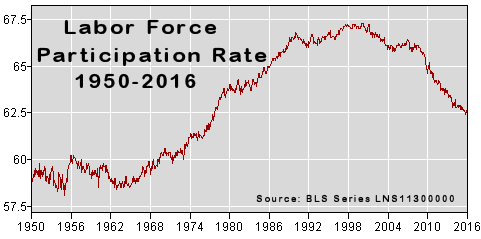
The LFPR was unchanged at 62.7%.

Bad News is Good News for the Market

In the perverse stock market of these post-pandemic days, the market is looking for an excuse for the FED to cut interest rates so “Bad News is Good News” for the market. So, with the Adjusted U3 rising, Mr. Market took that as “Bad News” and rallied.

BUT… was it really even bad news? Or was it Fake News?

First of all, it was only the “Adjusted” U3 that increased, the Unadjusted U3 was down from 3.9% to 3.5% and the Unadjusted U6 was down from 7.4% to 6.9%. So, unadjusted unemployment was good news, making it bad news for the market?

Typically we can think of the adjusted rate as a comparison to the average. So let’s look at what has happened in the UNADJUSTED U3 over the last few years.

Unadjusted U3

Date March April Change
2024 3.9% 3.5% -0.4%
2023 3.6% 3.1% -0.5%
2022 3.8% 3.3% -0.5%
2021 6.2% 5.7% -0.5%

So, what do we see? Over the last few years, the unadjusted U-3 declined -0.5% from March to April so that is the “normal” behavior for March – April. But this year, it only declined -0.4%. So, in perverse Government logic, it increased by +0.1%. Thus,  Adjusted U-3 went from 3.8% last month to 3.9% this month. But actual unemployment fell from 3.9% to 3.5% this is a decrease not an increase (just not quite as big a decrease as usual). But Mr. Market was looking for an excuse to rally, so any excuse will do.

As I’ve said many times, January unemployment is the worst and it gets progressively better until summer when all the kids get out of school and the workforce swells making it look like more people are unemployed.

Actually, there are some good reasons for the Seasonal adjustments see Adj vs Unadj. But in this case, looking at the Adjusted numbers compared to last month isn’t going to give you the picture the market was looking for.  Looking at the chart below we can see that even at 3.9% unemployment is still in the green, so there is nothing there to convince the FED to start easing.

Current Unemployment Rate Chart

Seasonally Adjusted U3 Unemployment remains above the pre-COVID 2019 cyclical lows of 3.5%, as well as above the lows made early in 2023. But have retreated away from the “yellow zone.”

Seasonally Adj U-3 Unemployment Rate Apr 24

[Read more…] about April Unemployment- Bad News is Good News?

Filed Under: BLS Tagged With: April, BLS, unemployment

April Employment Nears All-Time Highs

May 6, 2023 by Tim McMahon

The U.S. Bureau of Labor Statistics (BLS) released its employment / unemployment report for April on May 5th 2023.

Employment Near All-Time High 

Seasonally Adjusted U3 down to 3.4%

  • Adjusted U-3 was 3.4% down from 3.5%
  • Unadjusted U-3 was 3.1% down from 3.6%
  • Unadjusted U-6 was 6.1% Down from 6.8%
  • Labor Force Participation unchanged at 62.6%
  • Unadjusted Employment rose from 154.445 million to 155.337 million


According to the Commissioner of the U.S. Bureau of Labor Statistics:

“Total nonfarm payroll employment rose by 253,000 in April, and the unemployment rate changed little at 3.4 percent, the U.S. Bureau of Labor Statistics reported today. Employment continued to trend up in professional and business services, health care, leisure and hospitality, and social assistance.”

You can read the full BLS report here.

As usual, they are talking about “Seasonally Adjusted Jobs”.

Looking at the Establishment Survey report, we see…
Originally the BLS reported employment of 154.517 million for March which they adjusted to 154.445 million. So they subtracted 72,000 jobs for March. They are now reporting 155.337 million jobs for April, which is an increase of 820,000 based on their original estimates or an increase of 892,000 based on their updated numbers. 

Current Employment Rate Chart

November 2022 had the highest number of people employed in the history of the United States at 155,642,000. Then the typical January slump hit, taking employment down by roughly 3 million. But now employment is once again nearing that high. And if history is any indicator, we can expect employment to peak in June above November’s level before taking another breather. So far, as of April, employment is just a little over 300,000 shy of the all-time high. One way we can tell if the economy is beginning to falter is if the June high doesn’t exceed the previous November, or if November 2023 employment doesn’t exceed June 2023.

Current Employment ChartSee Current Employment for more info.

Full Employment?

Last month we said, “Full Employment is when everyone who wants a job has one. It is generally considered to be slightly above 3%. Although, other factors, such as unemployment benefits, can shift the level higher or lower. So, if unemployment benefits are extended from 6 months to 1 year, people will tend to stay unemployed longer, thus raising the unemployment rate.”

The following chart shows four examples of employment continuing to rise, but unemployment flattens out at just over 3%. Currently, the unadjusted unemployment rate is at 3.1%, as close to the theoretical full employment as you can get. Over the next few months, we will see how well reality relates to theory and if unemployment can actually get below 3%.

Note: The Unemployment rate is inverted to track the employment rate, neither is Seasonally Adjusted.

Employment vs Unemployment Chart

Full employment is not considered to be at zero percent because even when employers are having difficulty finding employees, some people are still unemployed due to either structural unemployment (mismatch between worker skills and job requirements, i.e., not enough training) or simply because they quit their job knowing it would be easy to find another (hopefully better) job. Often referred to as frictional unemployment (there will always be people who have quit or have lost a seasonal job and are in the process of getting a new job). See: Highly Skilled Worker Shortage in a Recession?

If the unemployment rate stays constant, but more people are working, where are these extra workers coming from?

Somehow the workforce has to be growing to accommodate these newly created jobs. They could be long-term unemployed (no longer counted in the workforce) returning to the workforce, they could be immigrants entering the workforce, or possibly retired people coming out of retirement because of an offer too good to turn down. This is generally facilitated by rising wages, but this month’s ADP report indicates that wage growth has slowed, possibly indicating that we are nearing the end of this boom.

Reasons for Unemployment

As we can see from the following chart, Job losers and persons who completed temporary jobs (black line) always creates some job turnover (i.e. temporary unemployment), although this month the level of turnover decreased somewhat. There is also a steady stream of reentrants, new entrants, and those on temporary layoff.

Reasons for unemployment

Duration of Unemployment

If the duration of unemployment begins climbing, it generally indicates a worsening economic climate. The following chart shows a falling less than 5 weeks of unemployment (which could indicate people are starting to be unemployed for longer times or simply that it is easy to find a new job). 5-14 week unemployment rose slightly, 15-26 week unemployment fell, and 27 weeks and over was relatively unchanged. The trouble starts when 15-26 week unemployment begins rising, followed by longer-term unemployment.

Duration of Unemployment The following chart shows an uptick in the percentage of people unemployed 27 weeks or longer, which could be an early warning indicator.

Unemployed 27+ weeks

ADP® National Employment Report

ADP provides an independent (non-government) estimate of private-sector employment and pay, based on data derived from ADP client payrolls. According to ADP®, In collaboration with Stanford Digital Economy Lab, private employment was up in April.

ADP: Private employers added 296,000 jobs in April compared to 145,000 jobs in March.

ADP Employment Comments


Ms. Richardson is saying that although employers are still hiring, upward pressure on salaries has eased somewhat.

I’ve added some arrows to the ADP private employment chart, to indicate the slope of the line. The long green arrow shows the rapid post-COVID rebound in employment. Then in early 2022, the rate of increase slowed (small yellow arrow). Then around March 2022, the rate of increase picked up again (small green arrow). More recently, the rate of growth has moderated, possibly due to nearing full employment. As long as the slope is upward, the economy is still growing, despite the difficulty in finding qualified employees.


ADP Private Employment by Firm Size

ADP also lists increases by “firm size”.
This month, all-size companies added employees. Last month the only one that decreased was companies with 250-499 employees.

April ADP Changes:

Change by Est Size for Apr 2023


ADP Also Tracks Salary Changes:

[Read more…] about April Employment Nears All-Time Highs

Filed Under: Employment Tagged With: ADP, April, BLS, Bureau of Labor Statistics, employment, Jobs Report, unemployment

Coronavirus Shutdown Causes 20 Million Job Losses

May 9, 2020 by Tim McMahon

Unemployment 14.7%

The U.S. Bureau of Labor Statistics (BLS) released its employment / unemployment report for April on May 8th.

COVID-19 Shutdowns Send Unemployment Rate Soaring

  • Unadjusted U-3 was Up from 4.5% to 14.4%!
  • Adjusted U-3 was Up from 4.4% to 14.7%!
  • Unadjusted U-6 was Up from 8.9% to 22.4%!
  • Labor Force Participation fell from 62.7% to 60.2%.
  • Unadjusted Employment down by approx. -19.5 MILLION jobs.

Civilian Unemployment

In April, the ranks of the unemployed swelled by almost 20 million bringing it up to approximately 23 million in total. Rather than looking at percentages, the following chart looks at the actual number of unemployed individuals. The current number of unemployed is considerably higher than at the peak of the 2008-2010 “great recession”.

Civilian Unemployment Chart

According to the Commissioner of the U.S. Bureau of Labor Statistics:

Nonfarm payroll employment declined by 20.5 million in April, and the unemployment rate increased to 14.7 percent, reflecting the widespread impact on the job market of the coronavirus (COVID-19) pandemic and efforts to contain it. Employment fell sharply in all major industry sectors, with a
particularly large decline in the leisure and hospitality sector.

The response rate for the household survey continued to be adversely affected by pandemic-related issues, while that for the establishment survey returned to a normal range in April. In addition, there were changes to the estimation methods for the establishment survey to better account for the historic number of temporary or permanent business closures in April. The impacts of the pandemic on the household and payroll surveys are detailed in the April Employment Situation news release and accompanying materials (available on the BLS website)). For both surveys, we were able to obtain estimates that met BLS standards for accuracy and reliability.

The substantial job declines related to the coronavirus pandemic started in March, as payroll employment declined by 870,000, as revised. Job losses accelerated in April, as an additional 20.5 million jobs were lost. These April losses were pervasive across all industry sectors, and brought nonfarm employment to its lowest level since February 2011.

Of course, he is talking about “Seasonally Adjusted Jobs” from the “Current Population Survey (CPS)”
rather than looking at the results reported by actual companies in their “Current Employment Statistics survey (CES)”

Looking at the CES report we see…
Originally the BLS reported 150.804 million jobs for March and then they subtracted 221,000 jobs from that estimate.
So currently they are saying 150.583 million jobs for March and 131.071 million jobs for April which is actually a decrease of  -19.733 million jobs compared to what they originally reported last month. Or -19.512 million jobs based on their current estimates of March’s employment.

[Read more…] about Coronavirus Shutdown Causes 20 Million Job Losses

Filed Under: General Tagged With: 20 Million, 2020, April, BLS, Commissioner, Coronavirus, COVID, COVID-19, employment, Hispanic, Peak, unemployment

April Unemployment Lowest Level Since 2000

May 5, 2018 by Tim McMahon

U-3 Unemployment 3.9%

The U.S. Bureau of Labor Statistics (BLS) released their monthly employment survey results for the month of April on Friday May 4th .

At 3.9% the Seasonally Adjusted U-3 Unemployment Rate is at its lowest level since December 2000. The Unadjusted U-3 is at 3.7%.

Many Experts consider this to be the new “Full Employment” level i.e. everyone who wants a job has found one however with the Labor Force Participation rate still well below the average that is debatable.  See Is the U.S. Really at “Full Employment”? for more information.

Key April Employment and Unemployment Numbers

  • Adjusted U-3 Unemployment-   3.9% Down from 4.1% October – March.
  • Unadjusted U-3 Unemployment-  3.7% down from 4.1% in March.
  • Unadjusted U-6 Unemployment-   7.4% Down massively from 8.1% in March and 8.6% in February.
  • Employment 148.367 million up from 147.369 million in March but still below the 148.783 million in November.
  • Gallup has discontinued publishing U-6 & U-3 numbers.

See Current Unemployment Chart for more info.

Employment by Sector

The employment “bubble chart” gives us a good representation of how each sector of the economy is doing (employment wise). As we can see from the chart below only one sector is to the left of the zero line this month indicating that all other sectors gained employees in April except Wholesale Trade which lost -9,800 employees on a “Seasonally Adjusted” basis.

Employment by Sector Bubble Chart April 2018The biggest gainers were Professional and Business Services (bubble furthest to the right) which added 54,000 jobs, followed by Education and Health Services which gained 31,000 jobs and Manufacturing which gained 24,000 jobs. Interestingly all three were the top gainers last month as well with similar gains. Average weekly earnings for all industries increased from $925.29 to $925.98.

(See the table below the chart for average weekly earnings and other details.)


How to read this chart:

Bubbles location on the chart tell us two things:

  • Change in Employment Levels over the most recent month.
  • Average Weekly earnings.
  • The further to the right the bubble the larger the increase in the number of jobs.
  • The higher up on the chart the larger the average salary.

Bubble Size tells us:

  • Total Employment for the sector.
  • Larger bubbles mean more people are employed in that sector.

Employment and Average Weekly Earnings by Industry for All Employees

April 2018, Seasonally Adjusted

Industry Monthly Increase Average Weekly Earnings Employment Level
Total Private Employment 168,000 $925.98 126,106,000
Mining and Logging 8,000 $1,483.82 730,000
Construction 17,000 $1,170.39 7,174,000
Manufacturing 24,000 $1,106.00 12,655,000
Wholesale trade -9,800 $1,176.34 5,952,700
Retail trade 1,800 $575.67 15,927,000
Transportation and Warehousing 400 $943.71 5,285,400
Utilities 1,000 $1,698.31 555,300
Information 7,000 $1,416.93 2,772,000
Financial Activities 2,000 $1,285.92 8,549,000
Professional and Business Services 54,000 $1,166.73 20,869,000
Education and Health Services 31,000 $884.40 23,517,000
Leisure and Hospitality 18,000 $413.16 16,272,000
Other Services 14,000 $773.69 5,848,000

U-6 Unemployment

U3 vs U6 UnemploymentLooking at the broader measure of Unemployment which includes discouraged workers, we see that the U-6 unemployment rate fell steadily from 8.9% in January to 7.4% in April.

See Unadjusted U-6 unemployment for more info.

Employment

Historical Employment

Over the last month, the actual number of people working (not seasonally adjusted) has increased by 998,000  jobs in April. The BLS Commissioner said:

“Nonfarm payroll employment increased by 164,000 in April, and the unemployment rate edged down to 3.9 percent. Over the month, job gains occurred in professional and business services, manufacturing, health care, and mining.“

Actual employment was 147.369 million in March and 148.367 million in April for an actual increase of 998,000 not the 164,000 spoken of by the Commissioner. The 164,000 is “Seasonally Adjusted” meaning that employment increased by that much more than average for this time of year.


See Employment Commentary.

Employment / Population Ratio

If you take the number of jobs and divide it by the population you get what percentage of the population is working. You

[Read more…] about April Unemployment Lowest Level Since 2000

Filed Under: BLS Tagged With: April, employment, Sector, unemployment

BLS Monthly Employment Report for April

May 6, 2016 by Tim McMahon

The US economy added 160,000 “seasonally adjusted” jobs in April, the lowest figure in the last seven months. The adjusted U-3 unemployment rate remained steady at 5%. The Unadjusted U-3 fell to 4.7% while the Unadjusted U-6 fell to 9.3% from 9.9% last month.
Job Creation April 2016On a seasonally adjusted basis employment has fallen while on a non-adjusted basis the actual number of non-farm employed has increased from 142.887 Million to 143.944 million for a net increase of  1,057,000 jobs but since April traditionally sees a large increase in seasonal workers the seasonally adjusted number says that we were only 160,000 jobs better than what we would expect if there were zero jobs growth.

Labor Force Participation Rate

The Labor Force Participation Rate (LFPR) is the percentage of the Labor Force that is currently either looking for a job or actually has one. So even though it sounds like it is talking about how many people are working it actually is the percentage who “want to work”.  As of  April this stands at 62.8%. This rate has been steadily falling for a number of years and has reached levels not seen since the 1970’s.

Since the Bureau of Labor Statistics measures unemployment as the percentage of the labor force that can’t find work as people stop looking for work they fall out of the labor force and are no longer counted. Thus the unemployment rate can fall even though no new jobs have been created.

Labor Force Participation Rate Apr-2016

Long Term Labor Force Participation Rate

Labor Force Participation Rate 1950-Feb2016As we can see from the above chart the LFPR peaked in the late 1990’s and fell during the recession from 2000 through 2004. From 2004 through 2007 it leveled off  but then the “Great Recession” hit and the LFPR has fallen pretty steadily since. And even though we are supposed to be in a recovery the LFPR continues to fall although there was a bit of an up tick at the end of 2015 and early 2016, April’s LFPR is lower than March’s.

Some people wrongly assume that the LFPR is falling due to retiring baby-boomers.  This premise however has been proven false. See Record Low LFPR which shows the LFPR by age group since 1999. The biggest declines occur in the younger ages while those above age 60 actually show a higher percentage are working. For instance, in 1999 only 24% of those age 65-69 were working but according to the BLS in 2015 30.8% of those age 65-69 were working.

Gallup “Good Jobs” Index

Gallup’s “Good Jobs” Index is their version of the LFPR it is calculated as a percentage of the total population rather than limiting it to the “work force”.  So although the percentage is lower it is a better indicator of the actual situation since it is not subject to fudging through simply redefining who is in the “work force”. Gallup says 44.9% of the total adult population is in the “Good Jobs” Index i.e. has a full-time job. This does not mean that they are employed at their full capacity or that they are earning a “decent wage” simply that they are employed full-time. Gallup defines a full-time as 30+ hours per week for an employer who provides a regular paycheck. This is up from 44.5% last month confirming the seasonal increase in employment mentioned above.

Filed Under: Employment Tagged With: 2016, April, employment, Good Jobs Index, Labor Force Participation, unemployment

Primary Sidebar

Search Site

Sponsored:

URGENT: These Stocks Stand Poised to Benefit from President Trump's Trade Wars!

As the Trump administration moves ahead with aggressive tariff policies on key imports, the mainstream media is scrambling.

This Free Report - which you can download now - reveals the names and ticker symbols of 5 Stock Poised to Benefit Most from President Trump's Tariff Wars.

Click Here to Download Your FREE Stock Report Now.

Recent Posts

  • April 2025 Employment / Unemployment Report
  • Would More Jobs Help Social Security?
  • March 2025- Employment / Unemployment Report
  • February 2025 Jobs Report
  • January 2025 BLS Employment Report

Resources

  • Bureau of Labor Statistics Current Population Survey Monthly survey of households conducted by the Bureau of Census for BLS. It provides data on the labor force, employment, unemployment, etc.
  • Capital Professional Services Providing web design and development and Internet marketing services
  • Elliott Wave University Using the Elliott Wave Principle to improve investment performance
  • Financial Trend Forecaster Featuring Moore Inflation Predictor, NYSE Rate of Change and NASDAQ Rate of change
  • InflationData.com Inflation calculators, databases, etc.
  • Intergalactic Web Designers Web design and development services
  • Your Family Finances

Articles by Category

Articles by Date

Disclaimer

At UnemploymentData.com we are not registered investment advisors and do not provide any individualized advice. Past performance is not necessarily indicative of future performance and future accuracy and profitable results cannot be guaranteed.

Privacy & Terms of Use

Privacy Statement & Terms of Use

Do Not Sell My Information

Copyright © 2025 · News Pro on Capital Professional Services, LLC. All rights reserved · Log in