• About WordPress
    • WordPress.org
    • Documentation
    • Learn WordPress
    • Support
    • Feedback
  • Log In
  • Skip to primary navigation
  • Skip to main content
  • Skip to primary sidebar
  • Home
  • Contact us
  • Related Sites
    • InflationData.com
    • Financial Trend Forecaster
    • Your Family Finances
    • Elliott Wave University
    • Optio Money
  • About
    • Terms of Use
    • Disclaimer & Disclosure
    • Privacy Statement
  • Sitemap
    • 2009-2010 Posts
    • 2011 Posts

UnemploymentData.com

Your Source for Employment and Unemployment Data

Unemployment
  • Charts
    • Current Unemployment Rate Chart
    • Current Employment Rate (Chart and Data)
    • Current Employment vs Unemployment Chart
    • Historical Employment Data
    • Employment Population Ratio
    • Misery Index
  • Unemployment
    • Historical Unemployment Rate Tables
    • What Is U-6 Unemployment?
    • Unadjusted vs. Seasonally Adjusted U-3 Unemployment Rate
    • BLS vs. Gallup Unemployment Numbers
    • Current U-6 Unemployment Rate
    • What is the Labor Force Participation Rate?
    • What is the Real Unemployment Rate?
  • Employment
    • Current Employment Rate (Chart and Data)
    • Historical Employment Data
    • Contacting a Live Person at the State Employment Commission
      • How to Talk to a Live Person at the Virginia Unemployment Commission
      • Florida’s FLUID Unemployment Program
    • Benefits
      • Insurance
      • Retirement
    • Careers
    • Employment Costs
    • Experience
    • Government
    • Job Hunting
      • Interview
      • Resume
  • Find Articles
  • Education
    • Skills
  • General
    • Small Business
      • Outsourcing
    • Success
You are here: Home / Archives for 2024

2024

November Unemployment Report

December 7, 2024 by Tim McMahon

The U.S. Bureau of Labor Statistics (BLS) released its employment / unemployment report for November on December 6th, 2024.

Employment / Unemployment 

Adj U3 Unemployment 4.2%

  • Seasonally Adjusted U3- 4.2% Up from October
  • Unadjusted U3- 4.0% Up from October
  • Unadjusted U6- 7.4% Up from October
  • Labor Force Participation Rate 62.5% down from October
  • Employment 160.560 million up from 160.035 million
  • Next data release January 3rd, 2025


Summary:
Total Employed increased in November, but Unemployment increased. Labor Force Participation fell by 0.1%.  In the perversity of markets, overall, the report was sufficiently bad to give the market hope for another rate cut by the FED.

According to the Commissioner of the U.S. Bureau of Labor Statistics:

“Total nonfarm payroll employment rose by 227,000 in November, and the unemployment rate changed little at 4.2 percent, the U.S. Bureau of Labor Statistics reported today. Employment trended up in health care, leisure and hospitality, government, and social assistance. Retail trade lost jobs.

Both the unemployment rate, at 4.2 percent, and the number of unemployed people, at 7.1 million, changed little in November. These measures are higher than a year earlier, when the jobless rate was 3.7 percent, and the number of unemployed people was 6.3 million.”

As usual, they are talking about “Seasonally Adjusted Jobs”.

Looking at the Unadjusted Establishment Survey report we see…
Originally the BLS reported employment of 160.007 million for October
which they adjusted slightly to 160.035 million.

They are currently reporting 160.560 million jobs for November which is actually an increase of 525,000 jobs based on the new numbers or 553,000 based on the original numbers. The LFPR was down from 62.6% to 62.5%.

Bad News is Good News?

Once again, the stock market took the report as bad enough to generate hope that the FED will cut rates again soon but not so bad to wreck the economy.

Current Unemployment Rate Chart

As we can see from the chart below, although still low, over the last year unemployment has risen 0.8% from the lows of 2023. At 4.2% unemployment is no longer in the “Excellent” range but still in the “Very Good” range.

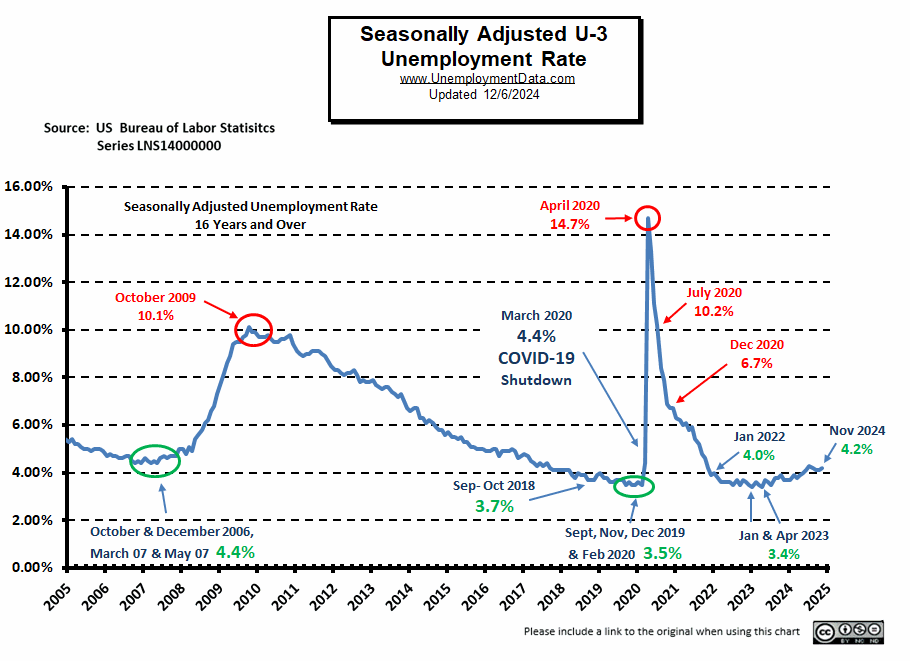
Seasonally Adj U-3 Unemployment Rate Nov 2024


[Read more…] about November Unemployment Report

Filed Under: BLS Tagged With: 2024, BLS, November

July Jobs Report Spooks Stock Market

August 3, 2024 by Tim McMahon

The U.S. Bureau of Labor Statistics (BLS) released its employment / unemployment report for July on August 2nd, 2024.

Employment / Unemployment 

Adj U3 Icon 4-3 up

  • Seasonally Adjusted U3- 4.3% up from 4.1% in June
  • Unadjusted U3- 4.5% up from 4.3% in June
  • Unadjusted U6- 8.2% up from 7.7% in June
  • Labor Force Participation Rate 62.7% up from 62.6%
  • Employment 158.445 million down from 159.360 million
  • Next data release September 6th, 2024

Summary:
Total Employed decreased in July, adjusted and Unadjusted Unemployment was up.

According to the Commissioner of the U.S. Bureau of Labor Statistics:

“The unemployment rate rose to 4.3 percent in July, and nonfarm payroll employment edged up by 114,000, the U.S. Bureau of Labor Statistics reported today. Employment continued to trend up in health care, in construction, and in transportation and warehousing, while information lost jobs.”

You can read the full BLS report here.

As usual, they are talking about “Seasonally Adjusted Jobs”.

Looking at the Unadjusted Establishment Survey report we see…
Originally the BLS reported employment of 159.392 million for June
which they then adjusted to 159.360 million in August.

They are currently reporting 158.445 million jobs for July which is actually a decrease of 947,000 jobs based on their original numbers. The LFPR was up at 62.7% but the Employment/Population Ratio was down from 60.1% to 60.0%.

Bad News for the Market?

On Wednesday (prior to the Jobs data release on Friday) the stock market reacted bullishly to FED Chairman Powell’s dovish speech with anticipation of a September rate cut. But then markets reversed course on Thursday on preliminary Employment numbers. But what they failed to recognize is that the worst months (highest unemployment) are usually January, June, and July. So a bad July doesn’t really signify much.

Adding to the market’s woes, Intel dropped a bombshell with its earnings report. The company announced plans to slash jobs and suspend dividends after missing earnings targets and delivering a disappointing sales forecast. Intel shares cratered over 25% in early trading, dragging other chip stocks down with it.

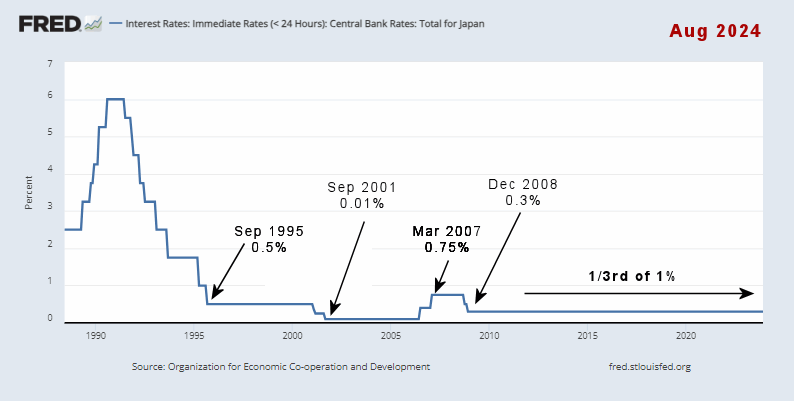
In other news, Israel is suspected of killing a Hamas leader inside Iran. So now the market also fears retaliation by Iran causing a war in the Middle East. In addition to these political problems, Japan is creating financial problems for the U.S. by raising interest rates while other countries are lowering them. As you can see from the chart below, Japan has had zero or near-zero interest rates for almost 30 years. For a brief stretch, their rates got all the way up to 3/4 of 1%! (Horror of Horrors). But since 2008 they have been below 1/3rd of 1%.

Japanese Interest Rates

This has created what is called the “Carry Trade” where people could borrow Yen almost interest-free and invest that money in higher-yielding things like Nvidia or other NASDAQ stocks or even lower-risk things like U.S. Treasury Bills. However, with the Bank of Japan (BOJ) raising rates, the free money is drying up, which creates selling pressure on the NASDAQ.

The NYSE was down -1.79% on Friday after being down -1.16% on Thursday.

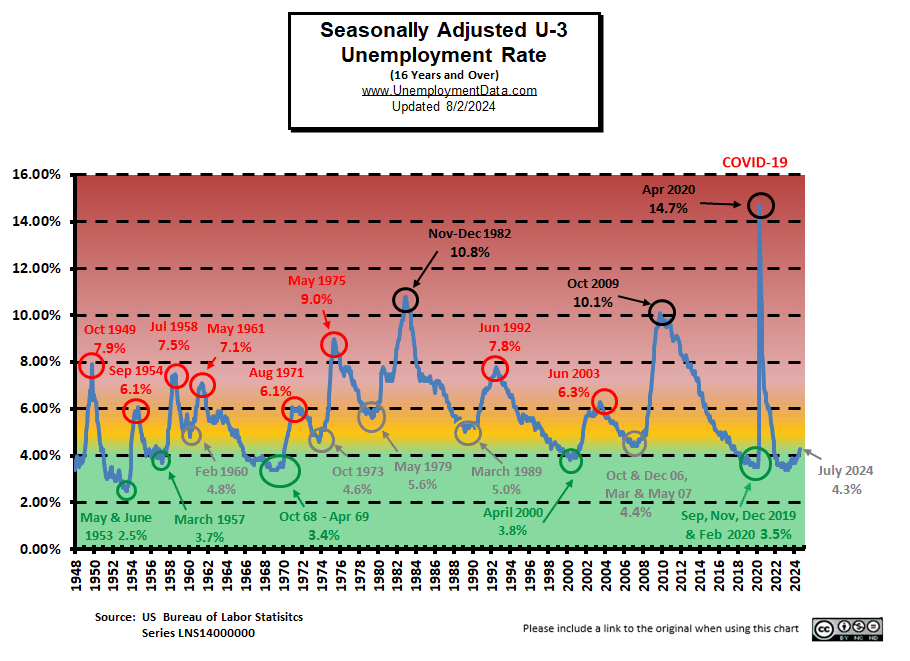
Current Unemployment Rate Chart

Seasonally Adjusted U3 Unemployment remains above the pre-COVID 2019 cyclical lows of 3.5%, but is approaching the yellow zone.

Seasonally Adj U-3 Unemployment Rate

[Read more…] about July Jobs Report Spooks Stock Market

Filed Under: BLS Tagged With: 2024, ADP, BLS, employment, Japan, July, unemployment

February Unemployment Increases

March 9, 2024 by Tim McMahon

The U.S. Bureau of Labor Statistics (BLS) released its employment / unemployment report for February on March  8th, 2024.

Employment / Unemployment 

Adj U3 Icon 3-9up


  • Seasonally Adjusted U3- 3.9% up from 3.7% in January
  • Unadjusted U3- 4.2% up from 4.1% in January
  • Unadjusted U6- 7.8% down from 8.0% in January
  • Labor Force Participation Rate 62.5% -unchanged
  • Employment 156.555 million up from 155.414 million

Summary:
Although employment rose, U3 Unemployment also rose in February in both adjusted and unadjusted rates. Unadjusted U6 fell, but adjusted U6 rose from 7.2% to 7.3%. Labor Force Participation was unchanged.

According to the Commissioner of the U.S. Bureau of Labor Statistics:

“Total nonfarm payroll employment rose by 275,000 in February, and the unemployment rate increased to 3.9 percent, the U.S. Bureau of Labor Statistics reported today. Job gains occurred in health care, in government, in food services and drinking places, in social assistance, and in transportation and warehousing…”

“Among the major worker groups, the unemployment rates for adult women (3.5 percent) and teenagers (12.5 percent) increased over the month…”

“Among the unemployed, the number of permanent job losers increased by 174,000 to 1.7 million in February.”

You can read the full BLS report here.

As usual, they are talking about “Seasonally Adjusted Jobs”.

Looking at the Unadjusted Establishment Survey report we see…
Originally the BLS reported employment of 155.626 million for January which they adjusted to 155.414 million (for a loss of 212,000 jobs).  They are currently reporting 156.555 million jobs for February which is actually a gain of  929,000 jobs compared to their original numbers. But many of these jobs came from government, and social assistance plus food services and drinking places. These are not the type of jobs that build a robust economy. And permanent job losers are increasing.

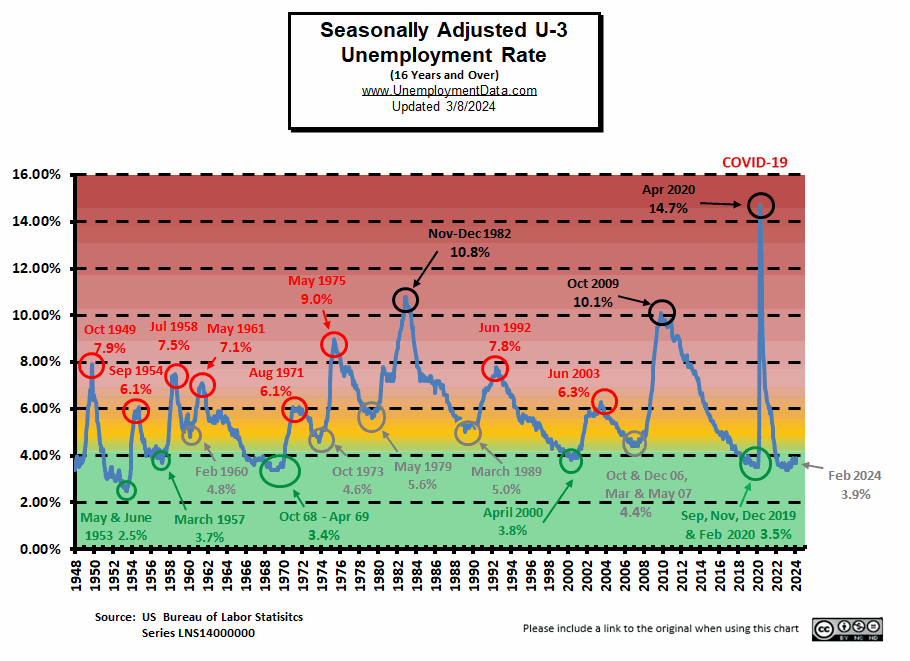
Current Unemployment Rate Chart

Seasonally Adjusted U3 Unemployment is above the pre-COVID 2019 cyclical lows of 3.5% as well as above the lows made early in 2023. Current levels are nearing the beginning of the “Yellow Zone”.

Seasonally Adj U-3 Unemployment Rate Mar 24

[Read more…] about February Unemployment Increases

Filed Under: BLS Tagged With: 2024, BLS, employment, February, unemployment

Primary Sidebar

Search Site

Sponsored:

URGENT: These Stocks Stand Poised to Benefit from President Trump's Trade Wars!

As the Trump administration moves ahead with aggressive tariff policies on key imports, the mainstream media is scrambling.

This Free Report - which you can download now - reveals the names and ticker symbols of 5 Stock Poised to Benefit Most from President Trump's Tariff Wars.

Click Here to Download Your FREE Stock Report Now.

Recent Posts

  • April 2025 Employment / Unemployment Report
  • Would More Jobs Help Social Security?
  • March 2025- Employment / Unemployment Report
  • February 2025 Jobs Report
  • January 2025 BLS Employment Report

Resources

  • Bureau of Labor Statistics Current Population Survey Monthly survey of households conducted by the Bureau of Census for BLS. It provides data on the labor force, employment, unemployment, etc.
  • Capital Professional Services Providing web design and development and Internet marketing services
  • Elliott Wave University Using the Elliott Wave Principle to improve investment performance
  • Financial Trend Forecaster Featuring Moore Inflation Predictor, NYSE Rate of Change and NASDAQ Rate of change
  • InflationData.com Inflation calculators, databases, etc.
  • Intergalactic Web Designers Web design and development services
  • Your Family Finances

Articles by Category

Articles by Date

Disclaimer

At UnemploymentData.com we are not registered investment advisors and do not provide any individualized advice. Past performance is not necessarily indicative of future performance and future accuracy and profitable results cannot be guaranteed.

Privacy & Terms of Use

Privacy Statement & Terms of Use

Do Not Sell My Information

Copyright © 2025 · News Pro on Capital Professional Services, LLC. All rights reserved · Log in