• About WordPress
    • WordPress.org
    • Documentation
    • Learn WordPress
    • Support
    • Feedback
  • Log In
  • Skip to primary navigation
  • Skip to main content
  • Skip to primary sidebar
  • Home
  • Contact us
  • Related Sites
    • InflationData.com
    • Financial Trend Forecaster
    • Your Family Finances
    • Elliott Wave University
    • Optio Money
  • About
    • Terms of Use
    • Disclaimer & Disclosure
    • Privacy Statement
  • Sitemap
    • 2009-2010 Posts
    • 2011 Posts

UnemploymentData.com

Your Source for Employment and Unemployment Data

Unemployment
  • Charts
    • Current Unemployment Rate Chart
    • Current Employment Rate (Chart and Data)
    • Current Employment vs Unemployment Chart
    • Historical Employment Data
    • Employment Population Ratio
    • Misery Index
  • Unemployment
    • Historical Unemployment Rate Tables
    • What Is U-6 Unemployment?
    • Unadjusted vs. Seasonally Adjusted U-3 Unemployment Rate
    • BLS vs. Gallup Unemployment Numbers
    • Current U-6 Unemployment Rate
    • What is the Labor Force Participation Rate?
    • What is the Real Unemployment Rate?
  • Employment
    • Current Employment Rate (Chart and Data)
    • Historical Employment Data
    • Contacting a Live Person at the State Employment Commission
      • How to Talk to a Live Person at the Virginia Unemployment Commission
      • Florida’s FLUID Unemployment Program
    • Benefits
      • Insurance
      • Retirement
    • Careers
    • Employment Costs
    • Experience
    • Government
    • Job Hunting
      • Interview
      • Resume
  • Find Articles
  • Education
    • Skills
  • General
    • Small Business
      • Outsourcing
    • Success
You are here: Home / Archives for 2022

2022

November Jobs Report

December 2, 2022 by Tim McMahon

Employment Up – Unemployment Unchanged

Current U-3 Unemployment Rate


  • Unadjusted Employment rose from 154.416 million to 154.990
  • Labor Force Participation is Down from 62.2% to 62.1%
  • Adjusted U-3 was unchanged at 3.7%
  • Unadjusted U-3 was unchanged at 3.4%
  • Unadjusted U-6 was Up from 6.3% to 6.4%


The U.S. Bureau of Labor Statistics (BLS) released its employment / unemployment report for November on December 2nd.

According to the Commissioner of the U.S. Bureau of Labor Statistics:

“Nonfarm payroll employment rose by 263,000 in November, and the unemployment rate was unchanged at 3.7 percent. Notable job gains occurred in leisure and hospitality, health care, and government. Employment declined in retail trade and in
transportation and warehousing. The November gain in nonfarm payroll employment was roughly in line with average growth over the prior 3 months (+282,000). Monthly job growth thus far in 2022 has averaged 392,000, compared with 562,000 per month in 2021.”

You can read the full BLS report here.

As usual, they are talking about “Seasonally Adjusted Jobs” from the “Household Survey” rather than looking at the results reported by actual companies in the BLS “Establishment Survey”.

Looking at the Establishment Survey report, we see…
Originally the BLS reported employment of 154.369 million for October, which they adjusted up to 154.416 million. So, 47,000 additional jobs appeared for October.

November gained an additional 574,000 jobs bringing the total up to 154.990 million.

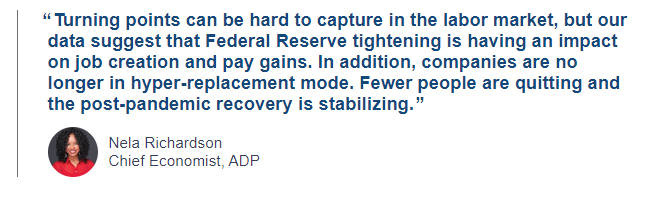
ADP® National Employment Report

According to ADP, in collaboration with Stanford Digital Economy Lab

Private employers added 127,000 jobs in November

  • Job creation slowed by the most since January 2021, led by construction and other interest rate-sensitive sectors. Consumer-facing segments – including health care and hospitality – were bright spots.

ADP Economist


ADP also lists increases by “firm size”.

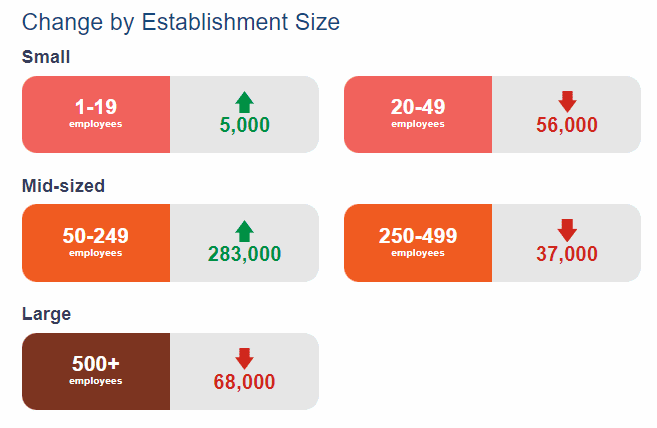
Last month (October) ADP posted these changes…

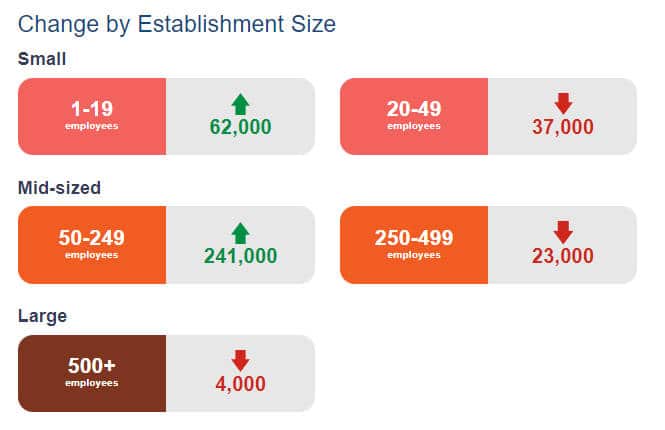
For November, the numbers definitely look worse, with virtually all the gains in mid-sized companies. People are becoming more risk-averse, so fewer small companies are being started. At some point, when jobs are scarce, starting your own business becomes the only option, so small company creation increases again. :

ADP Change by Establishment Size


November 2022 Employment by Sector

The employment “bubble chart” is a quick and easy way to see how each sector performs on a seasonally adjusted basis. The Bubble’s Size tells us the total Employment for that industry (i.e., larger bubbles mean more people are employed in that sector).

The bubble’s location on the chart tells us that there has been a change in Employment Levels over the most recent month… A bubble further to the right indicates larger job growth. A bubble’s vertical location on the chart shows the average industry salary.

In November, Leisure and Hospitality, Education, Construction, Manufacturing, and “Other” were the big gainers, while Retail was the big loser.

Average Weekly Wages Rose

$1,129.01 in November, $1,124.01 in October , $1,119.87 in September, $1116.42 in August, $1,116.54 in July, $1,106.76, in June, $1,105.47 in May and $1,102.01 in April, and $1,086.46 in December 2021. Surprisingly, Retail was the big loser, which is unusual for this time of year.  [Read more…] about November Jobs Report

Filed Under: BLS Tagged With: 2022, BLS, employment, jobs, November, unemployment

Is the Average Worker “Falling Behind”?

July 29, 2022 by Tim McMahon

Wages Up: But are Employees Better Off?

Is the Average Worker Falling Behind/The U.S. Bureau of Labor Statistics released its “Employment Cost Index” report on Friday, July 29th, for the second quarter of 2022.  According to this report, “Wages and salaries increased 5.3 percent for the 12-month period ending in June 2022… Benefit costs increased 4.8 percent over the year.”  This was on top of a 3.2 percent increase in wages for the 12-month period ending in June 2021.

In most recent years, this would be a good thing for employees, but with inflation currently running at over 9% for the year ending in June 2022, workers are actually losing 3.8% in purchasing power. (9.1% inflation minus 5.3% wage increase equals -3.8% purchasing power.) So the answer is that in 2022 workers are NOT better off.

Annual Inflation was 5.4% in June of 2021, so a 3.2% increase in wages left workers 2.2% in the hole last year as well.

The following table shows the annual increase in Total Civilian Compensation (i.e. Wages & Benefits) each June compared to the inflation rate for that year. [Read more…] about Is the Average Worker “Falling Behind”?

Filed Under: Benefits Tagged With: 2022, Average Worker, Falling Behind, Real Wages, Salary

May 2022- Unemployment by State

June 18, 2022 by Tim McMahon

On Friday, June 17th, 2022, The U.S. Bureau of Labor Statistics (BLS) released its breakdown of the unemployment rates for each individual state for May.

In the chart below, the lightest colors represent the states with the lowest unemployment rates.

Unemployment By State May 2022Looking at the above map, we can see that the lowest unemployment states run diagonally across the country, starting in Florida and ending in Montana and Idaho. Conversely, the states with the highest unemployment are located in the North East, the South West, and West Coast.  Of course, minor exceptions exist, but generally, it holds.

May 2022 Unemployment Rate by State Table (Alphabetical)

State May 2022 Unemployment Rate May 2021 Unemployment Rate 12-month change
Alabama 2.7% 3.6% -0.9%
Alaska 4.7% 6.8% -2.1%
Arizona 3.2% 5.4% -2.2%
Arkansas 3.2% 4.4% -1.2%
California 4.3% 7.9% -3.6%
Colorado 3.5% 5.8% -2.3%
Connecticut 4.2% 6.7% -2.5%
Delaware 4.5% 5.7% -1.2%
District of Columbia 5.7% 6.9% -1.2%
Florida 3.0% 4.9% -1.9%
Georgia 3.0% 4.1% -1.1%
Hawaii 4.2% 5.9% -1.7%
Idaho 2.5% 3.7% -1.2%
Illinois 4.6% 6.5% -1.9%
Indiana 2.2% 4.0% -1.8%
Iowa 2.7% 4.5% -1.8%
Kansas 2.3% 3.4% -1.1%
Kentucky 3.8% 4.7% -0.9%
Louisiana 4.0% 5.9% -1.9%
Maine 3.2% 4.9% -1.7%
Maryland 4.0% 5.7% -1.7%
Massachusetts 3.9% 5.9% -2.0%
Michigan 4.3% 6.2% -1.9%
Minnesota 2.0% 3.4% -1.4%
Mississippi 4.0% 6.0% -2.0%
Missouri 3.1% 4.5% -1.4%
Montana 2.4% 3.6% -1.2%
Nebraska 1.9% 2.5% -0.6%
Nevada 4.9% 7.8% -2.9%
New Hampshire 2.1% 3.7% -1.6%
New Jersey 3.9% 6.6% -2.7%
New Mexico 5.1% 7.2% -2.1%
New York 4.4% 7.4% -3.0%
North Carolina 3.4% 5.0% -1.6%
North Dakota 2.6% 3.8% -1.2%
Ohio 3.9% 5.4% -1.5%
Oklahoma 2.8% 4.4% -1.6%
Oregon 3.6% 5.6% -2.0%
Pennsylvania 4.6% 6.7% -2.1%
Rhode Island 2.9% 6.0% -3.1%
South Carolina 3.3% 4.1% -0.8%
South Dakota 2.3% 3.2% -0.9%
Tennessee 3.3% 4.6% -1.3%
Texas 4.2% 5.9% -1.7%
Utah 2.0% 2.8% -0.8%
Vermont 2.3% 3.6% -1.3%
Virginia 3.0% 4.1% -1.1%
Washington 3.9% 5.5% -1.6%
West Virginia 3.5% 5.4% -1.9%
Wisconsin 2.9% 4.1% -1.2%
Wyoming 3.2% 4.7% -1.5%
Puerto Rico 6.2% 8.1% -1.9%

States with the Highest Unemployment Rates

The record for the highest unemployment goes as usual to the two that are not really “states,” i.e., Puerto Rico and D.C. at 6.2% and 5.7%, respectively. Next comes New Mexico at 5.1%, Nevada at 4.9%, Alaska at 4.7%, Illinois and Pennsylvania at 4.6%, Delaware at 4.5%, New York at 4.4%, and California and Michigan tied for 10th worst place at 4.3%. [Read more…] about May 2022- Unemployment by State

Filed Under: Unemployment Tagged With: 2022, BLS, May, State, unemployment

March 2022 Unemployment Not as Low as Expected

April 2, 2022 by Tim McMahon

March 2022 Unemployment Report Doesn’t Beat Expert’s Predictions

Adj U3 Icon 3-6

  • Adjusted U-3 was Down from 3.8% to 3.6%
  • Unadjusted U-3 was Down from 4.1% to 3.8%
  • Unadjusted U-6 was Down from 7.6% to 7.1%
  • Labor Force Participation Up from 62.3% to 62.4%
  • Unadjusted Employment rose from 149.144 million to 149. 938 million

March 2022 Unemployment report:

Although MSNBC is touting it as a win, they admit that experts predicted 490,000 new jobs, but according to the BLS, we only got 431,000, so they could have just as easily spun this as a negative report. Instead, MSNBC gushes about the “new jobs” but then goes on to say, “the U.S. economy has now gained back roughly 93 percent of its pandemic job losses”.

As we’ve consistently pointed out, we are still below peak pre-covid employment levels. Although MSNBC says, “So far in 2022, the economy has created 1.69 million jobs”… we’re still below December 2021 levels… hmm I guess it depends on how you look at it. Unlike what you’d expect from a pandemic… since Covid started the U.S. population is up by 3.8 million, so we need to have more jobs just to be equal. In other words, population inflation does to jobs what monetary inflation does to the cost of living.

According to the Commissioner of the U.S. Bureau of Labor Statistics:

“Nonfarm payroll employment rose by 431,000 in March, and the unemployment rate declined by 0.2 percentage points to 3.6 percent. Notable job gains continued in leisure and hospitality, professional and business services, retail trade, and manufacturing.

Job growth averaged 562,000 per month in the first quarter of 2022, the same as the average monthly gain for 2021. However, Employment is down by 1.6 million, or 1.0 percent, from its February 2020 level before the coronavirus (COVID-19) pandemic.”

As usual, they are talking about “Seasonally Adjusted Jobs” from the “Current Population Survey (CPS)” rather than looking at the results reported by actual companies in the BLS “Current Employment Statistics survey (CES)”.

But looking at the CES report, we see…
Initially, the BLS reported Employment of 148.964 million for February, which they adjusted to 149.144 million. So 18,000 jobs appeared for February. They are saying 149.938 million jobs for March, which is an increase of 974,000 jobs based on their original estimates or an increase of 794,000 based on their updated numbers.

[Read more…] about March 2022 Unemployment Not as Low as Expected

Filed Under: BLS Tagged With: 2022, BLS, March, unemployment

February Employment / Unemployment Report

March 4, 2022 by Tim McMahon

February 2022 Unemployment report from the Bureau of Labor Statistics (BLS)

Seasonally Adjusted Unemployment

  • Adjusted U-3 was Down from 4.0% to 3.8%
  • Unadjusted U-3 was Down from 4.4% to 4.1%
  • Unadjusted U-6 was Down from 7.9% to 7.6%
  • Labor Force Participation Up from 62.2% 62.3%
  • Unadjusted Employment rose from 147. 510 million to 148. 964 million

February 2022 Unemployment report:

AP says: Strong Job Growth Points to COVID’s Fading Grip on Economy “Employers added a robust 678,000 jobs in February, the largest monthly total since July, the Labor Department reported Friday.”

CNBC says: U.S. unemployment rate falls in February, but ticks up for Black women “The unemployment rate for Black women ticked up to 6.1% in February from 5.8% in the previous month.”

According to the Commissioner of the U.S. Bureau of Labor Statistics:

“Nonfarm payroll employment rose by 678,000 in February, and the unemployment rate edged down to 3.8 percent. Employment growth was widespread, led by gains in leisure and hospitality, professional and business services, health care, and construction. Employment is down by 2.1 million, or 1.4 percent, from its level before the onset of the coronavirus (COVID-19) pandemic in February 2020.

In February, employment growth continued in leisure and hospitality (+179,000) with job gains in food services and drinking places (+124,000) and accommodation (+28,000). “

As usual, they are talking about “Seasonally Adjusted Jobs” from the “Current Population Survey (CPS)” rather than looking at the results reported by actual companies in their “Current Employment Statistics survey (CES)”

But looking at the CES report we see…
Originally the BLS reported employment of 147.525 million for January which they adjusted to 147.510 million. So 15,000 jobs disappeared for January. But they are reporting 148.964 million jobs for February which is actually an increase of 1,439,000 jobs based on their original estimates or an increase of 1,454,000 based on their updated numbers. 

[Read more…] about February Employment / Unemployment Report

Filed Under: BLS Tagged With: 2022, BLS, Charts, employment, February, unemployment

Primary Sidebar

Search Site

Sponsored:

URGENT: These Stocks Stand Poised to Benefit from President Trump's Trade Wars!

As the Trump administration moves ahead with aggressive tariff policies on key imports, the mainstream media is scrambling.

This Free Report - which you can download now - reveals the names and ticker symbols of 5 Stock Poised to Benefit Most from President Trump's Tariff Wars.

Click Here to Download Your FREE Stock Report Now.

Recent Posts

  • April 2025 Employment / Unemployment Report
  • Would More Jobs Help Social Security?
  • March 2025- Employment / Unemployment Report
  • February 2025 Jobs Report
  • January 2025 BLS Employment Report

Resources

  • Bureau of Labor Statistics Current Population Survey Monthly survey of households conducted by the Bureau of Census for BLS. It provides data on the labor force, employment, unemployment, etc.
  • Capital Professional Services Providing web design and development and Internet marketing services
  • Elliott Wave University Using the Elliott Wave Principle to improve investment performance
  • Financial Trend Forecaster Featuring Moore Inflation Predictor, NYSE Rate of Change and NASDAQ Rate of change
  • InflationData.com Inflation calculators, databases, etc.
  • Intergalactic Web Designers Web design and development services
  • Your Family Finances

Articles by Category

Articles by Date

Disclaimer

At UnemploymentData.com we are not registered investment advisors and do not provide any individualized advice. Past performance is not necessarily indicative of future performance and future accuracy and profitable results cannot be guaranteed.

Privacy & Terms of Use

Privacy Statement & Terms of Use

Do Not Sell My Information

Copyright © 2025 · News Pro on Capital Professional Services, LLC. All rights reserved · Log in