• About WordPress
    • WordPress.org
    • Documentation
    • Learn WordPress
    • Support
    • Feedback
  • Log In
  • Skip to primary navigation
  • Skip to main content
  • Skip to primary sidebar
  • Home
  • Contact us
  • Related Sites
    • InflationData.com
    • Financial Trend Forecaster
    • Your Family Finances
    • Elliott Wave University
    • Optio Money
  • About
    • Terms of Use
    • Disclaimer & Disclosure
    • Privacy Statement
  • Sitemap
    • 2009-2010 Posts
    • 2011 Posts

UnemploymentData.com

Your Source for Employment and Unemployment Data

Unemployment
  • Charts
    • Current Unemployment Rate Chart
    • Current Employment Rate (Chart and Data)
    • Current Employment vs Unemployment Chart
    • Historical Employment Data
    • Employment Population Ratio
    • Misery Index
  • Unemployment
    • Historical Unemployment Rate Tables
    • What Is U-6 Unemployment?
    • Unadjusted vs. Seasonally Adjusted U-3 Unemployment Rate
    • BLS vs. Gallup Unemployment Numbers
    • Current U-6 Unemployment Rate
    • What is the Labor Force Participation Rate?
    • What is the Real Unemployment Rate?
  • Employment
    • Current Employment Rate (Chart and Data)
    • Historical Employment Data
    • Contacting a Live Person at the State Employment Commission
      • How to Talk to a Live Person at the Virginia Unemployment Commission
      • Florida’s FLUID Unemployment Program
    • Benefits
      • Insurance
      • Retirement
    • Careers
    • Employment Costs
    • Experience
    • Government
    • Job Hunting
      • Interview
      • Resume
  • Find Articles
  • Education
    • Skills
  • General
    • Small Business
      • Outsourcing
    • Success
You are here: Home / Archives for 2017

2017

October Unemployment Rate Down Again

November 4, 2017 by Tim McMahon

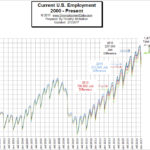
On Friday November 3rd the U.S. Bureau of Labor Statistics (BLS) released their monthly employment survey results for the month of October.

According to the BLS, the current “Seasonally Adjusted” Unemployment Rate for October is 4.1% DOWN from 4.2% in September and 4.4% in August. Seasonally Adjusted U-3 unemployment was 4.8% in January and 4.9% a year ago (October 2016).

The current “Unadjusted” rate is 3.9% down from 4.1% in September and 4.5% in August. Unadjusted U-3 was 5.1% in January and 4.7%  a year ago (October 2016).

See: Current Unemployment Rate Chart for more info.

Seasonally Adj U-3 Unemployment Rate

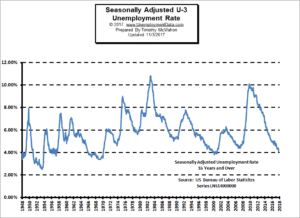
Seasonal adjustment provides something like a moving average leveling out the bumps due to normal seasonal variations. See: Unadjusted vs. Seasonally Adjusted Unemployment Rate for more information about Seasonal Adjustment.

According to the BLS Commissioner’s report for this month:

[Read more…] about October Unemployment Rate Down Again

Filed Under: BLS Tagged With: 2017, BLS, Bureau of Labor Statistics, Current Employment Data, Employment Data, Labor Force Participation Rate, LFPR, October Unemployment, unemployment rate

January Unemployment

February 3, 2017 by Tim McMahon

Unemployment RateThe U.S. Bureau of Labor Statistics (BLS) released the newest unemployment data for January 2017 on Friday, February 3rd. According to the BLS, the current “Seasonally Adjusted” Unemployment Rate is 4.8% up from 4.7% in December and 4.6% in November but still below the 4.9% in October.

The current “Unadjusted” rate is 5.1% up from 4.5% in December and 4.4% in November. Typically unadjusted unemployment rates jump in January for “Seasonal” reasons which is why we see a large jump in the unadjusted rates but a much smaller jump in the seasonally adjusted unemployment rate. See Current Unemployment Rate for more info.


U.S. Employment ChartThe number of Unadjusted jobs reported for January was [Read more…] about January Unemployment

Filed Under: Unemployment Tagged With: 2017, employment, January, unemployment

Primary Sidebar

Search Site

Sponsored:

URGENT: These Stocks Stand Poised to Benefit from President Trump's Trade Wars!

As the Trump administration moves ahead with aggressive tariff policies on key imports, the mainstream media is scrambling.

This Free Report - which you can download now - reveals the names and ticker symbols of 5 Stock Poised to Benefit Most from President Trump's Tariff Wars.

Click Here to Download Your FREE Stock Report Now.

Recent Posts

  • April 2025 Employment / Unemployment Report
  • Would More Jobs Help Social Security?
  • March 2025- Employment / Unemployment Report
  • February 2025 Jobs Report
  • January 2025 BLS Employment Report

Resources

  • Bureau of Labor Statistics Current Population Survey Monthly survey of households conducted by the Bureau of Census for BLS. It provides data on the labor force, employment, unemployment, etc.
  • Capital Professional Services Providing web design and development and Internet marketing services
  • Elliott Wave University Using the Elliott Wave Principle to improve investment performance
  • Financial Trend Forecaster Featuring Moore Inflation Predictor, NYSE Rate of Change and NASDAQ Rate of change
  • InflationData.com Inflation calculators, databases, etc.
  • Intergalactic Web Designers Web design and development services
  • Your Family Finances

Articles by Category

Articles by Date

Disclaimer

At UnemploymentData.com we are not registered investment advisors and do not provide any individualized advice. Past performance is not necessarily indicative of future performance and future accuracy and profitable results cannot be guaranteed.

Privacy & Terms of Use

Privacy Statement & Terms of Use

Do Not Sell My Information

Copyright © 2025 · News Pro on Capital Professional Services, LLC. All rights reserved · Log in