What Causes a State to Have a Lower Unemployment Rate?
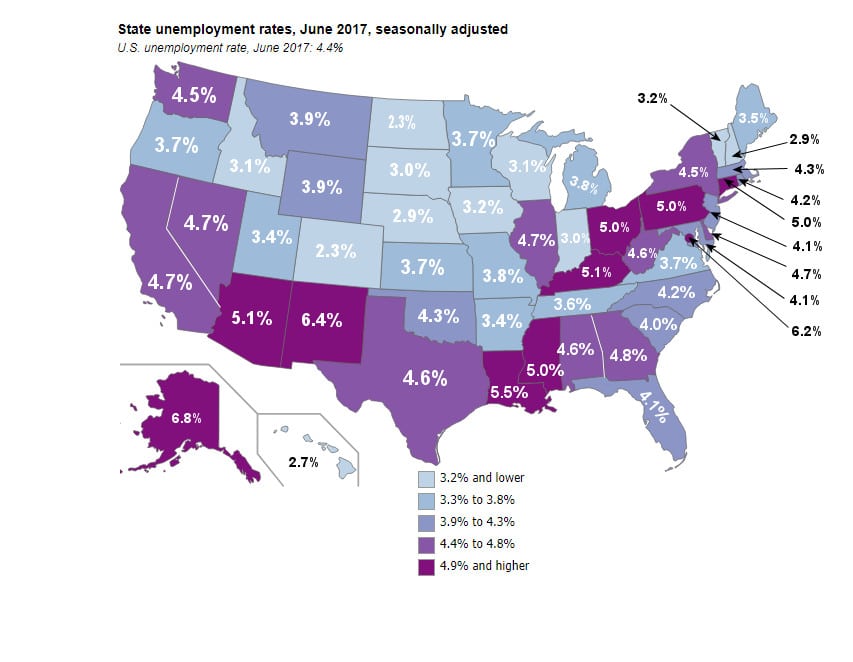
Nationwide according to the U.S. Bureau of Labor Statistics the Seasonally Adjusted Unemployment rate is 4.4% but when you look a bit closer you will see that there is quite a bit of variation by state.
States with the Highest Unemployment Rates
Alaska had the highest jobless rate, at 6.8%, followed by New Mexico, at 6.4% and Washington D.C. at 6.2%.

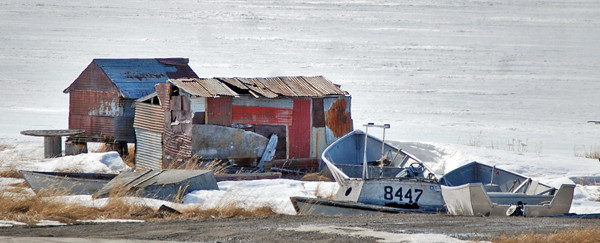
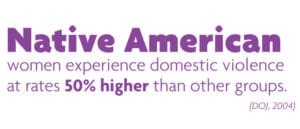
Some of Alaska’s problems are understandable. Alaska has high transportation costs, little industry, a massively spread out population and massive poverty. As a matter of fact among Alaskan Native Americans the poverty rate is double the U.S. Average. The alcoholism mortality rate is 6 times higher than the national average. Obesity and diabetes rates are much higher and injury related deaths are much more frequent. But the situation among Native American tribes in Alaska is actually much worse than the statistics show.

Opposite Conditions, Similar Rates
Looking at the various unemployment rates in the states, Alaska’s problems seem obvious but upon closer examination one begins to wonder. The third highest unemployment rate is Washington D.C. which is almost a polar opposite to all the factors in Alaska. D.C. is small, densely populated, has unlimited infrastructure, no oil reserves but it can draw funds from the entire country and it still has a surprisingly high unemployment rate at 6.2%. So two polar opposite places have similar unemployment rates.

Similar Conditions, Different Rates
So let’s look at it the other way around and look at two very similar states that have different unemployment rates. How about Vermont and New Hampshire. You’d think there wouldn’t be much difference between them. Both are small North Eastern states with about the same population density. But Vermont has a 3.2% unemployment rate and New Hampshire has 2.9%. Not much difference you say? But 0.3% is a 10% differential when you are talking about 3%. So why is there any difference at all? How about Rhode Island vs. Connecticut? At 4.2% and 5.0% respectively. That is a 19% differential which is a fairly significant difference. What causes the difference? The only discernable difference I can see is the type of regulations imposed by the state government. Otherwise what difference would an arbitrary line on a map make?
Let’s look at the two lowest Unemployment states and see if we can discover their secret to success.
Lowest Unemployment Rates
In June 2017, Colorado and North Dakota had the lowest unemployment rates among the states, at 2.3 percent each.
North Dakota
Interestingly, North Dakota shares many similarities with Alaska, both are remote and sparsely populated and both have a wealth of oil reserves. But that is where the similarity ends. With 90 percent of North Dakota’s land devoted to farming and one-fifth of the population employed in agriculture North Dakota’s farmers have historically had a strong work ethic. Currently, North Dakota has the lowest unemployment rate in the country and according to U.S. News and World Reports, “North Dakota also ranks highly in the roads, energy infrastructure – and even internet service – that it provides for just over three-quarters of a million residents. Its highly ranked higher education, with among the nation’s most affordable tuition, has helped the citizenry reach a high level of attainment of college degrees. All measures considered, the state ranks No. 4 overall… Recently elected North Dakota Gov. Doug Burgum attributes the state’s business sense to a long line of governors who came from the business world – in his case, the software industry.”
More than 80,000 jobs were created in North Dakota from 2011 from 2015.
Colorado
You might think that Pot is the secret to Colorado’s success. Last year, the state did $1.3 billion of in-state marijuana sales. But with a $323.692 billion in state Gross Domestic Product (GDP) Pot sales are just 4/10ths of 1% of GDP.
According to Colorado Gov. John Hickenlooper , “Colorado’s booming economy is the result of efforts to make the Centennial State more pro-business with one of the lowest business income tax levels at just a little over 4.6 percent.We worked very hard to reduce red tape, to try to attract young entrepreneurs… We have over 2,000 companies that do either renewable energy or clean tech… more than 60, 000 employees work in the clean energy sector.”
So both North Dakota and Colorado’s Governor’s believe that their state’s success is a direct result of their pro-business policies.
Does Political Leaning Correlate With Unemployment Rates?
Here we have 2016 Presidential Election Results and Current Unemployment Rates. We find that the states that voted Democrat tend to have a higher unemployment rate although not in all cases. Notably Alaska is an outlier, as is Hawaii with a 2.7% unemployment rate primarily due to the tourism industry. We can’t jump to conclusions of cause however. Does Democratic policies cause higher unemployment or do unemployed people tend to vote Democrat… or both?
Also we need to consider previous leanings, especially concerning state election results, since previous state government policies would have more effect on the condition of the state economy, than the results of the most recent Presidential election.
| 2016 Presidential Election Results | Unemployment | |||||
| STATE | DEM. | REP. | OTHER | June 2017 Unemployment Rate | Average Unemployment Rate | |
| ————– | —- | —- | —— | ——– | —— | |
| D.C. | 91% | 4% | 2% | 6.2% | 4.4% | |
| Calif. | 62% | 32% | 3% | 4.7% | ||
| Hawaii | 62% | 30% | 4% | 2.7% | ||
| Md. | 60% | 34% | 3% | 4.1% | ||
| Mass. | 60% | 33% | 4% | 4.3% | ||
| N.Y. | 59% | 37% | 2% | 4.5% | ||
| Vt. | 57% | 30% | 7% | 3.2% | ||
| Conn. | 55% | 41% | 3% | 5.0% | ||
| Ill. | 55% | 38% | 4% | 4.7% | ||
| N.J. | 55% | 41% | 2% | 4.1% | ||
| R.I. | 54% | 39% | 3% | 4.2% | ||
| Del. | 53% | 42% | 3% | 4.7% | ||
| Wash. | 53% | 37% | 5% | 4.5% | ||
| Ore. | 50% | 39% | 5% | 3.7% | 4.2% | |
| Va. | 50% | 44% | 3% | 3.7% | ||
| Me. | 48% | 45% | 5% | 3.5% | ||
| Colo. | 48% | 43% | 5% | 2.3% | ||
| N.M. | 48% | 40% | 9% | 6.4% | ||
| Nev. | 48% | 46% | 3% | 4.7% | ||
| N.H. | 47% | 47% | 4% | 2.9% | ||
| Minn. | 46% | 45% | 4% | 3.7% | ||
| Mich. | 47% | 47% | 4% | 3.8% | ||
| Wis. | 47% | 47% | 4% | 3.1% | ||
| Pa. | 48% | 48% | 2% | 5.0% | ||
| Ariz. | 45% | 48% | 4% | 5.1% | ||
| Fla. | 47% | 49% | 2% | 4.1% | ||
| N.C. | 46% | 50% | 3% | 4.2% | ||
| Ga. | 45% | 50% | 3% | 4.8% | ||
| Ohio | 43% | 51% | 3% | 5.0% | ||
| Iowa | 42% | 51% | 4% | 3.2% | ||
| Alaska | 37% | 51% | 6% | 6.8% | ||
| Tex. | 43% | 52% | 3% | 4.6% | ||
| S.C. | 41% | 55% | 2% | 4.0% | 3.8% | |
| Mo. | 38% | 56% | 3% | 3.8% | ||
| Kan. | 36% | 56% | 5% | 3.7% | ||
| Mont. | 35% | 56% | 6% | 3.9% | ||
| Ind. | 38% | 57% | 5% | 3.0% | ||
| Miss. | 40% | 58% | 1% | 5.0% | ||
| La. | 38% | 58% | 2% | 5.5% | ||
| Neb. | 34% | 59% | 5% | 2.9% | ||
| Idaho | 28% | 59% | 7% | 3.1% | ||
| Tenn. | 35% | 61% | 3% | 3.6% | ||
| Ark. | 34% | 61% | 3% | 3.4% | ||
| Ala. | 34% | 62% | 2% | 4.6% | ||
| S.D. | 32% | 62% | 6% | 3.0% | ||
| Ky. | 33% | 63% | 3% | 5.1% | ||
| Utah | 27% | 45% | 21% | 3.4% | ||
| N.D. | 27% | 63% | 6% | 2.3% | ||
| Okla. | 29% | 65% | 6% | 4.3% | ||
| W.Va. | 26% | 68% | 3% | 4.6% | ||
| Wyo. | 22% | 68% | 5% | 3.9% | ||
Note: States with Blue numbers voted Democrat, States with Red numbers voted Republican and States with Purple numbers may have voted either way but were basically evenly split.
Sources:
Election Results Courtesy of New York Times
State Unemployment Rates courtesy of U.S. Bureau of Labor Statistics.
You might also like:
- Employers Compensation Costs Increase
- 45 Ways You Can Find Success Without a Degree
- 5 Ways You Can Build Your Professional Skillset with Certifications
- Only 25% Intend to Retire at Retirement Age
- Tradesmen Needed: Essential Services Make Good Job Prospects
- Managing Your Money and Your Expectations For Retirement
