
![]() The U.S. Bureau of Labor Statistics (BLS) released their monthly unemployment survey results for March on April 5th and it has the market pundits celebrating. Last month they worried over the mere 20,000 jobs created after projections were for 175,000 jobs.
The U.S. Bureau of Labor Statistics (BLS) released their monthly unemployment survey results for March on April 5th and it has the market pundits celebrating. Last month they worried over the mere 20,000 jobs created after projections were for 175,000 jobs.
This month once again the projections were for 175,000 new jobs but the BLS says there were 195,000 new jobs so the market is happy.
As we said in the Current Unemployment Chart commentary:
According to the BLS Commissioner’s report for this month:
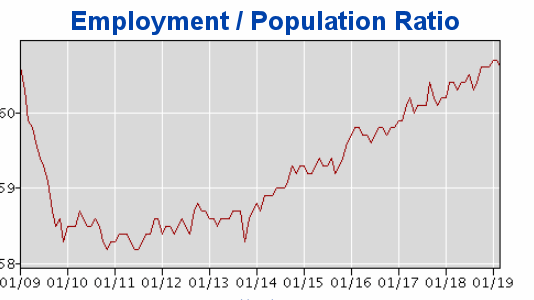
“Total nonfarm payroll employment increased by 196,000 in March, and the unemployment rate was unchanged at 3.8 percent, the U.S. Bureau of Labor Statistics reported today. Notable job gains occurred in health care and in professional and technical services… The employment-population ratio was 60.6 percent in March and has been either 60.6 percent or 60.7 percent since October 2018… Health care added 49,000 jobs in March and 398,000 over the past 12 months… Employment in professional and technical services grew by 34,000 in March and 311,000 over the past 12 months. “
Key factors in the report were the unemployment rate for Women dropped to another mega low of 3.3% from 3.6% last month.
Black unemployment was 6.7% and Hispanic Unemployment was 4.7%.
Last month the media was unpleasantly surprised by the Jobs report being lower than the consensus and this month they were pleasantly surprised by the higher than expected jobs. “Economists surveyed by The Wall Street Journal expected that the jobs report would show solid growth by 175,000 jobs” but instead the report showed 196,000 “Seasonally Adjusted” jobs created, “making March the 102nd straight month of job growth”. In unadjusted terms February had 149.867 million jobs while March had 149.133 million jobs for an actual increase of 724,000 jobs.
Key March Employment and Unemployment Numbers
- Adjusted U-3 Unemployment- 3.8% unchanged from February but down from 4.0% in January, and 3.9% in December.
- Unadjusted U-3 Unemployment- 3.9% down from 4.1% in February, and 4.4% in January, but above the 3.7% in December.
- Unadjusted U-6 Unemployment- 7.5% down from 7.7% in February and 8.8% in January, 7.5% in December.
- Unadjusted Employment (Establishment Survey)- 149.867 up from 149.143 in February and 148.295 million in January.
- February Labor Force Participation Rate- 63.0% down from the peak of 63.2% in February, and 63.1% in December.
Current Seasonally Adjusted U-3 levels are still hovering around the lows of 2000. Prior to that we have to go all the way back to 1969 to see better unemployment levels than we have currently. Current levels are rising a bit from a cyclical low not seen since 1969. Also noteworthy is that levels do not stay this low for very long. The longest low like this was the seven month period from October 1968 through April 1969. Prior to 1969 was a one month low of 3.7% in 1957. On the plus side, the current drop from 4.0% back to 3.8% brings us very close to the 3.7% lows of September-November 2018.
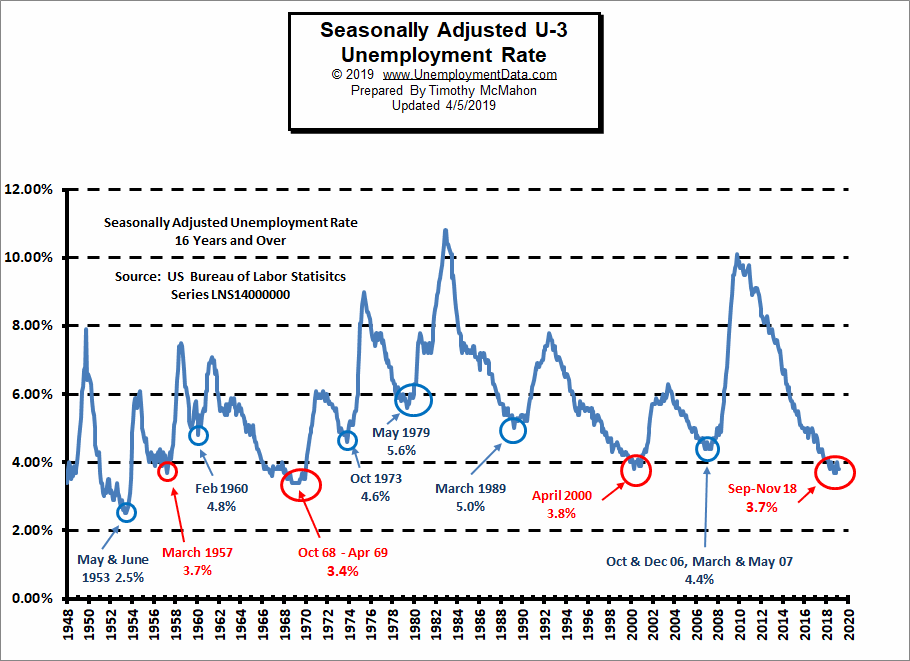
See Current Unemployment Chart for more info.
Previous Record Low Unemployment (Seasonally Adjusted U-3)
(4% or below in Blue)
| Jan | Feb | Mar | Apr | May | Jun | Jul | Aug | Sep | Oct | Nov | Dec | |
| 1950 | 6.5% | 6.4% | 6.3% | 5.8% | 5.5% | 5.4% | 5.0% | 4.5% | 4.4% | 4.2% | 4.2% | 4.3% |
| 1951 | 3.7% | 3.4% | 3.4% | 3.1% | 3.0% | 3.2% | 3.1% | 3.1% | 3.3% | 3.5% | 3.5% | 3.1% |
| 1952 | 3.2% | 3.1% | 2.9% | 2.9% | 3.0% | 3.0% | 3.2% | 3.4% | 3.1% | 3.0% | 2.8% | 2.7% |
| 1953 | 2.9% | 2.6% | 2.6% | 2.7% | 2.5% | 2.5% | 2.6% | 2.7% | 2.9% | 3.1% | 3.5% | 4.5% |
| 1954 | 4.9% | 5.2% | 5.7% | 5.9% | 5.9% | 5.6% | 5.8% | 6.0% | 6.1% | 5.7% | 5.3% | 5.0% |
| 1955 | 4.9% | 4.7% | 4.6% | 4.7% | 4.3% | 4.2% | 4.0% | 4.2% | 4.1% | 4.3% | 4.2% | 4.2% |
| 1956 | 4.0% | 3.9% | 4.2% | 4.0% | 4.3% | 4.3% | 4.4% | 4.1% | 3.9% | 3.9% | 4.3% | 4.2% |
| 1957 | 4.2% | 3.9% | 3.7% | 3.9% | 4.1% | 4.3% | 4.2% | 4.1% | 4.4% | 4.5% | 5.1% | 5.2% |
| 1958 | 5.8% | 6.4% | 6.7% | 7.4% | 7.4% | 7.3% | 7.5% | 7.4% | 7.1% | 6.7% | 6.2% | 6.2% |
| … | … | … | … | … | … | … | … | … | … | … | … | … |
| 1965 | 4.9% | 5.1% | 4.7% | 4.8% | 4.6% | 4.6% | 4.4% | 4.4% | 4.3% | 4.2% | 4.1% | 4.0% |
| 1966 | 4.0% | 3.8% | 3.8% | 3.8% | 3.9% | 3.8% | 3.8% | 3.8% | 3.7% | 3.7% | 3.6% | 3.8% |
| 1967 | 3.9% | 3.8% | 3.8% | 3.8% | 3.8% | 3.9% | 3.8% | 3.8% | 3.8% | 4.0% | 3.9% | 3.8% |
| 1968 | 3.7% | 3.8% | 3.7% | 3.5% | 3.5% | 3.7% | 3.7% | 3.5% | 3.4% | 3.4% | 3.4% | 3.4% |
| 1969 | 3.4% | 3.4% | 3.4% | 3.4% | 3.4% | 3.5% | 3.5% | 3.5% | 3.7% | 3.7% | 3.5% | 3.5% |
| 1970 | 3.9% | 4.2% | 4.4% | 4.6% | 4.8% | 4.9% | 5.0% | 5.1% | 5.4% | 5.5% | 5.9% | 6.1% |
| … | … | … | … | … | … | … | … | … | … | … | … | … |
| 1999 | 4.3% | 4.4% | 4.2% | 4.3% | 4.2% | 4.3% | 4.3% | 4.2% | 4.2% | 4.1% | 4.1% | 4.0% |
| 2000 | 4.0% | 4.1% | 4.0% | 3.8% | 4.0% | 4.0% | 4.0% | 4.1% | 3.9% | 3.9% | 3.9% | 3.9% |
| 2001 | 4.2% | 4.2% | 4.3% | 4.4% | 4.3% | 4.5% | 4.6% | 4.9% | 5.0% | 5.3% | 5.5% | 5.7% |
| … | … | … | … | … | … | … | … | … | … | … | … | … |
| 2018 | 4.1% | 4.1% | 4.1% | 3.9% | 3.8% | 4.0% | 3.9% | 3.9% | 3.7% | 3.7% | 3.7% | 3.9% |
| 2019 | 4.0% | 3.8% | 3.8% |
Employment
Historically employment is closely tied to recessions and that is no accident. One of the primary factors in calculating whether the economy is officially in a recession is an increase in the unemployment rate. The chart below provides the Historical Employment Data overlaid on blue bars showing periods of official recessions.
In March 2019 there were 149.867 million people employed up from 147.368 million in March 2018. As we can from the chart the largest loss in numbers of jobs occurred during the “Great Recession” of 2008 and it took several years before employment levels once again reached 2007 levels.
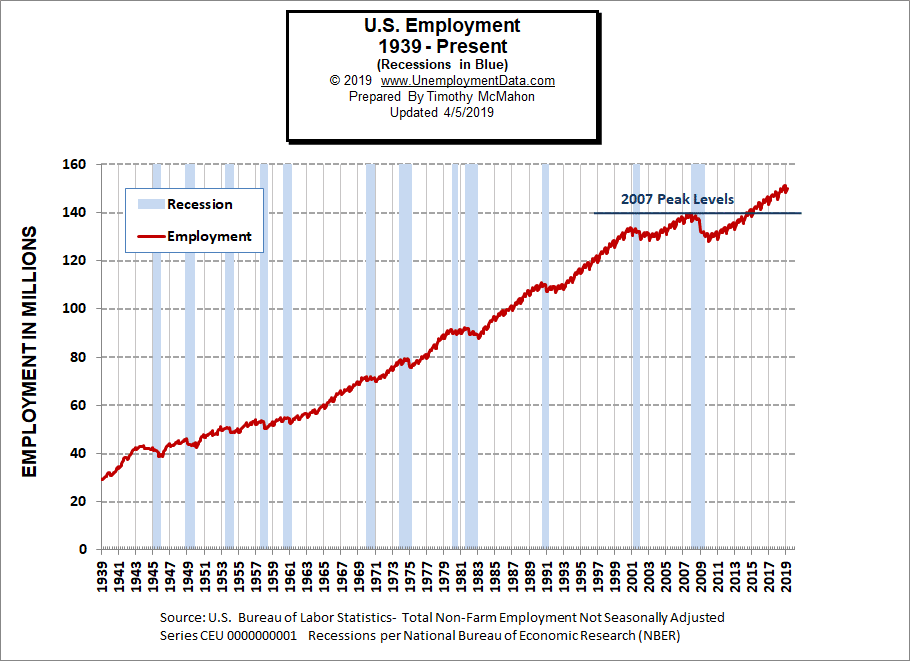
As we can see from the table below from November 2007 to January 2008 there were over 3 million jobs lost but that actually wasn’t all that surprising typically January suffers from a reduction in Seasonal workers. Even good years like 2005-2006 saw a reduction of 3 million workers and January 2008 employment levels were still above January 2007 levels. But by January 2009 year over year losses exceeded 4 million. By 2010 the economy had lost another 4.2 million. 2011 showed almost a million jobs improvement but the economy was still on shaky ground. It wasn’t until January 2014 that the economy reached January 2007 levels and January 2015 exceeded January 2008 levels.
| Date | Employment in Millions |
| January 2007 | 135.335 |
| November 2007 (Peak) | 139.510 |
| January 2008 | 136.268 |
| January 2009 | 132.042 |
| January 2010 | 127.820 |
| January 2011 | 128.778 |
| January 2012 | 131.113 |
| January 2013 | 133.081 |
| January 2014 | 135.488 |
| January 2015 | 138.511 |
| January 2016 | 141.088 |
| January 2017 | 143.393 |
| January 2018 | 145.428 |
| January 2019 | 148.295 |
See Historical Employment and Current Employment for more info.
Employment by Sector
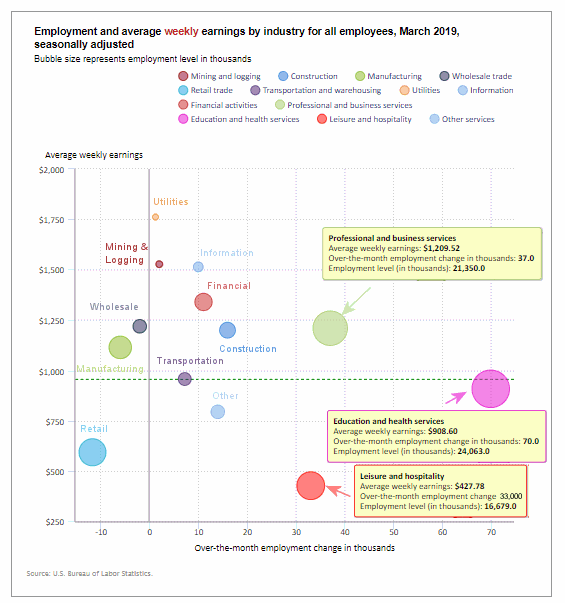
The employment “bubble chart” gives us a good representation of how each sector of the economy is doing (employment wise). As we can see from the chart below there are only three sectors to the left of the vertical zero line this month, meaning that only three sectors lost employees. The biggest loser (as alluded to above) is retail with a loss of -11,700 jobs. Other losers are Manufacturing and Wholesale at -6,000, and -2,000 respectively.
The biggest gainer (furthest to the right on the chart) was Education and Health Services adding 70,000 jobs this is a moderately paid sector earning $908.60 on average per week. Leisure and Hospitality added 33,000 low paying jobs with an average weekly earning of $427.78. Professional and Business Services added 37,000 well paid jobs at an average of $1,209.52/wk.
Average weekly wages continued to rise from $940.84 in November to $955.65 in March.
(See the table below for average weekly earnings and other details.)
How to read this chart:
Bubbles location on the chart tell us two things:
- Change in Employment Levels over the most recent month.
- Average Weekly earnings.
- The further to the right the bubble the larger the increase in the number of jobs.
- The higher up on the chart the larger the average salary.
Bubble Size tells us:
- Total Employment for the sector.
- Larger bubbles mean more people are employed in that sector.
Employment and Average Weekly Earnings by Industry
March 2019, Seasonally Adjusted
| Industry | Monthly Increase | Average Weekly Earnings | Employment Level |
| Total Private Employment | 182,000 | $955.65 | 128,297,000 |
| Mining and Logging | 2,000 | $1,527.37 | 757,000 |
| Construction | 16,000 | $1,199.73 | 7,447,000 |
| Manufacturing | -6,000 | $1,114.37 | 12,821,000 |
| Wholesale trade | -2,000 | $1,219.14 | 5,917,300 |
| Retail trade | -11,700 | $593.64 | 15,798,400 |
| Transportation and Warehousing | 7,300 | $957.20 | 5,544,800 |
| Utilities | 1,300 | $1,761.43 | 555,100 |
| Information | 10,000 | $1,514.07 | 2,821,000 |
| Financial Activities | 11,000 | $1,339.86 | 8,638,000 |
| Professional and Business Services | 37,000 | $1,209.52 | 21,350,000 |
| Education and Health Services | 70,000 | $908.60 | 24,063,000 |
| Leisure and Hospitality | 33,000 | $427.78 | 16,679,000 |
| Other Services | 14,000 | $794.56 | 5,905,000 |
The Differential between U3 and U6
The differential between the unadjusted U3 and U6 (reached by subtracting U3 from U6) bottomed at 3.5% during late 2018 but then it spiked up culminating in a 4.4% differential in January. But in February it fell back to 3.6% where it remained in March.
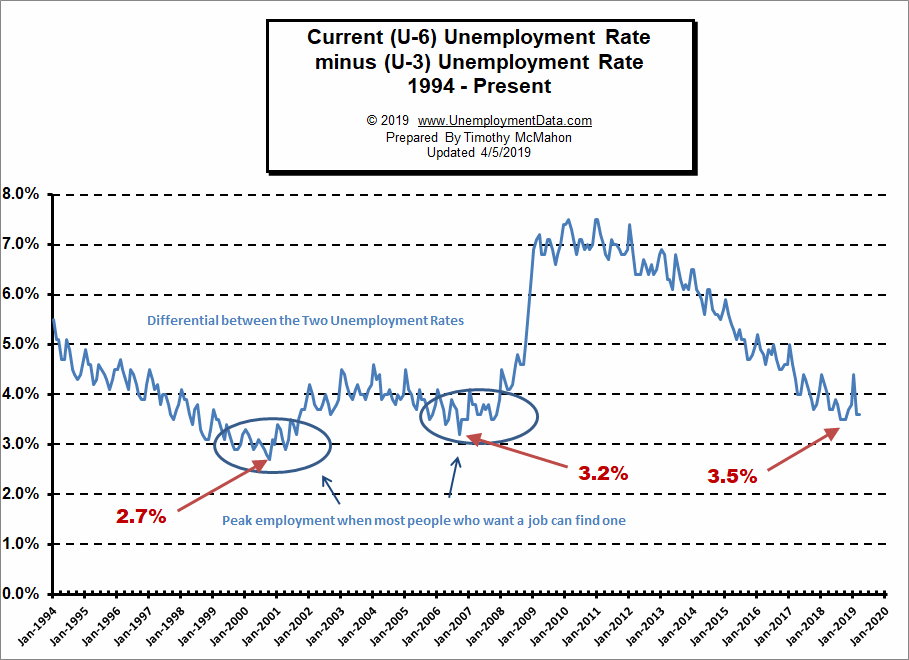
See Current U-6 Unemployment Rate for more info.
U-6 Unemployment
 Current U-6 Unadjusted Unemployment Rate for March fell to 7.5% from February’s 7.7%.
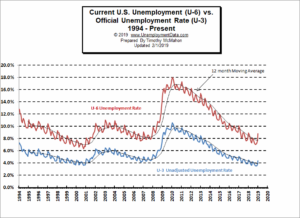 Current U-6 Unadjusted Unemployment Rate for March fell to 7.5% from February’s 7.7%.
January 2019 was: 8.8% and it was 7.5% in December 2018.
See Unadjusted U-6 unemployment for more info.
Labor Force Participation Rate
The Labor Force Participation Rate (LFPR) for March was 63.0%, down from it’s January and February peak at 63.2%. (Higher is better). A falling LFPR makes unemployment numbers look better than they actually are because people are dropping out of the labor force so they are no longer counted as “unemployed”. A climbing LFPR means people are re-entering the Labor Force (so they are more optimistic) but they are temporarily unemployed until they find a job making the unemployment numbers look worse than they actually are.
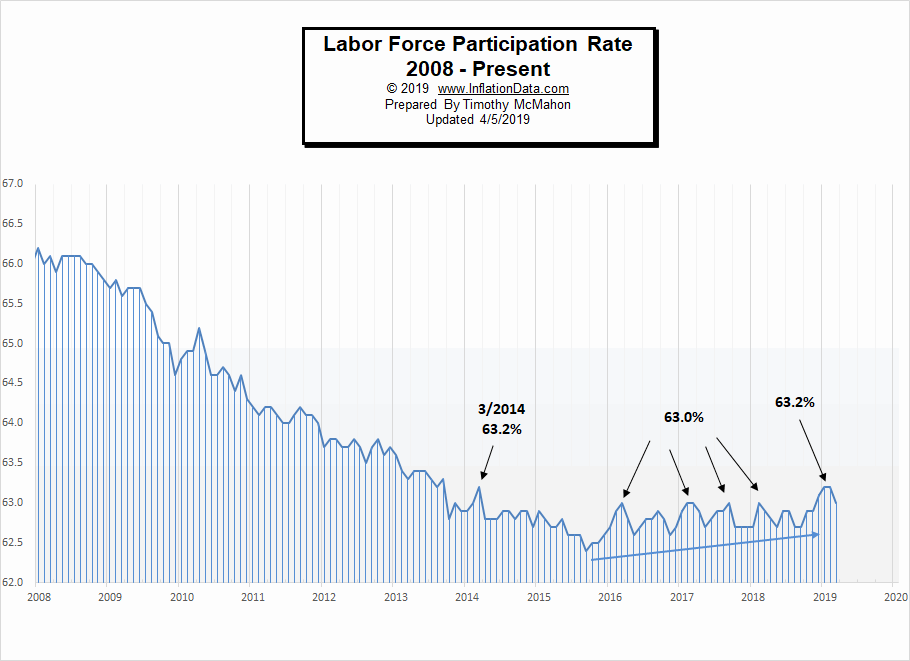
See Labor Force Participation Rate for more information.
Employment Population Ratio
The index many people think of when they hear the term Labor Force Participation Rate might be better described by the Employment Population Ratio. This index shows the percentage of the entire population that is working. In many ways it is a better index than the LFPR or the Unemployment rate. Current levels are back in the range of where they were in 2009 even though the population has drastically increased.
Here are some articles you might enjoy in case you missed them:
Read more on UnemploymentData.com.
- 4 Ways to Spot Early Financial Problems in Your Business Practices
- Job Hunting Anxiety? 4 Tips for Nailing Your Next Interview
- Putting Your Best Foot Forward: How to Make Sure You’re a Good Candidate for Hire
- Starting a Restaurant Business?
- Considering a Career in Trucking?
From InflationData.com
- How Does Inflation Affect Foreign Exchange Rates
- Oil Price Inflation Charts and Tables Updated
- Health Insurance Inflation Over the Last 10 Years
- Are Deflationary Forces Taking Hold Again?
- Gold as an Investment
- How Inflation and Interest Rates Relate
From Financial Trend Forecaster
- Merger Mania: The World’s Largest Oil Company And Petrochemical Company Merge
- The $32 Trillion Push To Disrupt The Entire Oil Industry
- Will EV’s Cause Peak Oil Demand?
- Saudi Arabia: We’ll Pump The World’s Very Last Barrel Of Oil
- Renewable Energy Trends in 2019
- NASDAQ Signal Has Only Occurred 15 Times In Last 42 Years
- Is Banning “Short-Selling” a Solution?
- Traders Should Stay Optimistically Cautious
- Has the FED Hit the Launch Button for the Stock Market?
- How to Build Consistent Trading Success
From OptioMoney.com
- 4 Considerations When Getting a Loan for Your Home Business
- Side Hustle—4 Unique Ways to Make Some Extra Money
- Getting Rid of Excess Items Helps You Save Money
- What’s it Worth? 4 DIY Ways to Increase Value of and Help Sell Your Home
- Medical Equipment Costs: How to Deal with Abrupt Healthcare Expenses
From Your Family Finances