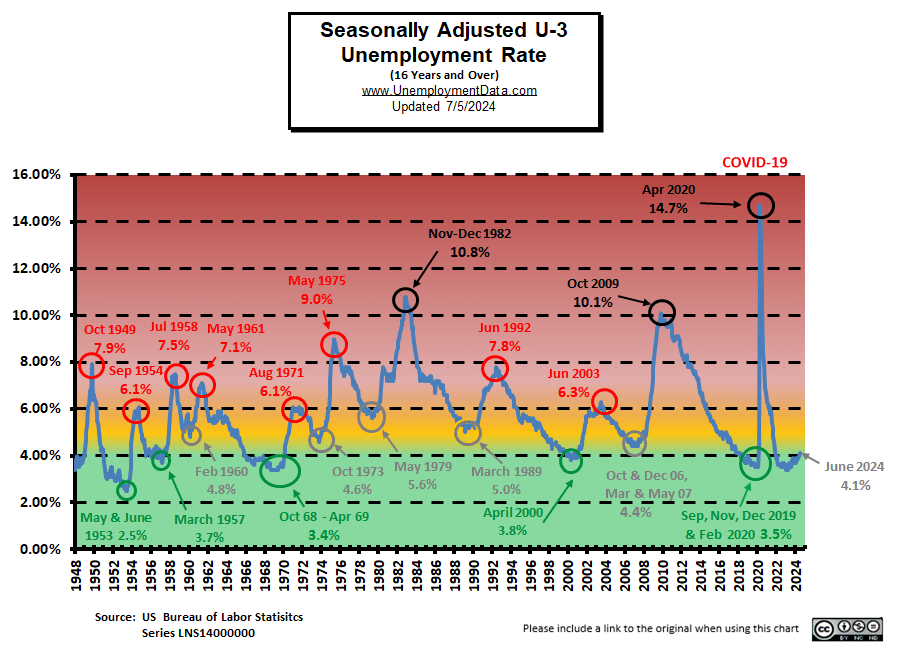
The U.S. Bureau of Labor Statistics data regarding the Unemployment situation in September was not released on October 3rd as scheduled due to the Federal Government shutdown.
Based on the alternative data from ADP we see:
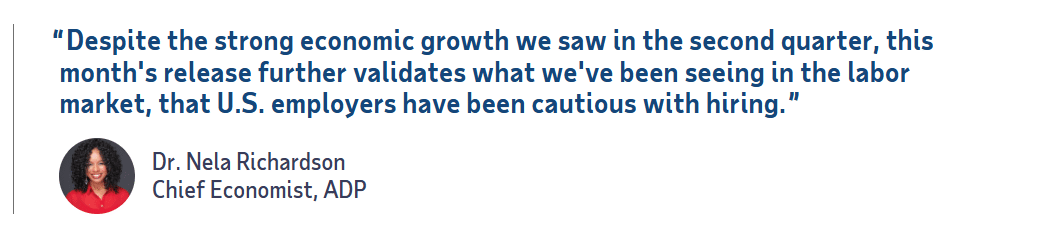
According to ADP:
Private employers shed 32,000 jobs in September
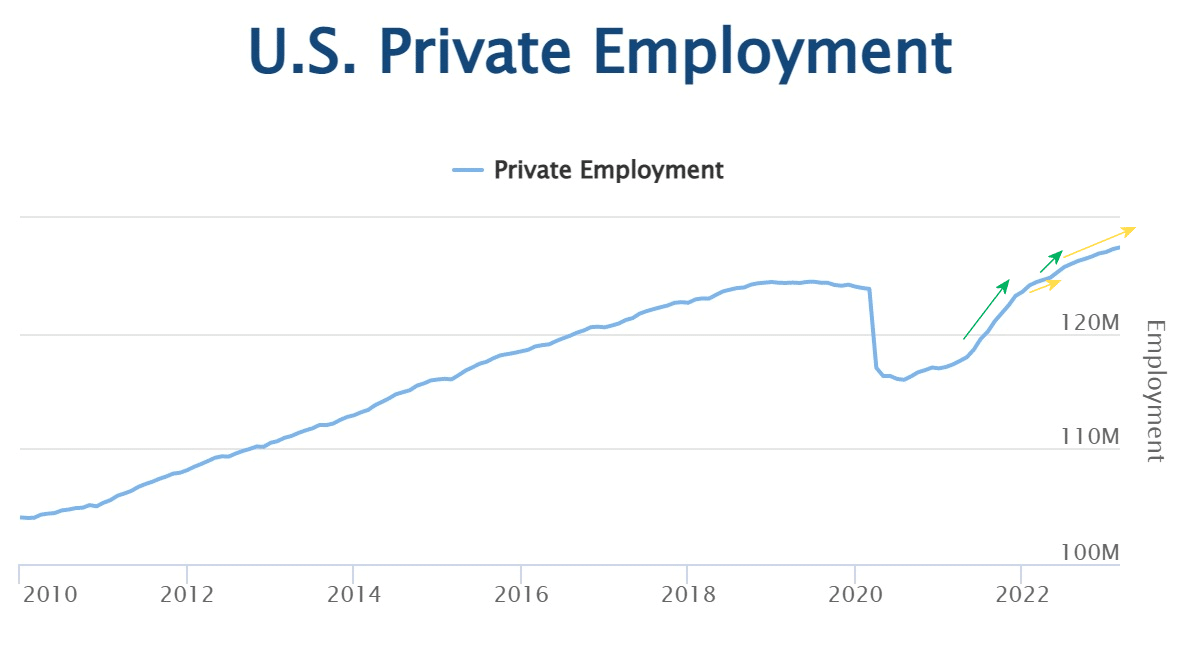
ADP provides an independent (non-government) estimate of private-sector employment and pay, based on data derived from ADP client payrolls. According to ADP®, In collaboration with Stanford Digital Economy Lab. The numbers are released a few days before the BLS numbers and are often quite different.
Source: ADP®
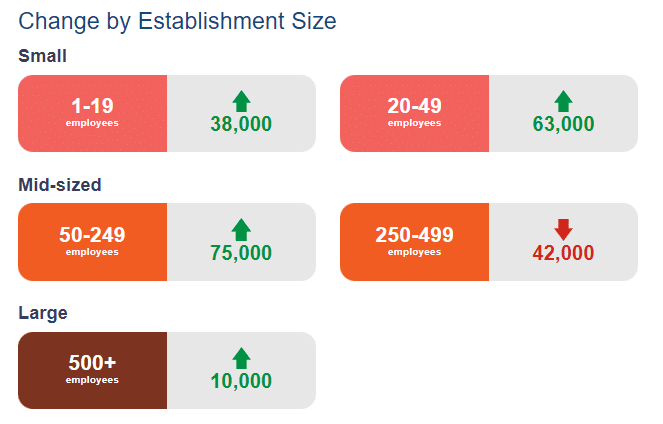
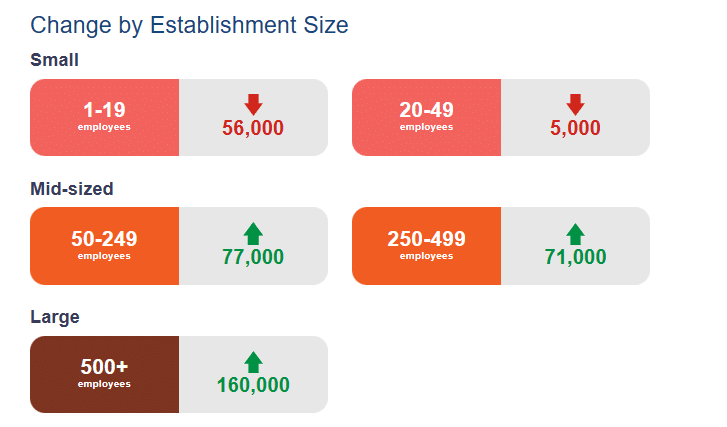
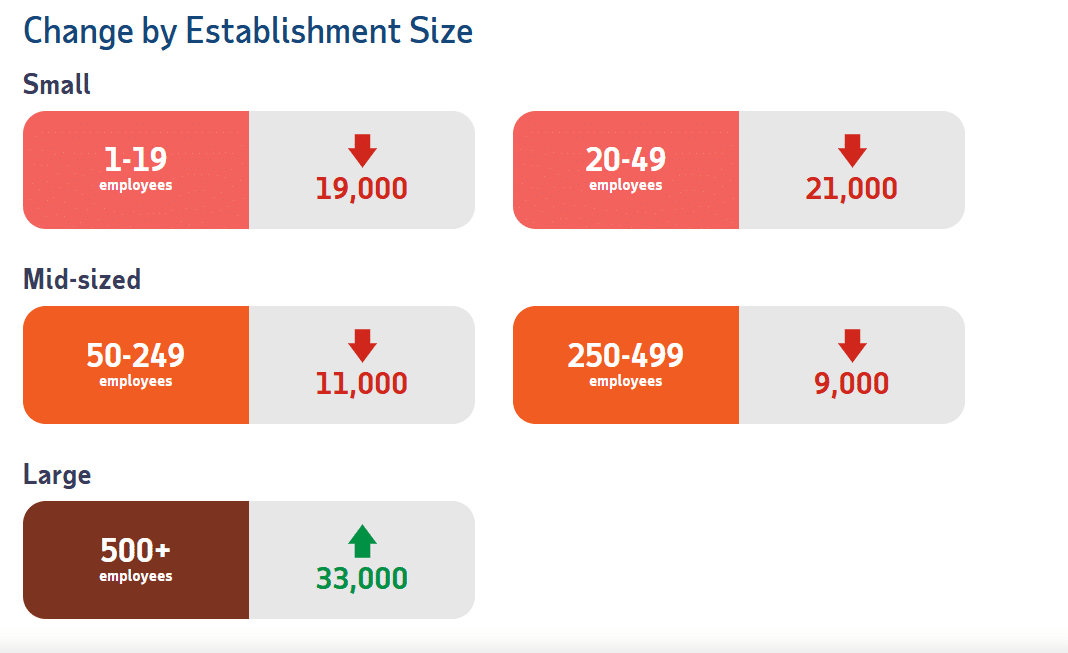
ADP Private Employment by Establishment Size
Small to medium-sized companies shed employees in September. However, larger companies took up some of the slack by adding employees.
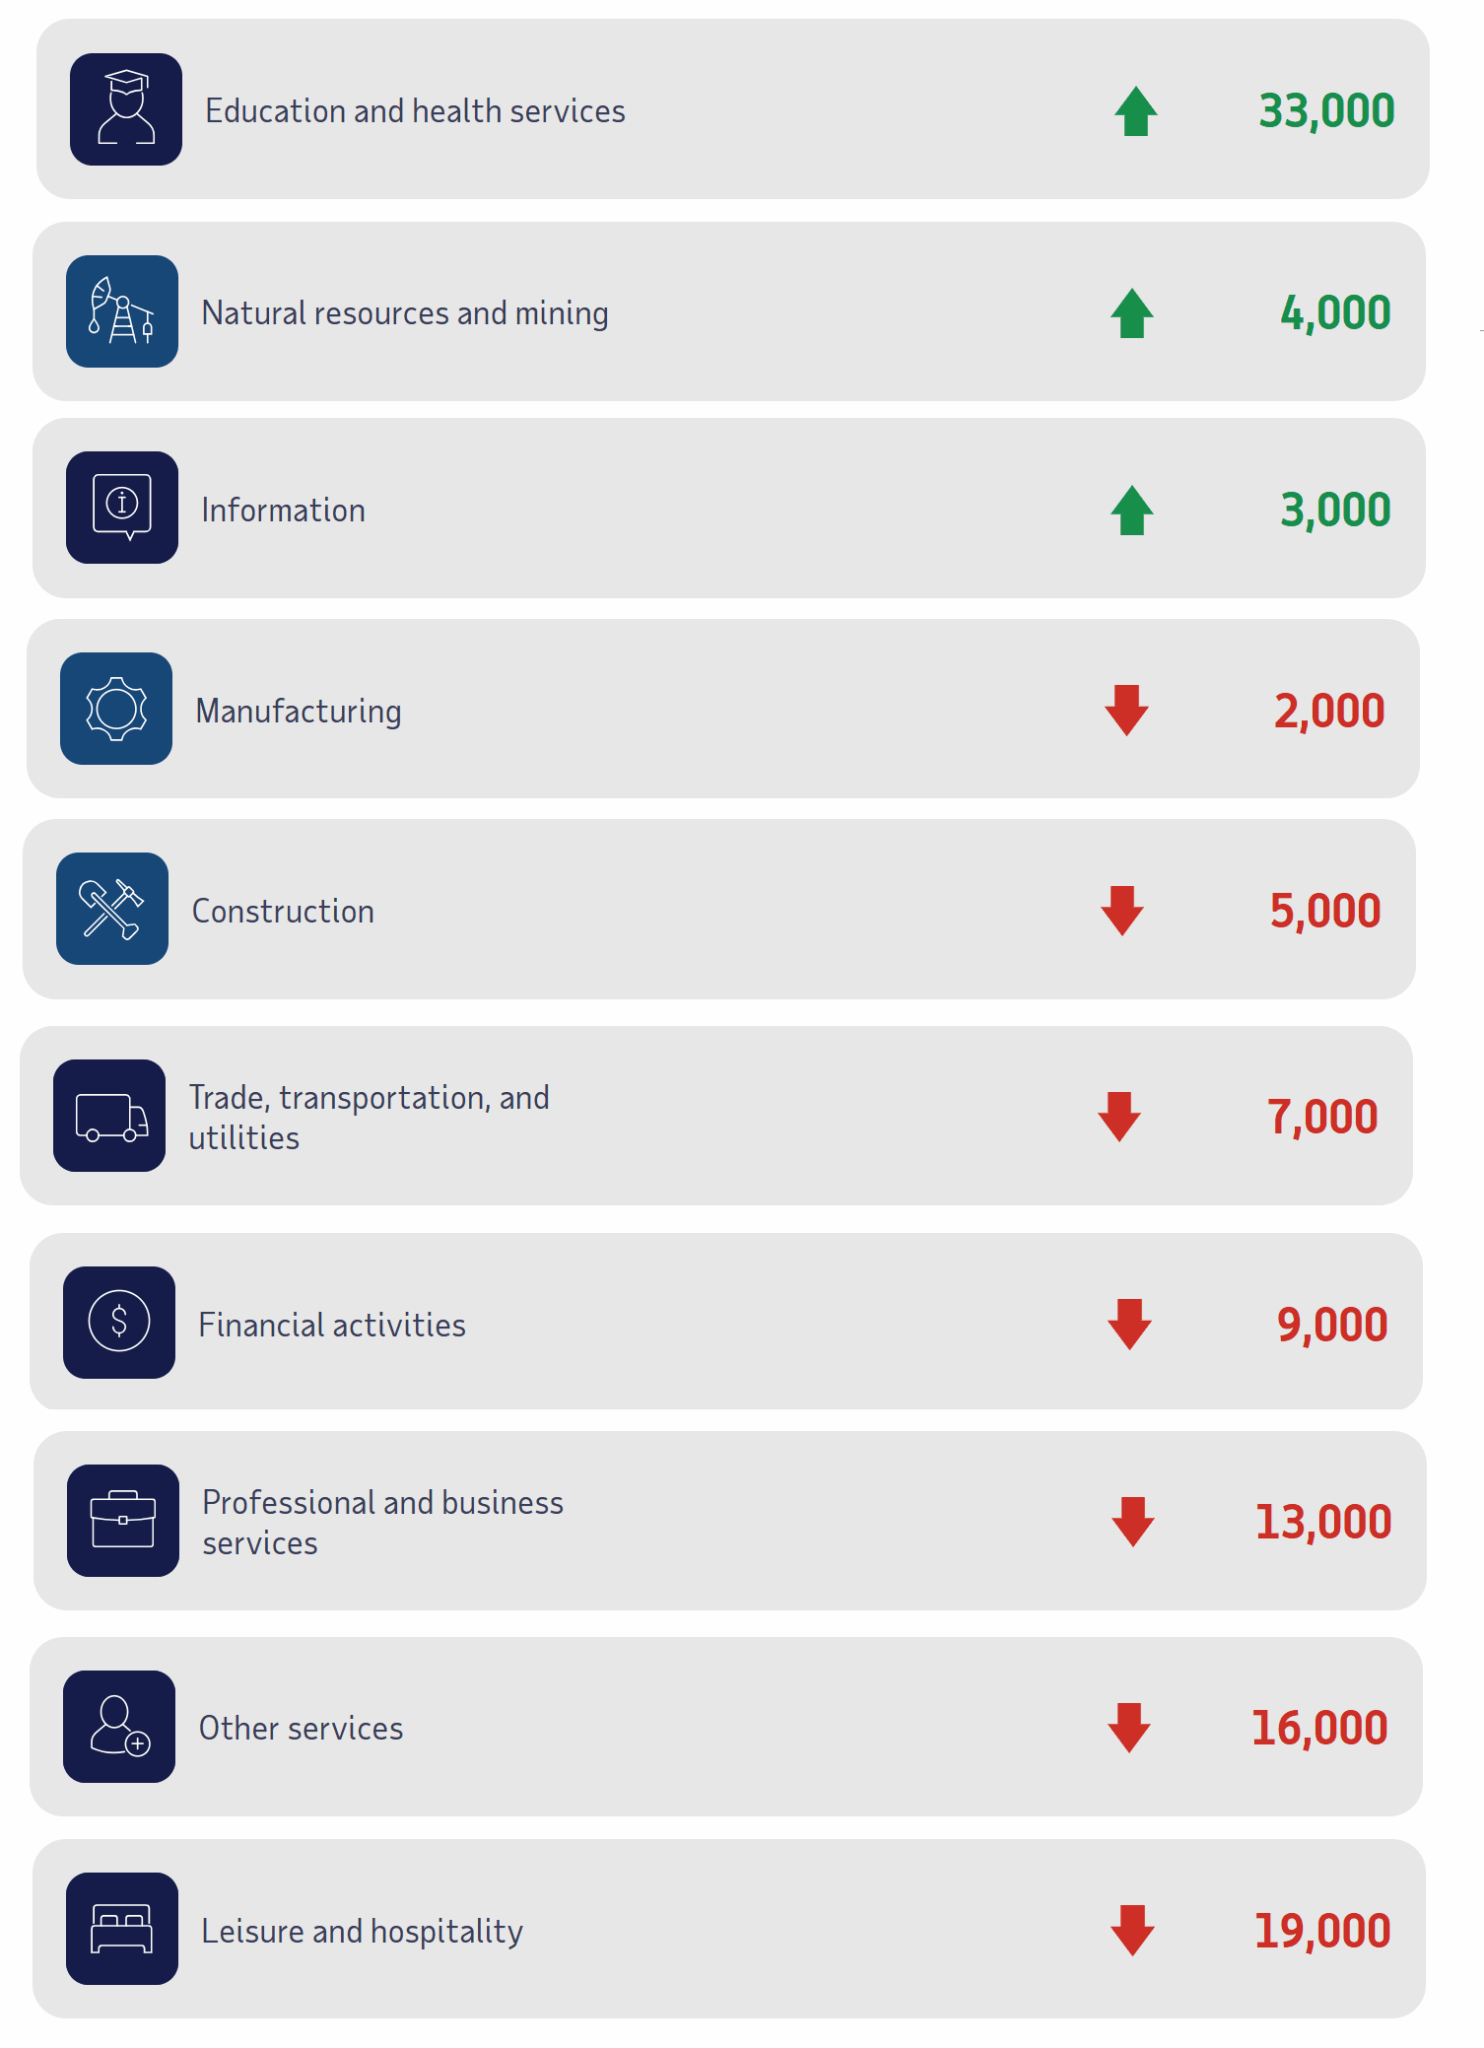
ADP Job Gainers / Losers
Drilling down a bit deeper, we can see that the largest gainer was Education and Health which makes sense with school going back in session and health always looking for more help. And the biggest loser isn’t surprising either as Leisure and Hospitality cuts back as the Summer winds down.
ADP Pay Insights
September pay gains were steady for job-stayers
- Year-over-year pay growth for job-stayers was little changed in September at 4.5 percent. Pay gains for job-changers slowed to 6.6 percent from 7.1 percent in August, led by leisure and hospitality and financial activities.
The Median Annual Pay for Job Stayers in September was $61,000.
Source: ADP
Read more on UnemploymentData.com.
- Blue-Collar Wages Surge in 2025
- Does Raising The Minimum Wage Make A Substantial Difference?
- Would More Jobs Help Social Security?
From Financial Trend Forecaster
- Moore Inflation Predictor
- NYSE ROC
- NASDAQ ROC
- ETH and BTC Buy Signal
- Government Shutdown 2025: What It Means for You and the Markets
- Fed’s First Rate Cut in Nine Months
- Pirates of the Crypto-ribbean
- Overcoming Power Grid Demand Problems- Then and Now
- Is the Crypto Pull-Back Serious?
- The Truth About AI and Electricity Capacity
- This Forecasting Tool Nailed the S&P Turns
- Warren Buffett isn’t buying — and that says a lot.
- Debt Ceiling Drama
- Stock Market Signal: Only 3 Times in 47 Years!
- Tesla’s Troubles — Is it Musk or is it More?
From OptioMoney
- What is a “Haircut” in Financial Terminology
- How To Protect Your Wallet When You’re Just Starting Out
- Consumer Culture Contrasting Spending Habits in the US and Europe
- Financial Considerations When Moving to Florida
From Your Family Finances
- YFF has a new editor, so we won’t be posting new links anymore.