
![]()
The U.S. Bureau of Labor Statistics (BLS) released its employment / unemployment report for December on January 8th.
- Unadjusted U-3 was Up from 6.4% to 6.5%
- Adjusted U-3 was unchanged at 6.7%
- Unadjusted U-6 was unchanged at 11.6%
- Labor Force Participation was unchanged at 61.5%
- Unadjusted Employment Down from 144.105 million to 143.777 million
According to the Commissioner of the U.S. Bureau of Labor Statistics:
“Nonfarm payroll employment declined by 140,000 in December, and the unemployment rate was unchanged at 6.7 percent. The decline in payroll employment reflects the recent rise in the number of coronavirus (COVID-19) cases and increased efforts to contain the pandemic. In December, job losses in leisure and hospitality and in private education were partially offset by gains elsewhere, particularly in professional and business services, retail trade, and construction.“
Of course, they are talking about “Seasonally Adjusted Jobs” from the “Current Population Survey (CPS)” rather than looking at the results reported by actual companies in their “Current Employment Statistics survey (CES)”
Looking at the CES report we see…
Originally the BLS reported 144.005 million jobs for November, this month they adjusted that to 144.105 million.
So currently they are saying 143.777 million jobs for December and 144.105 million for November.
which is actually a decrease of 228,000 jobs based on their original estimates.
Employment by Sector
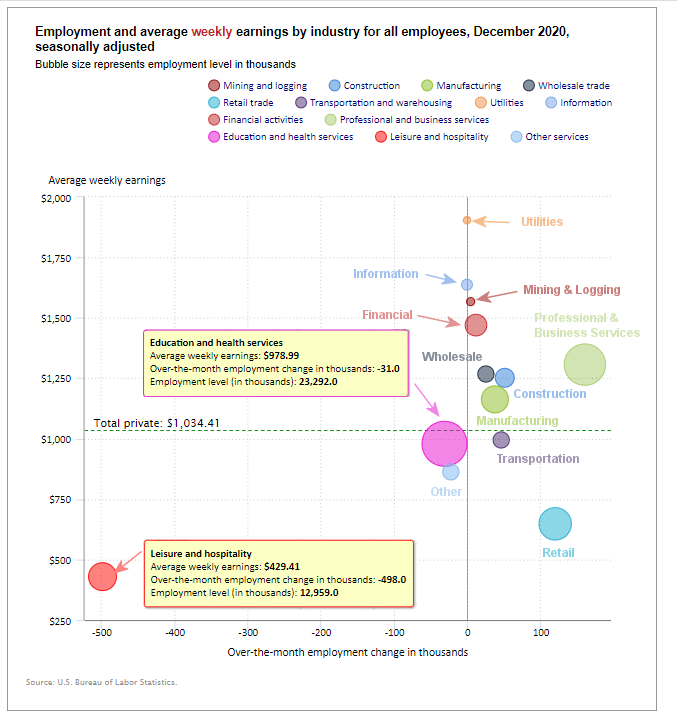
The employment “bubble chart” gives us a good representation of how each sector of the economy is doing (employment wise on a seasonally adjusted basis).
The best-performing sectors in December was Professional and Business Services with a gain of 161,000 jobs. Retail gained 120,500 jobs. Other gainers were Construction 51,000, Manufacturing 38,000, and Wholesale 25,100.
Leisure and Hospitality was the big loser -498,000 jobs.
Average weekly wages rose again in December to 1034.41 from November’s $1029.38
It was $1,026.60 in October, $1,022.61 in September, August was $1,019.66 and July was $1,013.96.
(See the table below for details.)
How to read this chart:
The bubbles location on the chart tell us two things:
- Change in Employment Levels over the most recent month.
- Average Weekly earnings.
- The further to the right the bubble the larger the increase in the number of jobs.
- The higher up on the chart the larger the average salary.
Bubble Size tells us:
- Total Employment for the sector.
- Larger bubbles mean more people are employed in that sector.
Employment and Average Weekly Earnings by Industry
December 2020, Seasonally Adjusted
| Industry | Monthly Increase | Average Weekly Earnings | Employment Level |
| Total Private Employment | -95,000 | $1,034.41 | 121,223,000 |
| Mining and Logging | 4,000 | $1,567.24 | 630,000 |
| Construction | 51,000 | $1,251.98 | 7,413,000 |
| Manufacturing | 38,000 | $1,162.58 | 12,309,000 |
| Wholesale trade | 25,100 | $1,267.62 | 5,683,500 |
| Retail trade | 120,500 | $647.82 | 15,261,300 |
| Transportation and Warehousing | 46,600 | $994.83 | 5,588,800 |
| Utilities | -400 | $1,903.90 | 537,700 |
| Information | -1,000 | $1,637.25 | 2,626,000 |
| Financial Activities | 12,000 | $1,469.92 | 8,743,000 |
| Professional and Business Services | 161,000 | $1,306.52 | 20,692,000 |
| Education and Health Services | -31,000 | $978.99 | 23,292,000 |
| Leisure and Hospitality | -498,000 | $429.41 | 12,959,000 |
| Other Services | -22,000 | $862.81 | 5,488,000 |
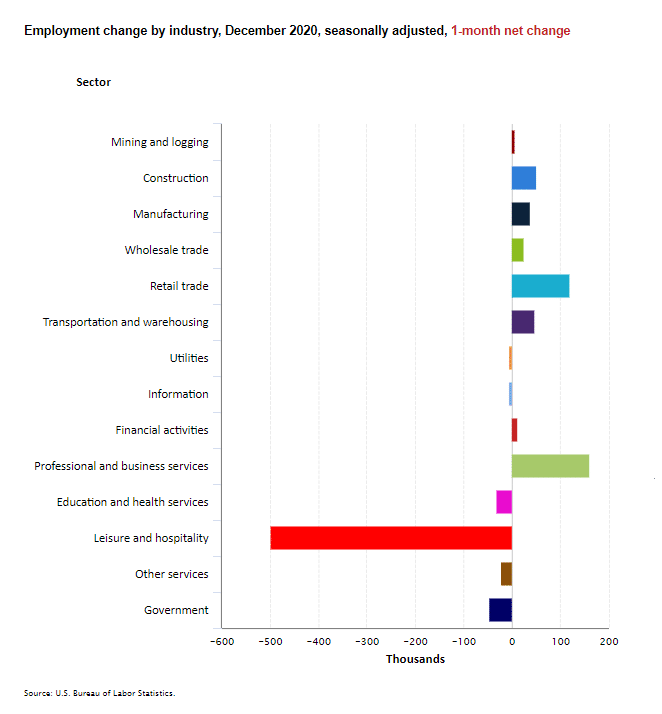
Another way to look at these monthly numbers. This one includes a decrease in government jobs and shows the magnitude of the loss in Leisure and Hospitality jobs.
 Looking at the same information on an ANNUAL basis, however, gives us an entirely different picture. In this case, we see that all sectors are still below year-ago levels with Leisure and Hospitality still the hardest hit.
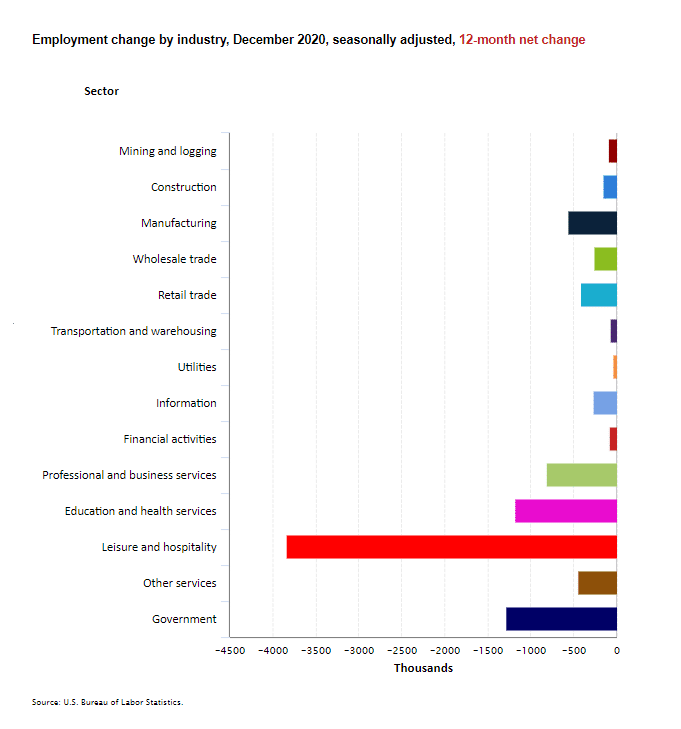
Source: BLS
U1 through U6 Unemployment Rates
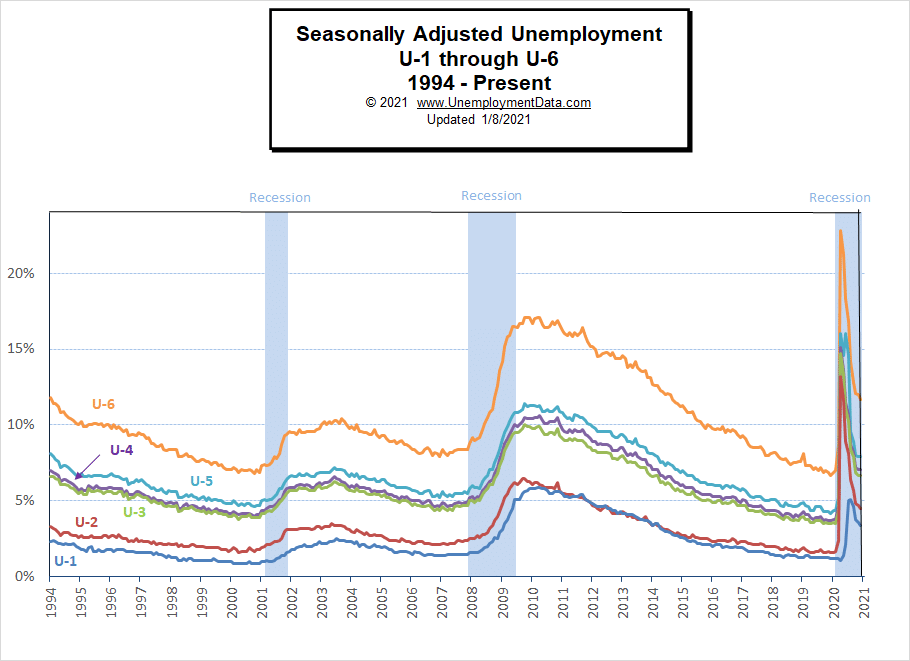
Due to COVID, all the various measurements of Seasonally Adjusted Unemployment from U-1 through U-6 spiked up sharply beginning in April except U1 which measures unemployment longer than 15 weeks. In July, they began falling rapidly. In November they only fell slightly due to renewed restrictions by several states. And in December they were basically flat.
For more information about the various measurements of unemployment see What Is U-6 Unemployment?
Current Employment
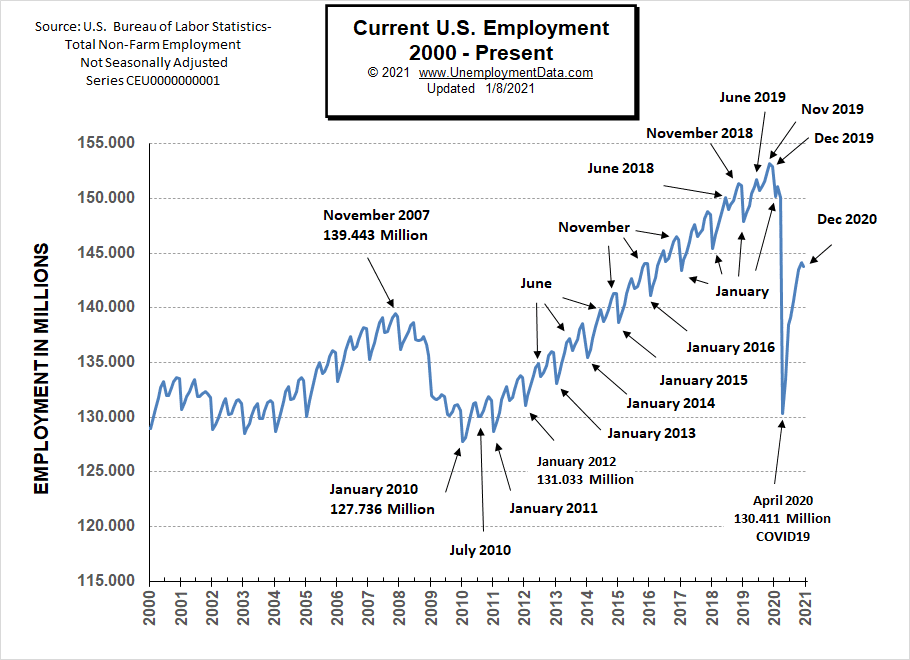
Typically the low point for each year occurs in January and then it moves almost straight up to a small peak around June with a slight drop around July and then the highest peak in employment happens in November with a slight decline in December.
But the COVID virus shortcircuited the normal trend in 2020 with a drop which began in March and by April it took employment back down to approximately the level of July 2010. June saw employment rebound to approximately the January 2015 level. Fortunately, July did not follow the traditional pattern but instead rose (although only slightly) rather than falling. August’s employment rose to roughly the January 2016 level. November’s Employment was slightly above the October level. In December we got the traditional slight decline.
See Current Employment for more info.
Previous Record Low Unemployment (Seasonally Adjusted U-3)
If we consider anything 4% or below as “low” we have had a few “low” stretches as we can see in the table below.
(4% or below in Green)
| Jan | Feb | Mar | Apr | May | Jun | Jul | Aug | Sep | Oct | Nov | Dec | |
| 1950 | 6.5% | 6.4% | 6.3% | 5.8% | 5.5% | 5.4% | 5.0% | 4.5% | 4.4% | 4.2% | 4.2% | 4.3% |
| 1951 | 3.7% | 3.4% | 3.4% | 3.1% | 3.0% | 3.2% | 3.1% | 3.1% | 3.3% | 3.5% | 3.5% | 3.1% |
| 1952 | 3.2% | 3.1% | 2.9% | 2.9% | 3.0% | 3.0% | 3.2% | 3.4% | 3.1% | 3.0% | 2.8% | 2.7% |
| 1953 | 2.9% | 2.6% | 2.6% | 2.7% | 2.5% | 2.5% | 2.6% | 2.7% | 2.9% | 3.1% | 3.5% | 4.5% |
| 1954 | 4.9% | 5.2% | 5.7% | 5.9% | 5.9% | 5.6% | 5.8% | 6.0% | 6.1% | 5.7% | 5.3% | 5.0% |
| 1955 | 4.9% | 4.7% | 4.6% | 4.7% | 4.3% | 4.2% | 4.0% | 4.2% | 4.1% | 4.3% | 4.2% | 4.2% |
| 1956 | 4.0% | 3.9% | 4.2% | 4.0% | 4.3% | 4.3% | 4.4% | 4.1% | 3.9% | 3.9% | 4.3% | 4.2% |
| 1957 | 4.2% | 3.9% | 3.7% | 3.9% | 4.1% | 4.3% | 4.2% | 4.1% | 4.4% | 4.5% | 5.1% | 5.2% |
| 1958 | 5.8% | 6.4% | 6.7% | 7.4% | 7.4% | 7.3% | 7.5% | 7.4% | 7.1% | 6.7% | 6.2% | 6.2% |
| … | … | … | … | … | … | … | … | … | … | … | … | … |
| 1965 | 4.9% | 5.1% | 4.7% | 4.8% | 4.6% | 4.6% | 4.4% | 4.4% | 4.3% | 4.2% | 4.1% | 4.0% |
| 1966 | 4.0% | 3.8% | 3.8% | 3.8% | 3.9% | 3.8% | 3.8% | 3.8% | 3.7% | 3.7% | 3.6% | 3.8% |
| 1967 | 3.9% | 3.8% | 3.8% | 3.8% | 3.8% | 3.9% | 3.8% | 3.8% | 3.8% | 4.0% | 3.9% | 3.8% |
| 1968 | 3.7% | 3.8% | 3.7% | 3.5% | 3.5% | 3.7% | 3.7% | 3.5% | 3.4% | 3.4% | 3.4% | 3.4% |
| 1969 | 3.4% | 3.4% | 3.4% | 3.4% | 3.4% | 3.5% | 3.5% | 3.5% | 3.7% | 3.7% | 3.5% | 3.5% |
| 1970 | 3.9% | 4.2% | 4.4% | 4.6% | 4.8% | 4.9% | 5.0% | 5.1% | 5.4% | 5.5% | 5.9% | 6.1% |
| … | … | … | … | … | … | … | … | … | … | … | … | … |
| 1999 | 4.3% | 4.4% | 4.2% | 4.3% | 4.2% | 4.3% | 4.3% | 4.2% | 4.2% | 4.1% | 4.1% | 4.0% |
| 2000 | 4.0% | 4.1% | 4.0% | 3.8% | 4.0% | 4.0% | 4.0% | 4.1% | 3.9% | 3.9% | 3.9% | 3.9% |
| 2001 | 4.2% | 4.2% | 4.3% | 4.4% | 4.3% | 4.5% | 4.6% | 4.9% | 5.0% | 5.3% | 5.5% | 5.7% |
| … | … | … | … | … | … | … | … | … | … | … | … | … |
| 2018 | 4.1% | 4.1% | 4.1% | 3.9% | 3.8% | 4.0% | 3.9% | 3.9% | 3.7% | 3.7% | 3.7% | 3.9% |
| 2019 | 4.0% | 3.8% | 3.8% | 3.6% | 3.6% | 3.7% | 3.7% | 3.7% | 3.5% | 3.6% | 3.5% | 3.5% |
| 2020 | 3.6% | 3.5% | 4.4% | 14.7% | 13.3% | 11.1% | 10.2% | 8.4% | 7.9% | 6.9% | 6.7% | 6.7% |
Historical Employment
Historically employment is closely tied to recessions and that is no accident. One of the primary factors in calculating whether the economy is officially in a recession is an increase in the unemployment rate. The chart below provides the Historical Employment Data overlaid on blue bars showing periods of official recessions. In April, the number of people employed fell below the 2007 peak, near the lows of the 2008-2010 crash. In August it rebounded back above the 2007 peak level. According to the National Bureau of Economic Research (NBER) we have officially been in a recession since February. Since they measure a recession beginning from the peak, that just means the economy is no longer growing, which is pretty obvious due to the virus.
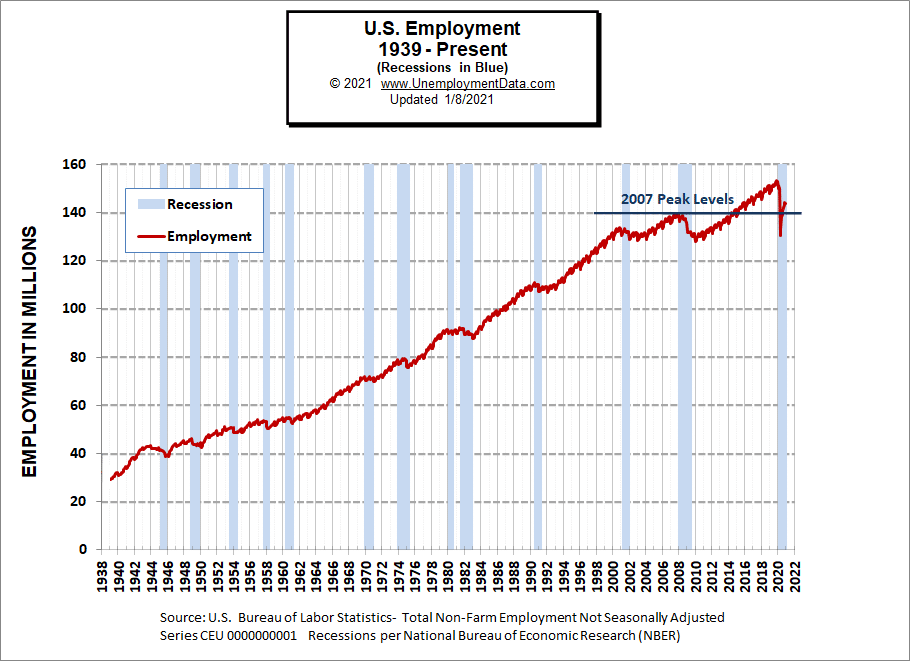
See Historical Employment Data for more info.
Current Seasonally Adjusted Unemployment
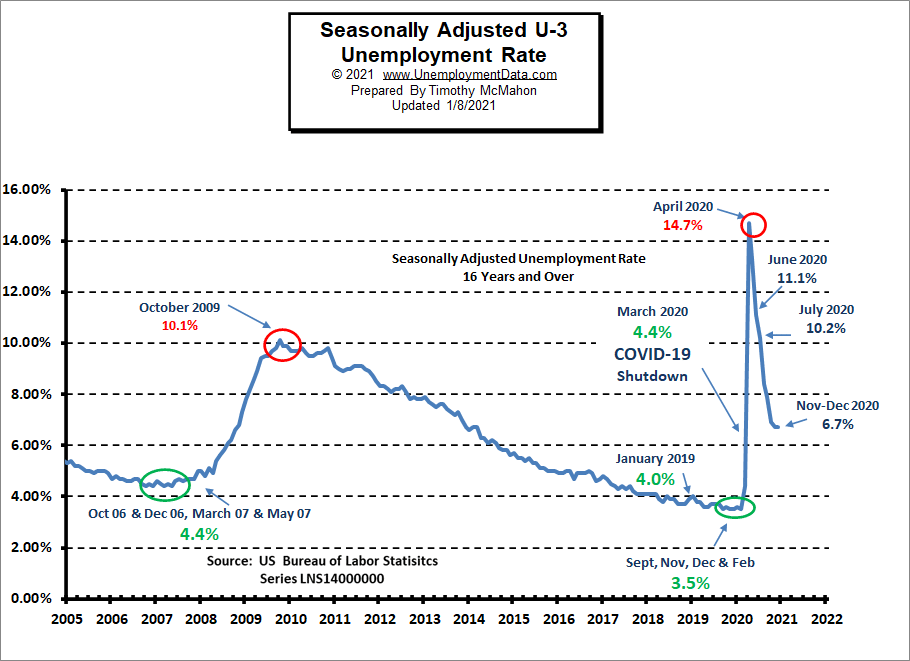 See Current Employment Commentary for more info.
Unemployment by Education
After bottoming at 4.8% in September 2019, those unemployed with less than a High School Diploma rose to 21.2% in April 2020 and then fell to 15.4% by July and 9.8% in October to 9.0% in November. In December it rose back to 9.8%.
Typically those with a Bachelor’s degree are relatively immune to unemployment. Although during the 2008 recession college grads’ unemployment rose to slightly above 4%.
Those with a Bachelor’s degree or higher had a low of 1.9% unemployment in February 2019 and rose to 8.4% in April 2020. Unemployment fell to 4.8% by September and 4.2% in October where it remained in November. It fell to 3.8% in December.
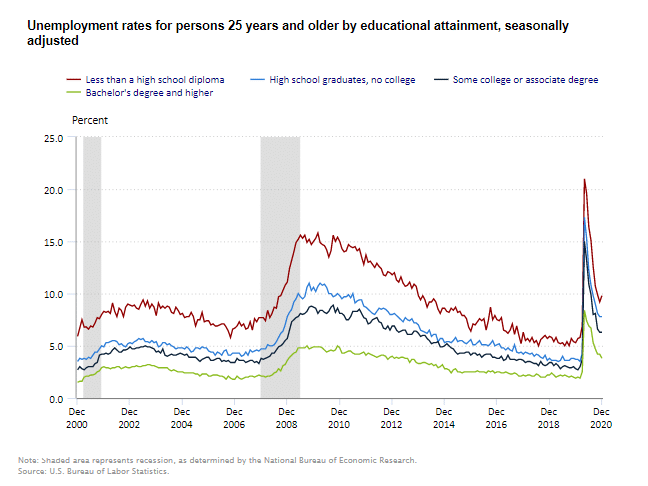
Source: Bureau of Labor Statistics
Layoff Status
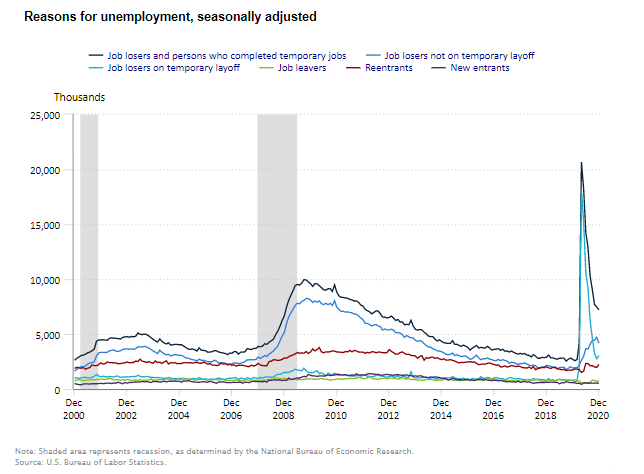 All categories were relatively unchanged from last month after falling sharply in previous months.
Source: BLS
Duration of Unemployment
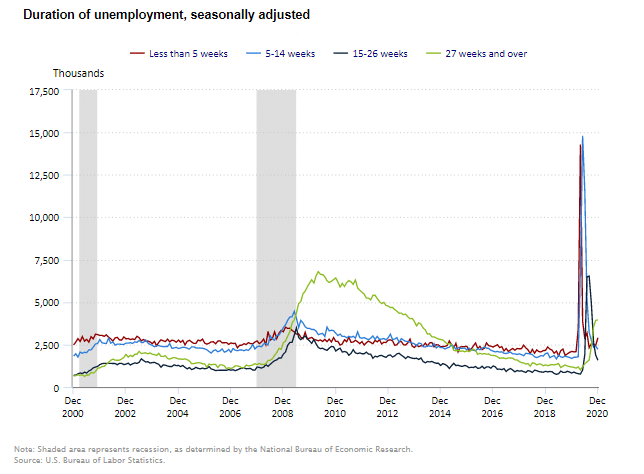 Since 2016 the time people remained unemployed remained relatively low. But, then the virus shutdown occurred and people were spending longer times unemployed. Now, unemployment times are returning to normal, although it is difficult to see in the chart above the percentage of those unemployed for 27 weeks and over has been climbing but appears to have leveled out in December.
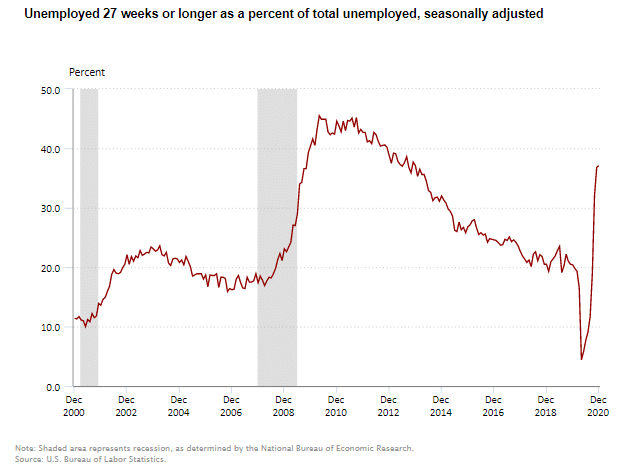 Interestingly the sharp drop earlier this year is due to the massive spike in unemployment. Therefore, since most of the people were newly unemployed the percentage of unemployed over 27 weeks actually fell.
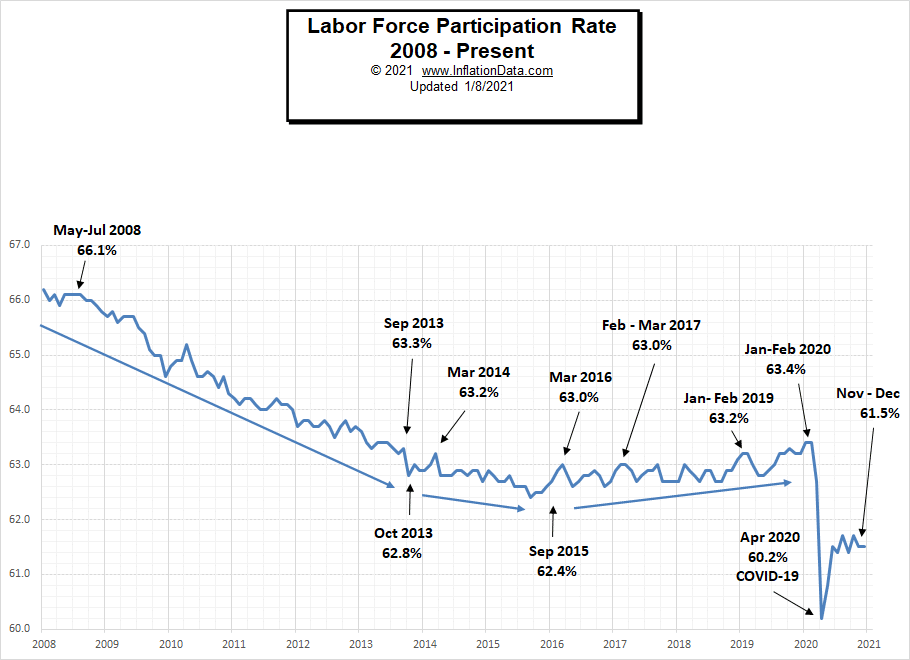
Labor Force Participation Rate
Even though Unemployment was in record low territory for quite some time, it wasn’t until January and February 2020, that the LFPR was finally able to claw its way back to 63.4%, its highest level since 2013.
Then COVID decimated all those gains dropping the LFPR down to 60.2% in April. In May it began to rebound and in June the LFPR was able to bounce back a little more to 61.5%, it fell slightly in July but this was probably due to people returning to the labor force rather than other factors. Over the last few months, the LFPR has bounced around between 61.4% and 61.7%.
See Labor Force Participation Rate for more information.
If you would like to receive this monthly report and other article updates click here you can unsubscribe at any time.
Here are some articles you might enjoy in case you missed them:
Read more on UnemploymentData.com.
- Create a Professional Resume
- How to Get a Job with No Experience
- Turning Unemployment to Success
- Jobs That Are Readily Available If You Need One Quickly
- Digital Nomads: Reasons Why the Future of Work is Remote
From InflationData.com
- Long Term Inflation Charts Updated
- November Inflation Virtually Flat
- Annual Inflation in October is 1.18%
- Emerging Technologies
- A Better Understanding of How IRS Audits Work
- The Price of Oil Denominated in Bitcoin
- How has Venezuela’s Bitcoin experiment Fared?
From Financial Trend Forecaster
- Top Financial Trends Shaping Banking
- The Death Of U.S. Shale Has Been Greatly Exaggerated
- China Ramps Up U.S. Crude Oil Imports
- Speed and Affordability: Cost of Internet Access Over Time
- New Technologies in the Oil and Gas Industry
From Elliott Wave University
- Why Most Investors Miss Major Stock Market Turns
- This High-Confident Trade Set-up Makes for Highly-Confident Traders
- Bond Market: “When Investors Should Worry”
- Does the Stock Market Really “See” the Future?
- Gold: See What This Fibonacci Ratio Says About the Trend
From OptioMoney.com
- Smart Finance Moves: Questions to Ask Yourself Before You Buy a New Car
- Wealth Transfer: Estate Planning
- 5 Things to Consider When Managing Money in a Relationship
- Should You Buy a Second Home?
- Learning to Trade from Video Tutorials
From Your Family Finances