
The U.S. Bureau of Labor Statistics (BLS) released its employment / unemployment report for October on November 1st, 2024.
Employment / Unemployment
![]()
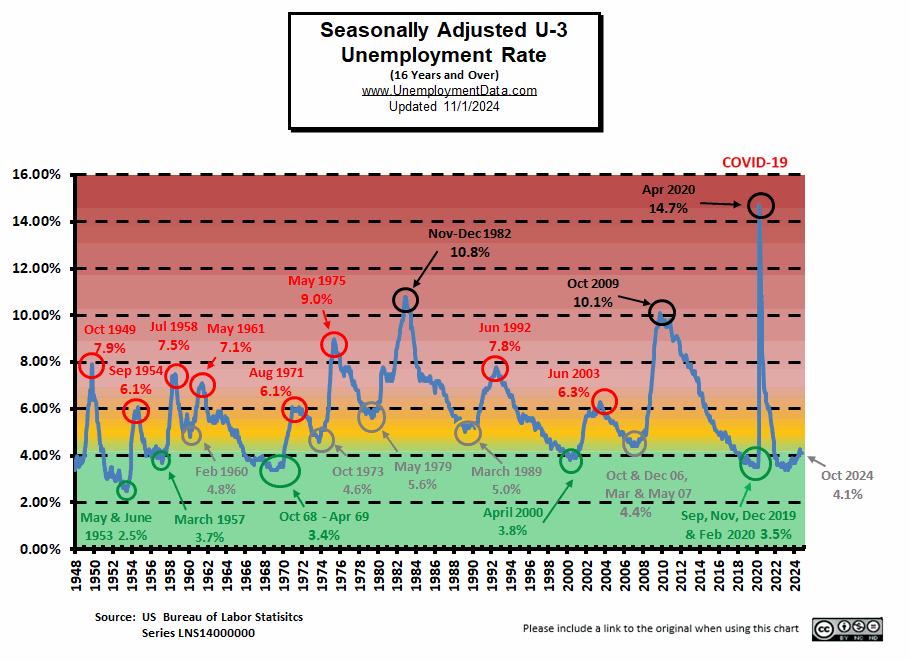
- Seasonally Adjusted U3- 4.1% Unchanged from September
- Unadjusted U3- 3.9% Unchanged from September
- Unadjusted U6- 7.3% Unchanged from September
- Labor Force Participation Rate 62.6% down from September
- Employment 160.007 million up from 159.181 million
- Next data release December 6th, 2024
Summary:
Total Employed increased very slightly in October, Unadjusted Unemployment was unchanged, Seasonally adjusted Unemployment was unchanged. Virtually everything was unchanged except LFPR fell by 0.1%.
According to the Commissioner of the U.S. Bureau of Labor Statistics:
“Total nonfarm payroll employment was essentially unchanged in October (+12,000), and the unemployment rate was unchanged at 4.1 percent, the U.S. Bureau of Labor Statistics reported today. Employment continued to trend up in health care and government. Temporary help services lost jobs. Employment declined in manufacturing due to strike activity…
The unemployment rate was unchanged at 4.1 percent in October, and the number of unemployed people was little changed at 7.0 million. These measures are higher than a year earlier, when the jobless rate was 3.8 percent, and the number of unemployed people was 6.4 million.”
You can read the full BLS report here.
So, for the month little changed, but on a year-over-year basis the economy is worse with more unemployed people.
As usual, they are talking about “Seasonally Adjusted Jobs”.
Looking at the Unadjusted Establishment Survey report we see…
Originally the BLS reported employment of 159.177 million for September
which they adjusted slightly to 159.181 million in November.
They are currently reporting 160.007 million jobs for October which is actually an increase of 83,000 jobs over their initial numbers or 82,600 over their revised numbers. The LFPR was down slightly from 62.7% to 62.6%.
Bad News for the Market?
The stock market initially rallied but lost steam mid-day and ended up down for the day. As we said last month, “the market doesn’t like uncertainty so it is waiting for election results before making any major moves. Other uncertainty revolves around the Middle-East and Russia.” Despite a rally in-between, the NYSE is roughly at the same place it was on August 30th.
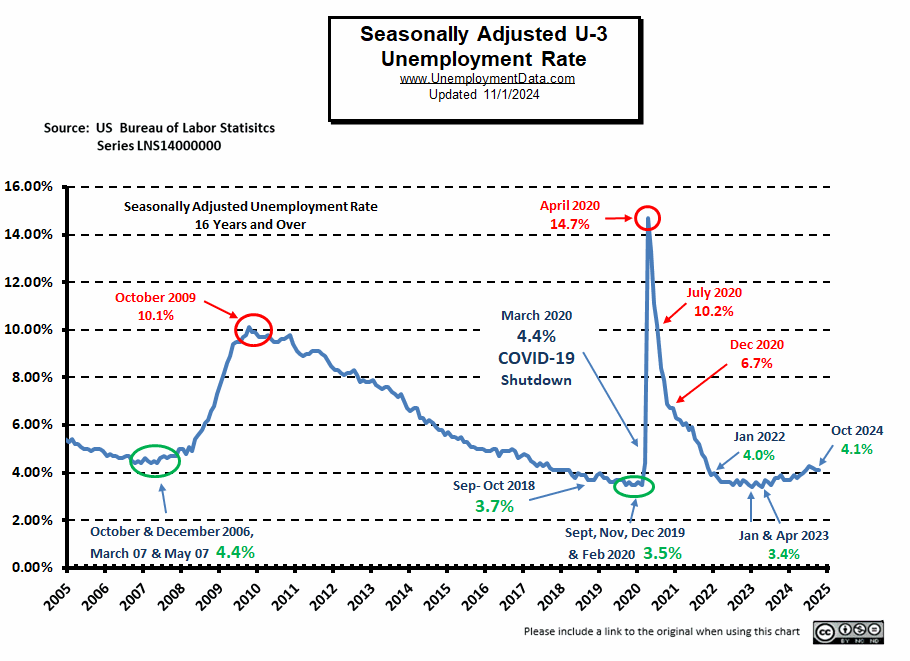
Current Unemployment Rate Chart
As we can see from the chart below, although still low, unemployment is above pre-COVID lows of 2019 and 0.7% above the January and April lows of 2023.
Before the COVID-19 spike, February 2020’s 3.5% Seasonally Adjusted U-3 unemployment levels were excellent, i.e., just a hair above the 1969 lows of 3.4%. The only break below 3.4% was all the way back in 1953 (during the Korean War). The COVID worldwide spike took unemployment to unprecedented high levels, but then returned to the “excellent” range.
At 4.1% it is no longer “Excellent” but still in the “Very Good” range.
Current Employment Rate
At 160.007 million in October, employment is up slightly from the originally reported 159.177 million in September.
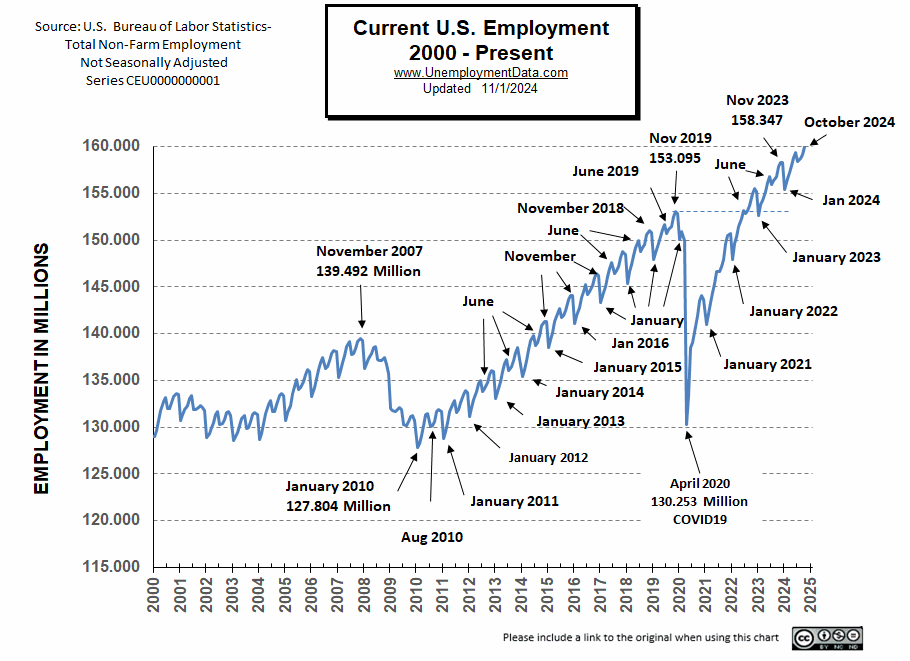
See Current Employment for more information.
BLS: October 2024 Employment by Sector
The BLS employment “bubble chart” based on the Establishment Survey Data gives us a good picture of the Seasonally adjusted employment numbers.
The Bubble’s Size tells us the total Employment for that industry (i.e., larger bubbles mean more people are employed in that sector).
The bubble’s location on the chart tells us that there has been a change in Employment Levels over the most recent month… A bubble further to the right indicates larger job growth. A bubble’s vertical location on the chart shows the average industry salary.
Remember, these are Seasonally Adjusted Numbers, so they aren’t cumulative!
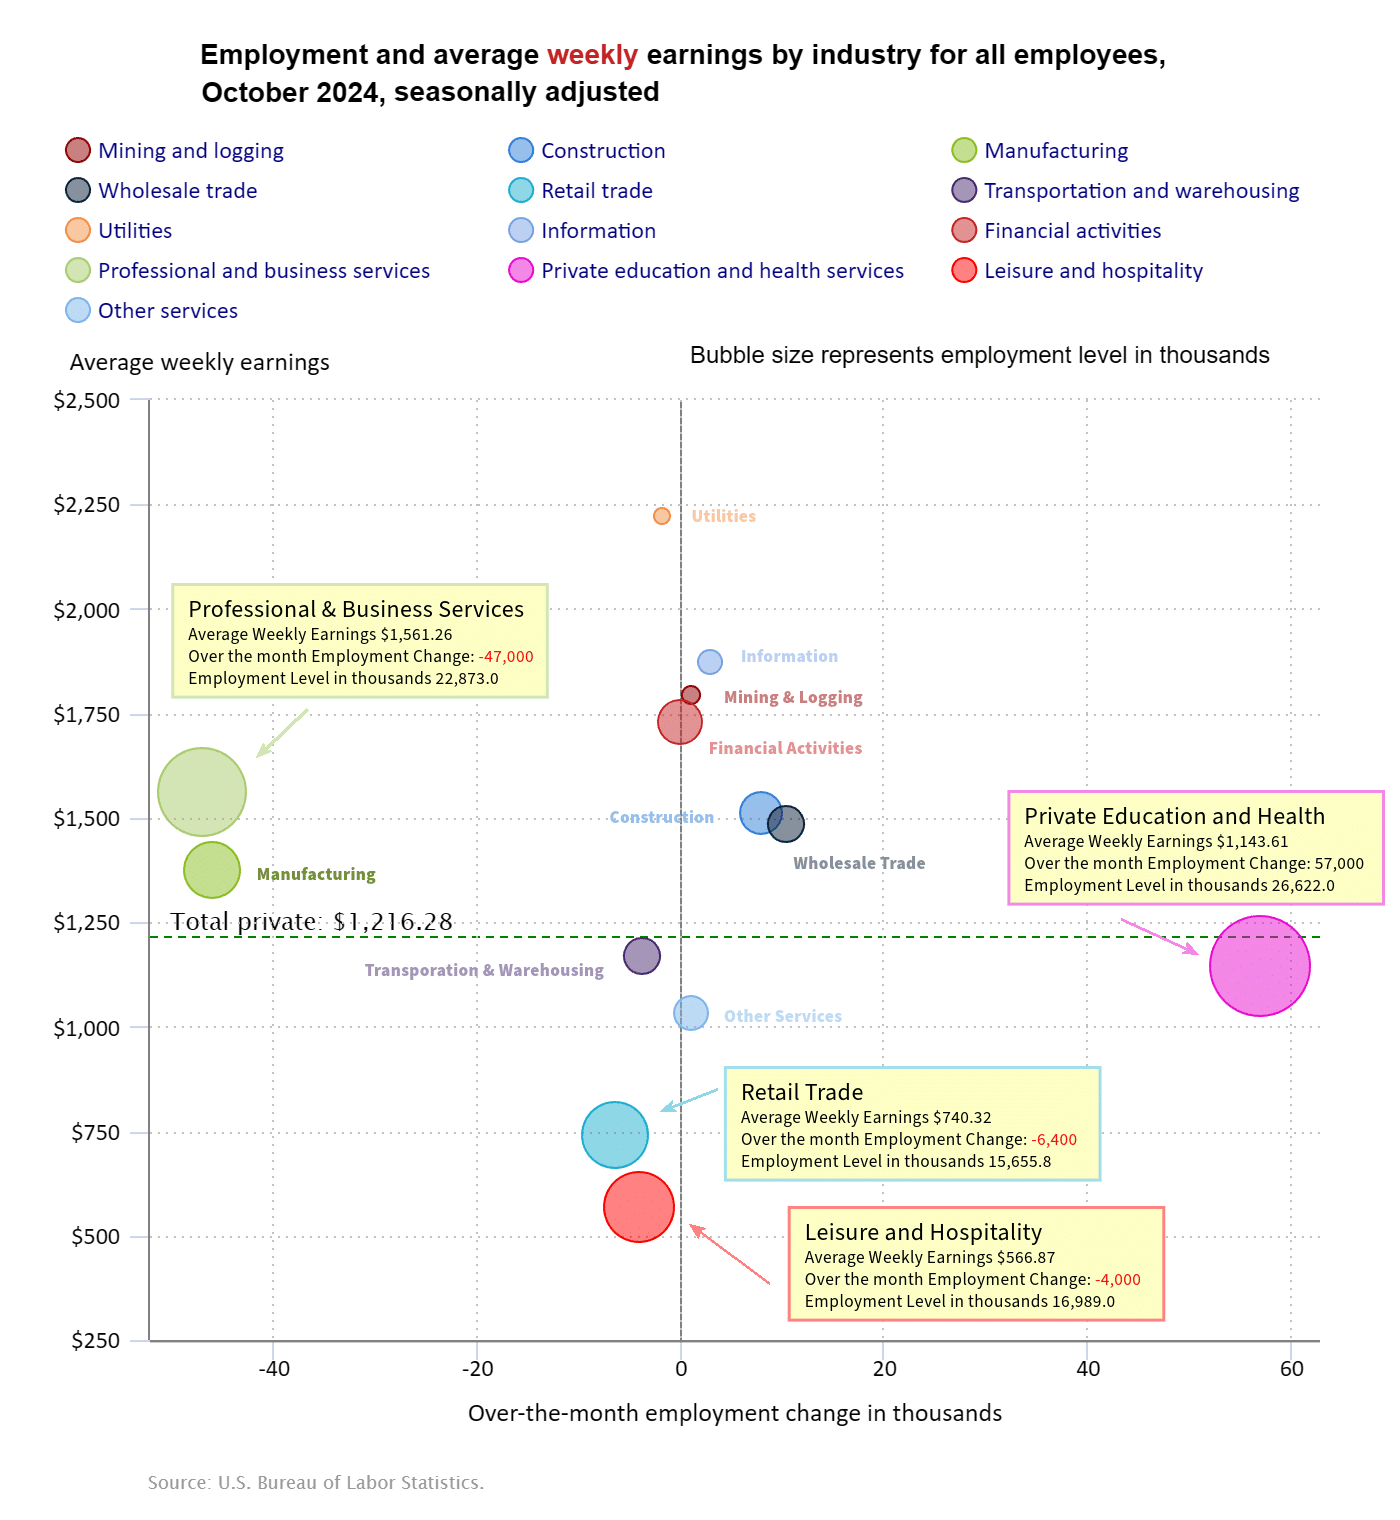 Looking at the above chart we can see several sectors were below zero (i.e., left of the zero line). These included Leisure and Hospitality, Retail, Manufacturing, Transportation, and Professional Services.
Several other sectors were hovering around the Zero line with the only big gainer being Private Education and Health.
BLS Average Weekly Wages
| Date | Average Weekly Wage |
| October 2024 | $1,216.28 |
| September 2024 | $1,209.31 |
| August 2024 | $1,207.70 |
| July 2024 | $1,199.39 |
| June 2024 | $1,200.50 |
| May 2024 | $1,197.41 |
| April 2024 | $1,191.93 |
| March 2024 | $1,193.34 |
| February 2024 | $1,185.75 |
| January 2024 | $1,178.16 |
| December 2023 | $1,175.46 |
| November 2023 | $1,173.04 |
| October 2023 | $1,166.20 |
| September 2023 | $1,165.47 |
| August 2023 | $1,163.41 |
| July 2023 | $1,157.28 |
| June 2023 | $1,155.15 |
| May 2023 | $1,146.99 |
| April 2023 | $1,147.58 |
| March 2023 | $1,141.34 |
| February 2023 | $1,141.61 |
| January 2023 | $1,146.14 |
| December 2022 | $1,125.73 |
| November 2022 | $1,129.01 |
| October 2022 | $1,124.01 |
| September 2022 | $1,119.87 |
| August 2022 | $1,116.42 |
| July 2022 | $1,116.54 |
| June 2022 | $1,106.76 |
| May 2022 | $1,105.47 |
| April 2022 | $1,102.01 |
| December 2021 | $1,086.46 |
Have Wages Kept Up With Inflation?
As you can see from the table above average weekly wages are trending up but are they up enough to keep up with inflation?
BLS Employment and Average Weekly Earnings by Industry
October 2024, Seasonally Adjusted Employment
Note that due to “seasonal adjusting,” although they may claim that there was a “monthly increase” (or decrease), there isn’t always an actual increase; you can’t just subtract last month’s “employment level” from this month’s level. For instance, Total employment was supposed to only have been down by -28,000 in October. But September had 135,684,000 and October was down to 135,548,000 which looks like a -136,000 job decrease. And Mining looks more like a -1,000 decrease than the reported 1,000 increase.
| Industry | Monthly Increase | October Ave. Weekly Earnings | October Employment Level | September Employment Level |
| Total Private Employment | -28,000 | $1,216.28 | 135,548,000 | 135,684,000 |
| Mining and Logging | 1,000 | $1,795.10 | 638,000 | 639,000 |
| Construction | 8,000 | $1,510.08 | 8,310,000 | 8,303,000 |
| Manufacturing | -46,000 | $1,373.36 | 12,873,000 | 12,917,000 |
| Wholesale trade | 10,400 | $1,487.25 | 6,198,600 | 6,177,500 |
| Retail trade | -6,400 | $740.32 | 15,655,800 | 15,668,100 |
| Transportation and Warehousing | -3,700 | $1,171.11 | 6,619,000 | 6,603,900 |
| Utilities | -1,700 | $2,223.89 | 591,600 | 594,200 |
| Information | 3,000 | $1,873.55 | 2,997,000 | 2,996,000 |
| Financial Activities | 0 | $1,728.75 | 9,255,000 | 9,259,000 |
| Professional and Business Services | -47,000 | $1,561.26 | 22,873,000 | 22,544,000 |
| Private Education and Health Services | 57,000 | $1,143.61 | 26,622,000 | 26,544,000 |
| Leisure and Hospitality | -4,000 | $566.87 | 16,989,000 | 17,075,000 |
| Other Services | 1,000 | $1,030.37 | 5,926,000 | 5,918,000 |
Source: BLS
ADP® National Employment Report
ADP provides an independent (non-government) estimate of private-sector employment and pay, based on data derived from ADP client payrolls. According to ADP®, In collaboration with Stanford Digital Economy Lab.
Compared to the Seasonally adjusted -28,000 reported by the Bubble Chart or the actual calculated -136,000 ADP is optimistic and says there were 233,000 new jobs. Of course, this could be because people were taking on an additional part-time job.
ADP: Private employers added 233,000 jobs in October
- Job creation hit its highest level since July 2023 as the economy worked through hurricane recovery. Manufacturing was the only sector to shed jobs.

Source: ADP®
ADP Private Employment by Establishment Size
October ADP Changes:
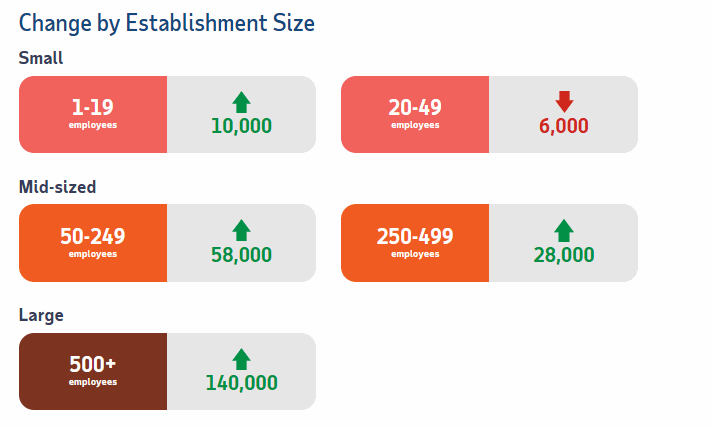
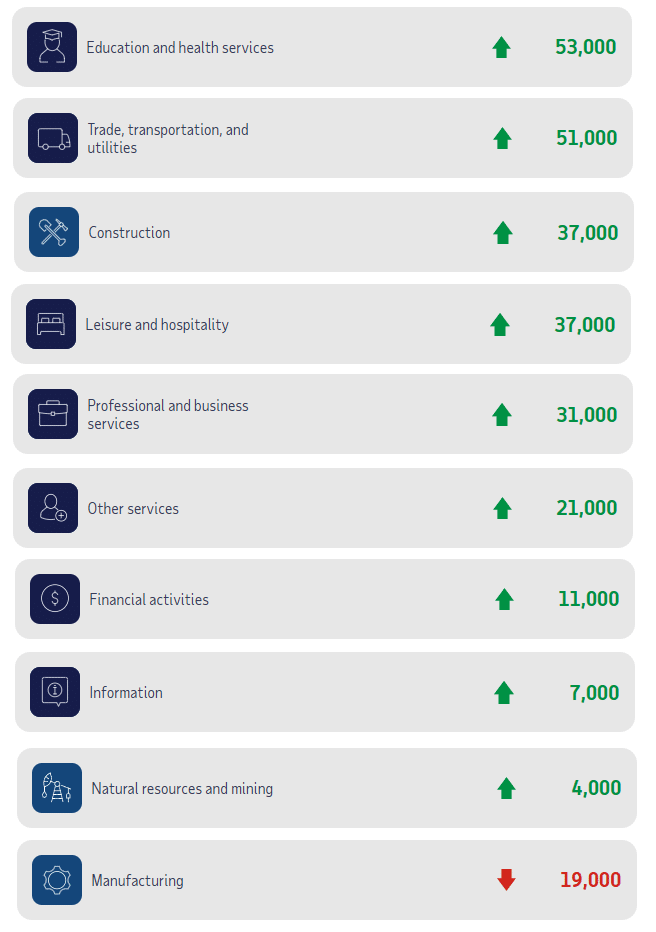
ADP Job Gainers / Losers
ADP provides an entirely different picture of the job situation compared to the BLS perspective. While the BLS says multiple sectors lost jobs, ADP says only Manufacturing lost jobs. The only sector they seem to agree on is Education and Health, with only a few thousand difference. Everything else is vastly different.
Unemployment
Seasonally Adjusted Unemployment is unchanged at 4.1%.
Labor Force Participation Rate
The LFPR is down from 62.7% to 62.6%.
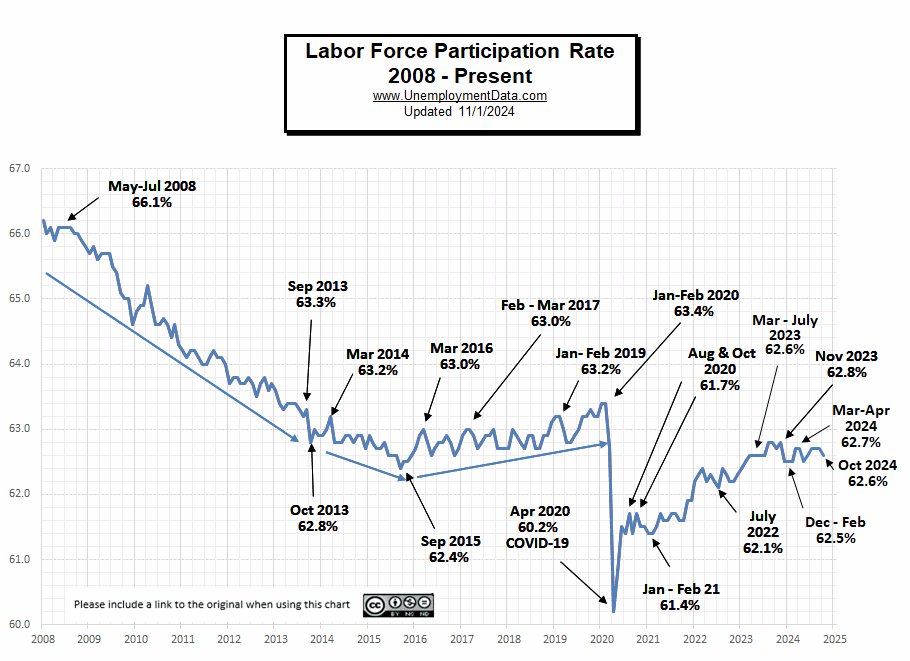 See Labor Force Participation Rate for more information.
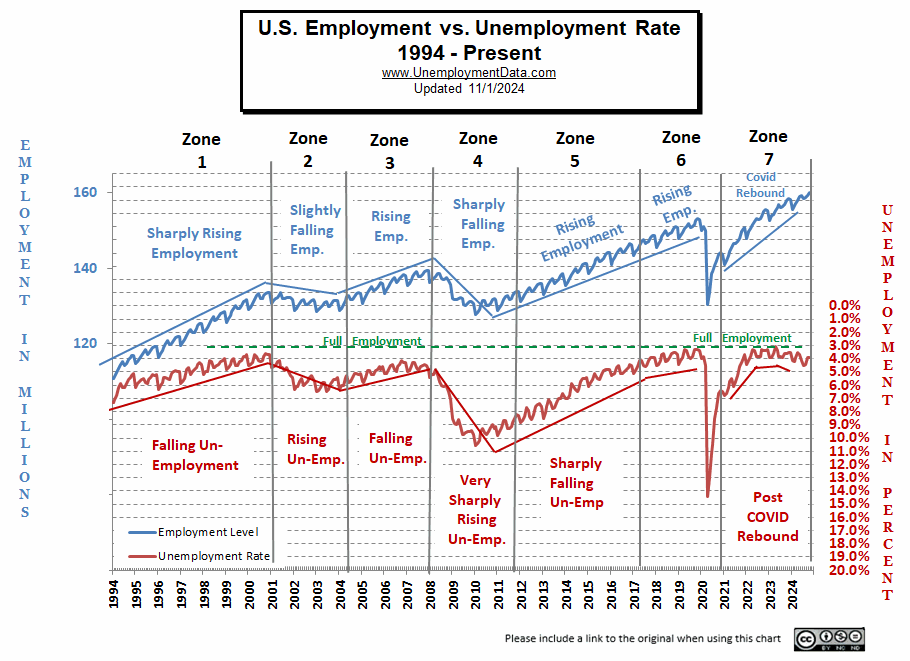
Less Than Full Employment
This chart compares employment levels with the (inverted) unemployment rate.
Full Employment is when everyone who wants a job has one. It is generally considered to be around 3%. After the unemployment rate almost touched the magic full employment line in April 2023, it began moving away (i.e., higher unemployment).
Note: The Unemployment rate is inverted to track the employment rate. Neither is Seasonally Adjusted. For more information see Employment vs. Unemployment.
Note: Full employment is not considered to be at zero percent because even when employers are having difficulty finding employees, some people are still unemployed due to either:
- structural unemployment (mismatch between worker skills and job requirements, i.e., not enough training) or
- frictional unemployment There will always be people who have quit or have lost a seasonal job and are in the process of getting a new job. Or
- Simply because they quit their job knowing it would be easy to find another (hopefully better) job.
Seasonally Adjusted U1 through U6 Unemployment Rates
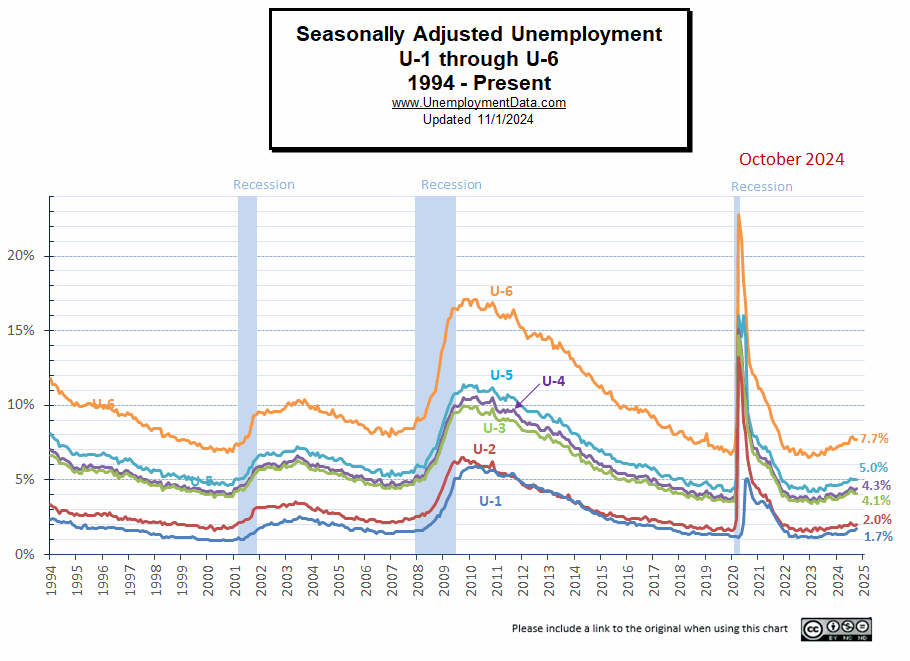 For more information about the various measurements of unemployment, see What Is U-6 Unemployment?
Seasonally Adjusted Unemployment by Education
This chart does refute the idea that getting a college education doesn’t help you find a job. Those with some college have half the unemployment level than someone without a High School diploma. But it doesn’t show whether they are “underemployed” i.e. working as a Barista at Starbucks or flipping burgers at McDonalds. And these numbers only apply to people over the age of 25 (so they have had some time to settle in).
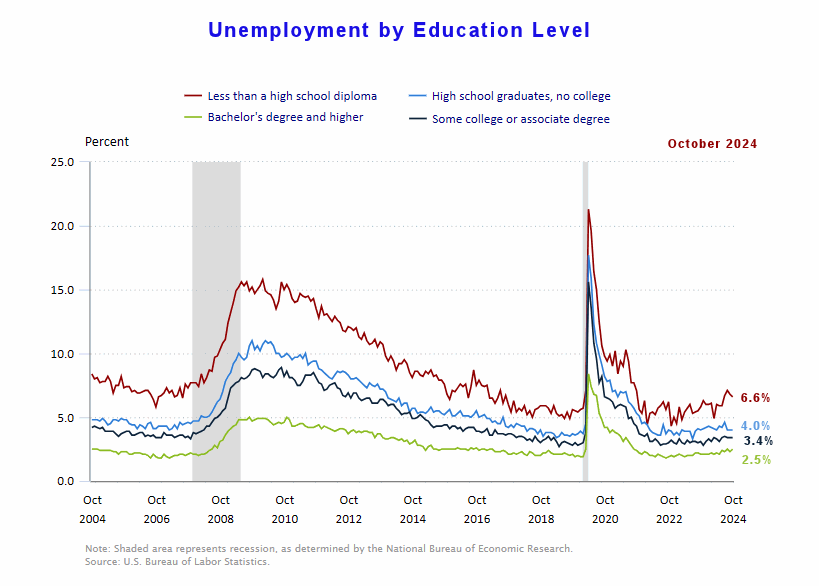 Source: BLS
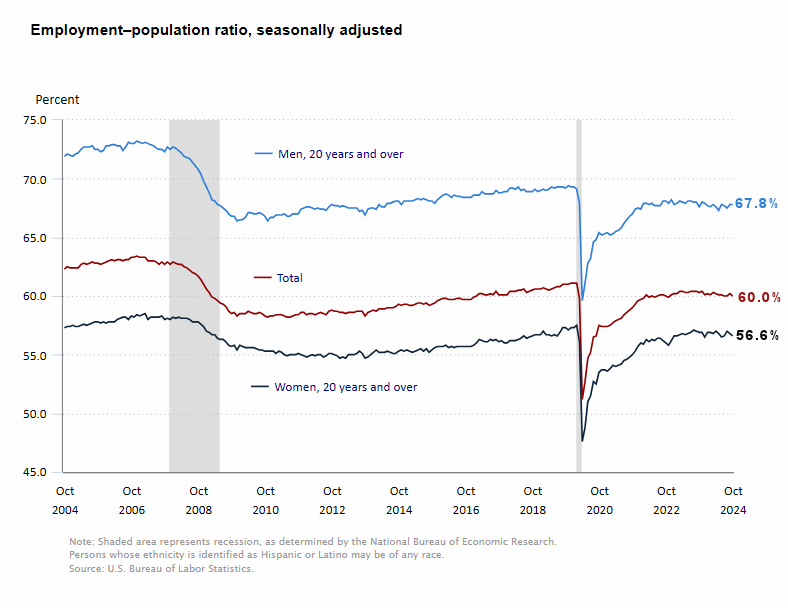
Employment-Population Ratio
This charts shows the Employment-Population Ratio by Gender with a total of 60.0% of the population working (down from 60.2% last month). It also shows the breakdown by gender. Men make up a much larger portion of the workforce, i.e., 67.8% of men are employed and only 56.8% of women are employed. But…
As you can see 20 years ago, back in 2004, almost 72% of men were working and 56.6% of women were working. In 2008 the Great Recession caused a massive decline in employment for both men and women. By December of 2009, only 66.4% of men were working and 55.4% of women. Over the next decade, women workers rebounded to 57.5% but men only rebounded to 69.3%.
Now less than 68% of men are working and 56.6% of women are working, so it isn’t women who have left the workforce but men. Perhaps there are more stay-at-home Dads because their wives could earn more? Or more men decided to retire in 2009 and 2020, rather than bother returning to the workforce.
Employment-Population Ratio by Race
In this chart, we can see that Hispanics and Asians tend to have the highest percentage of their populations employed.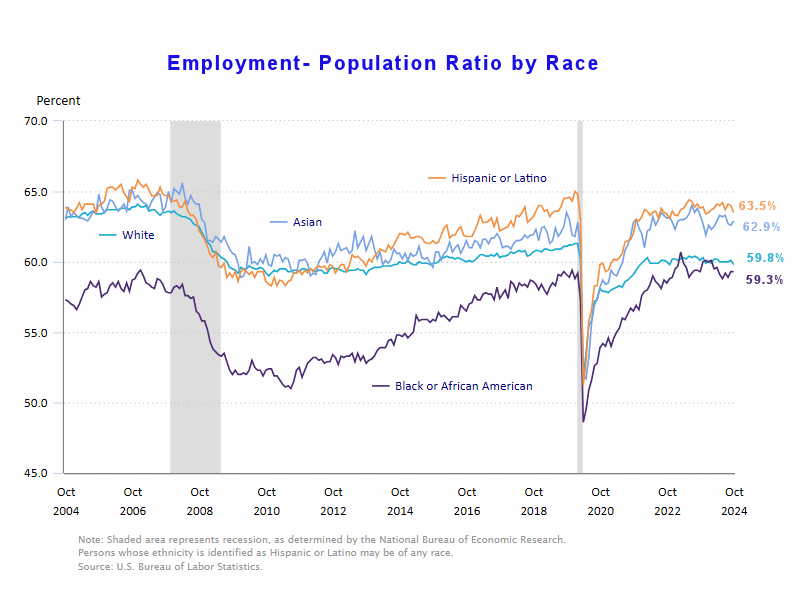
Read more on UnemploymentData.com.
- Can We Trust the September Unemployment Numbers?
- September Jobs Report
- Have Wages Kept Up With Inflation?
- BLS Erases 800,000 Jobs
From InflationData.com
- September Inflation Falls
- FED Interest Rates
- Gold Rallies on LOWER August Inflation?
- What Causes Stagflation?
- Inflation Causes Inequality
From Financial Trend Forecaster
- NYSE ROC
- NASDAQ ROC
- Crypto ROC – BTC and ETH
- China’s Monetary Bazooka
- How Much is the Money Supply Growing?
- Is Gold Overpriced?
- Are Some Forms of Taxation Worse Than Others for the Economy?
- Are Price Controls a Good Idea?
- Modern Monetary Theory (MMT)
- Invest Like Warren Buffet
- Gold Prices: The calm before a record run
- This Trend Will Likely Soon Rock the U.S. Financial System
- Elliott Wave Analysis of Bitcoin
- Is a China-Taiwan Conflict Likely? Watch the Region’s Stock Market Indexes
From OptioMoney
- Tips for Mastering the Art of Bargaining and Negotiation After Moving to a New Country
- Consumer Culture Contrasting Spending Habits in the US and Europe
- Financial Considerations When Moving to Florida
- Splitting Your Golden Years:
- Home-Buying Guide for Newlyweds
From Your Family Finances