
![]()
Employment Up – Unemployment Also Up?
- Unadjusted Employment rose from 153.197 million to 154.369
- Labor Force Participation is Down from 62.3% to 62.2%
- Adjusted U-3 was Up from 3.5% to 3.7%
- Unadjusted U-3 was Up from 3.3% to 3.4%
- Unadjusted U-6 was Down from 6.4% to 6.3%
The U.S. Bureau of Labor Statistics (BLS) released its employment / unemployment report for October on November 4th.
According to the Commissioner of the U.S. Bureau of Labor Statistics:
“Nonfarm payroll employment increased by 261,000 in October, and the unemployment rate rose to 3.7 percent. Notable job gains occurred in health care, professional and technical services, and manufacturing. Monthly job growth has averaged 407,000 thus
far in 2022, compared with 562,000 per month in 2021.”
You can read the full BLS report here.
As usual, they are talking about “Seasonally Adjusted Jobs” from the “Household Survey” rather than looking at the results reported by actual companies in the BLS “Establishment Survey”.
Looking at the Establishment Survey report, we see…
Originally the BLS reported employment of 153.073 million for September, which they adjusted up to 153.197 million. So, 124,000 additional jobs appeared for September.
October gained an additional 1,272,000 jobs bringing the total up to 154.369 million.
Initially, the market shot up under the news but as the day progressed the market lost most of its gains.
See November FED Announcement Rocks Stock Market for more market info.
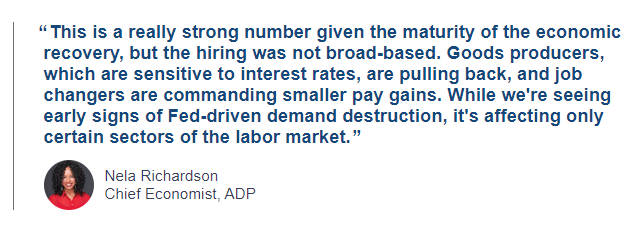
ADP® National Employment Report
According to ADP In collaboration with Stanford Digital Economy Lab
Private employers added 239,000 jobs in October
- Employers created 239,000 jobs in October, up from a revised 192,000 in September as restaurants, retailers and the travel sector ramped up hiring in advance of the year-end holidays.
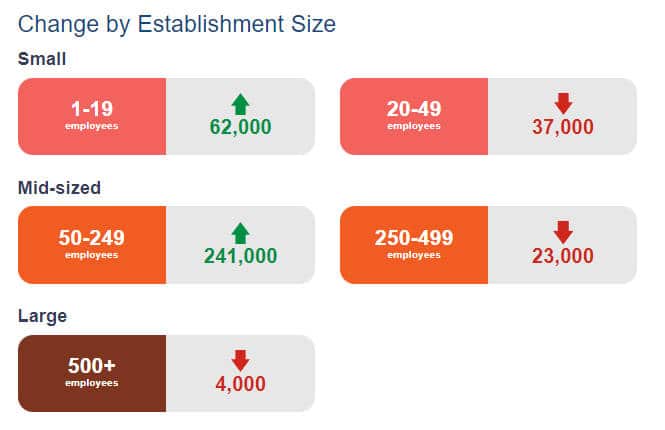
ADP also lists increases by “firm size”.
At some point, it may look like small-size firms (i.e. 1-19 employees) are increasing, while everything else is decreasing, but that could simply be the result of people starting companies because they can’t find any other jobs (although this isn’t currently the case). Last month, there were increases across the board. This month’s results were mixed.
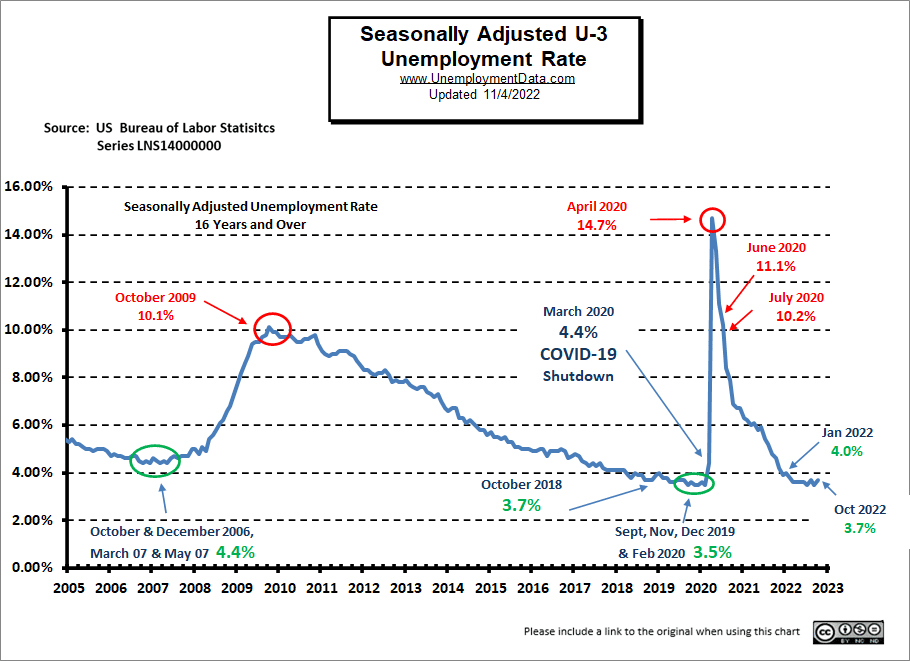
Unemployment
Looking at the chart for unemployment, we see that despite the increase in the number of people employed unemployment still ticked upward slightly.
Employment –Establishment Survey
Looking at the chart for employment, we see that current employment (154.369 million) is now above the 2019 peak (153.095 million) although the civilian population is 5 million higher now.
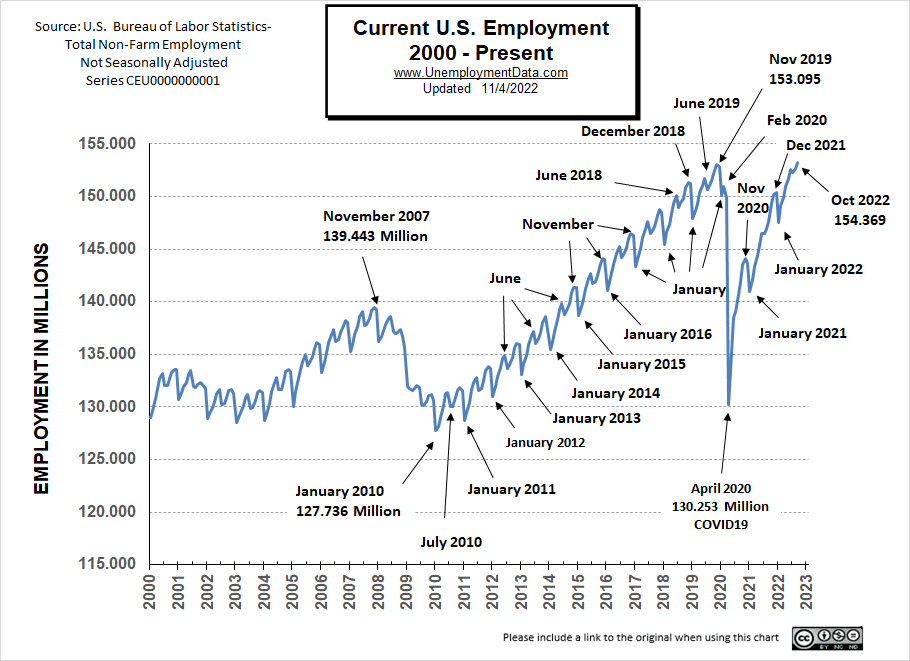
See Current Employment for more info.
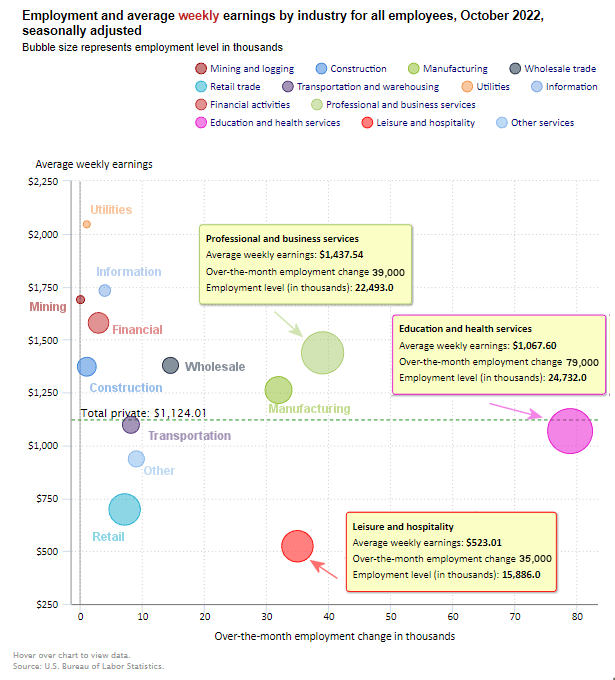
October 2022 Employment by Sector
The employment “bubble chart” is a quick and easy way to see how each sector performs on a seasonally adjusted basis. The Bubble’s Size tells us the total Employment for that industry (i.e., larger bubbles mean more people are employed in that sector).
The bubble’s location on the chart tells us that there has been a change in Employment Levels over the most recent month… A bubble further to the right indicates larger job growth. A bubble’s vertical location on the chart shows the average industry salary.
In October, Leisure and Hospitality, Education, Professional Services, and Manufacturing, were the big gainers.
Average Weekly Wages Rose
$1,124.01 in October , $1,119.87 in September, $1116.42 in August, $1,116.54 in July, $1,106.76, in June, $1,105.47 in May and $1,102.01 in April, and $1,086.46 in December 2021.
 Click for a larger image.
Remember, these are Seasonally Adjusted Numbers, so they aren’t cumulative!
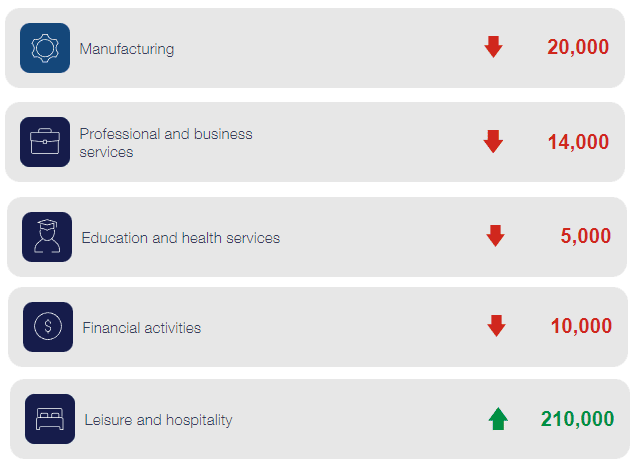
Note: Although the BLS says the Manufacturing, Professional, Education, and Financial sectors increased, ADP says they actually decreased. On the other hand ADP shows a much larger increase in Leisure than the BLS shows.
ADP Change by Sector
Employment and Average Weekly Earnings by Industry
October 2022, Seasonally Adjusted Employment
We’ve added another column to the table below that shows the employment levels that the BLS reported the previous month. Note that although they may claim that there was a “monthly increase”, there isn’t always a real increase, you can’t just subtract last month’s “employment level” from this month’s level. This is due to “seasonal adjusting”. We’ve marked strange instances with an asterisk *.
| Industry | Monthly Increase | Average Weekly Earnings | Employment Level October | Employment Level September |
| Total Private Employment | 233,000 | $1,124.01 | 130,958,000 | 130,736,000 |
| Mining and Logging | 0 | $1,689.07 | 634,000 | 633,000 |
| Construction | 1,000 | $1,372.00 | 7,721,000 | 7,719,000 |
| Manufacturing | 32,000 | $1,261.69 | 12,922,000 | 12,880,000 |
| Wholesale trade | 14,600 | $1,378.18 | 5,923,100 | 5,909,200 |
| Retail trade | 7,200 | $697.12 | 15,829,400 | 15,841,700* |
| Transportation and Warehousing | 8,200 | $1,097.40 | 6,526,400 | 6,528,700* |
| Utilities | 1,100 | $2,045.10 | 544,300 | 541,900 |
| Information | 4,000 | $1,731.93 | 3,043,000 | 3,043,000* |
| Financial Activities | 3,000 | $1,579.13 | 8,971,000 | 8,957,000 |
| Professional and Business Services | 39,000 | $1,437.54 | 22,493,000 | 22,473,000 |
| Education and Health Services | 79,000 | $1,067.60 | 24,732,000 | 24,645,000 |
| Leisure and Hospitality | 35,000 | $523.01 | 15,886,000 | 15,845,000 |
| Other Services | 9,000 | $936.05 | 5,733,000 | 5,719,000 |
Source: BLS
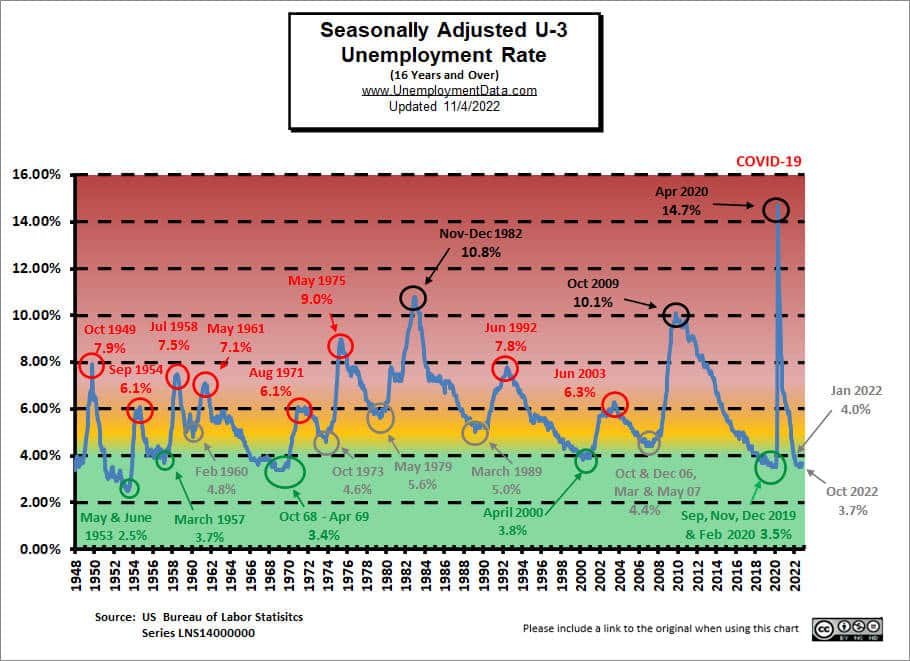
Unemployment Still Historically Low
Unemployment levels are still in the historically low territory. After all, the FED did pump unprecedented TRILLIONS into the economy to get us to this place.
See: FED Actions for more info.
But we can see that Seasonally Adjusted U-3 is definitely in the “Green” territory.
 Click for a larger Image
October 2022 Labor Force Participation Rate
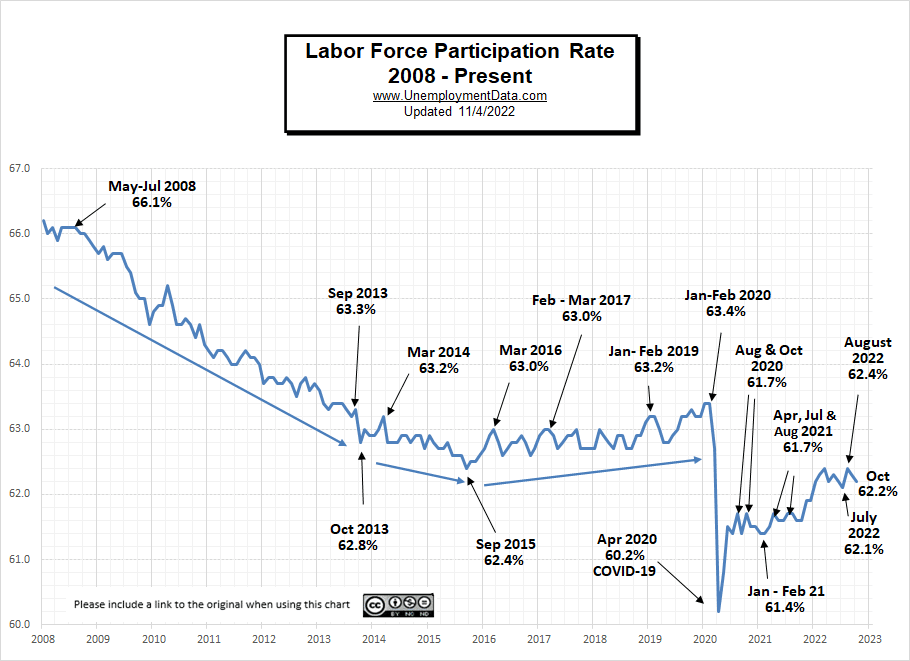 See Labor Force Participation Rate for more information.
Seasonally Adjusted U1 through U6 Unemployment Rates
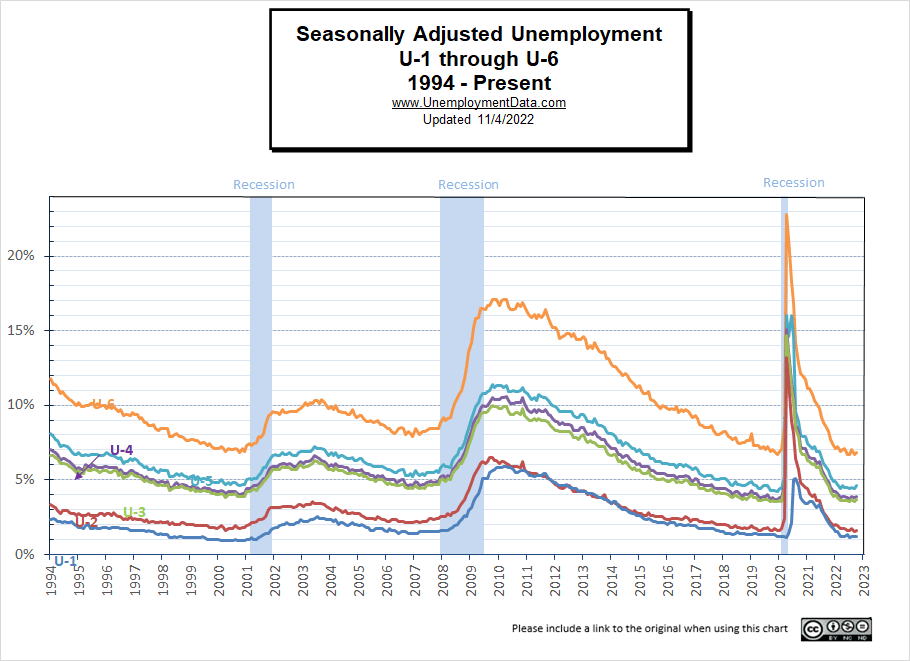
For more information about the various measurements of unemployment, see What Is U-6 Unemployment?
Read more on UnemploymentData.com.
- Love to Drive? These 6 Jobs Are For You
- September Unemployment Falls… Dragging Market Down
- Injured on the Job? 3 Things to Immediately Do
- 5 Signs It’s Time to Make a Career Change
- Building Confidence to Help You Reenter the World
From InflationData.com
- November FED Announcement Rocks Stock Market
- What is the Reverse Wealth Effect and Why Does the FED Want It?
- September 2022 Inflation Virtually Unchanged
- Jerome Powell “Channels” His Inner Paul Volcker
- August 2022 is Actually Disinflationary
- Everything They Tell You About Inflation is Wrong
- Will Corn Prices Drive Up Inflation?
- Two Ways to Destroy the Economy: Hyperinflation and Central Planning
From Financial Trend Forecaster
- Moore Inflation Predictor
- NYSE ROC
- NASDAQ ROC
- Latest Recession Alarm
- Housing Is Getting Less Affordable
- Are Housing Prices Set to Crash?
- Half-Way to the Stock Market’s Worst Case Scenario
- Don’t Fight the FED
From OptioMoney.com
- Warning Signs You’re On the Road to Financial Catastrophe
- Money Habits That Can Help You Retire Early
- 7 Ways to Save Money When Living in a Big City
- How Addiction Can Cause Financial Trouble
- Common Mistakes to Avoid When Investing in Real Estate
From Your Family Finances