
November 2021 Unemployment report from the Bureau of Labor Statistics (BLS)
![]()
- Unadjusted U-3 was Down from 4.3% to 3.9%
- Adjusted U-3 was Down from 4.6% to 4.2%
- Unadjusted U-6 was Down from 7.7% to 7.4%
- Labor Force Participation Up 61.6% to 61.8%
- Unadjusted employment rose from 149.226 million to 150.004 million
Although November’s job numbers are generally an improvement over October, Bloomberg called them”weird” and “the smallest jobs gain this year”. This jobs report is so weird because retail employment is DOWN by -20,400 in a month, known for increased retail employment. Market commentators are also blaming the Jobs report for Friday’s market drop.
According to the Commissioner of the U.S. Bureau of Labor Statistics:
“Nonfarm payroll employment rose by 210,000 in November, and the unemployment rate fell by 0.4 percentage point to 4.2 percent. Notable job gains occurred in professional and business services, transportation and warehousing, construction, and manufacturing. Employment in retail trade declined over the month.”
As usual, they are talking about “Seasonally Adjusted Jobs” from the “Current Population Survey (CPS)” rather than looking at the results reported by actual companies in their “Current Employment Statistics survey (CES).”
But looking at the CES report, we see…
Initially, the BLS reported 149.217 million for October, which they adjusted to 149.226 million. For November, they are reporting 150.004 million,
which is an increase of 787,000 jobs based on their original estimates or an increase of 778,000 based on their updated numbers.
Labor Force Participation Rate
Until November, Labor Force Participation Rate (LFPR) had been bouncing between 61.4% and 61.7% for over a year. The one bright spot in the November Jobs report was the LFPR which rose to 61.8%.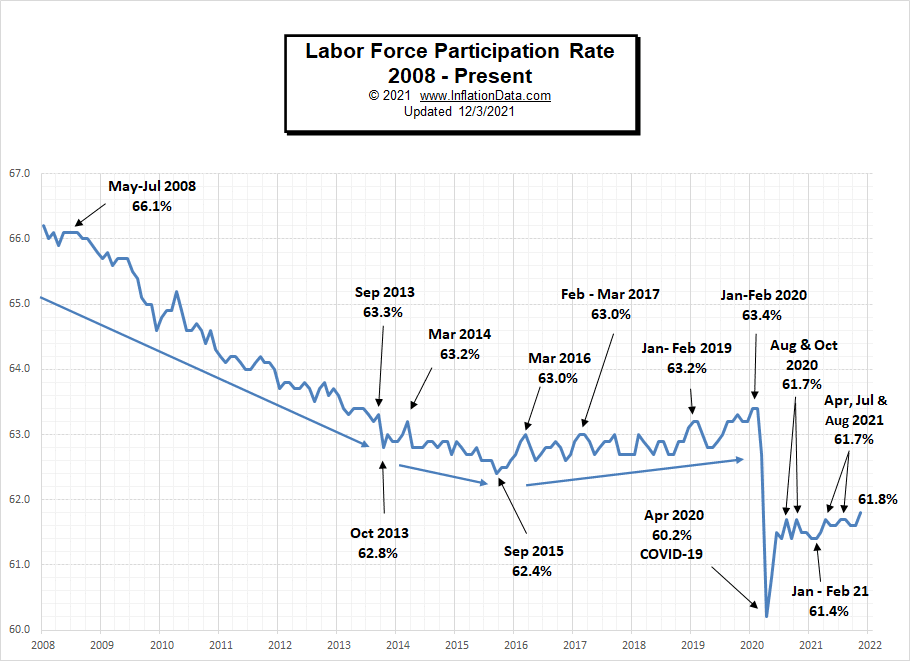
As we explain in the page on the Labor Force Participation Rate, the BLS has a strange definition of Labor Force Participation, and so if you “want a job” but don’t look, you aren’t in the Labor Force.
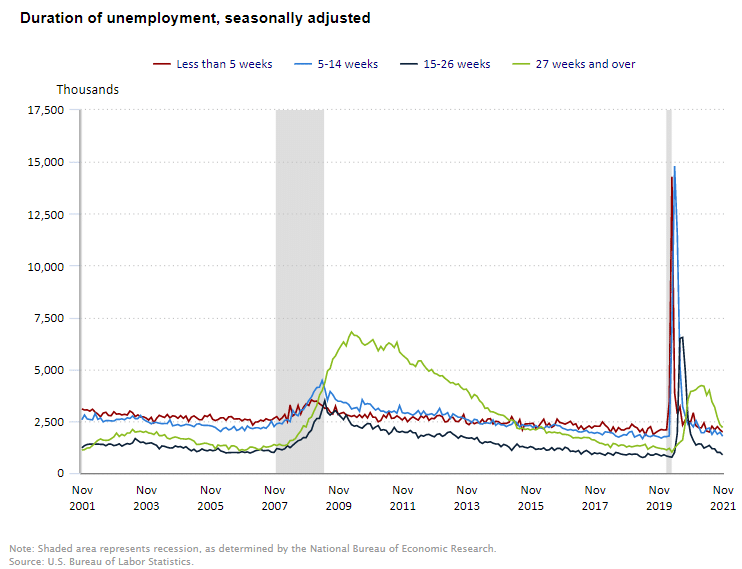
Duration of Unemployment
 Click for larger Image
The number of people who have been long-term unemployed (i.e., over 27 weeks) has fallen sharply while the number of short-term unemployed also continues to fall.
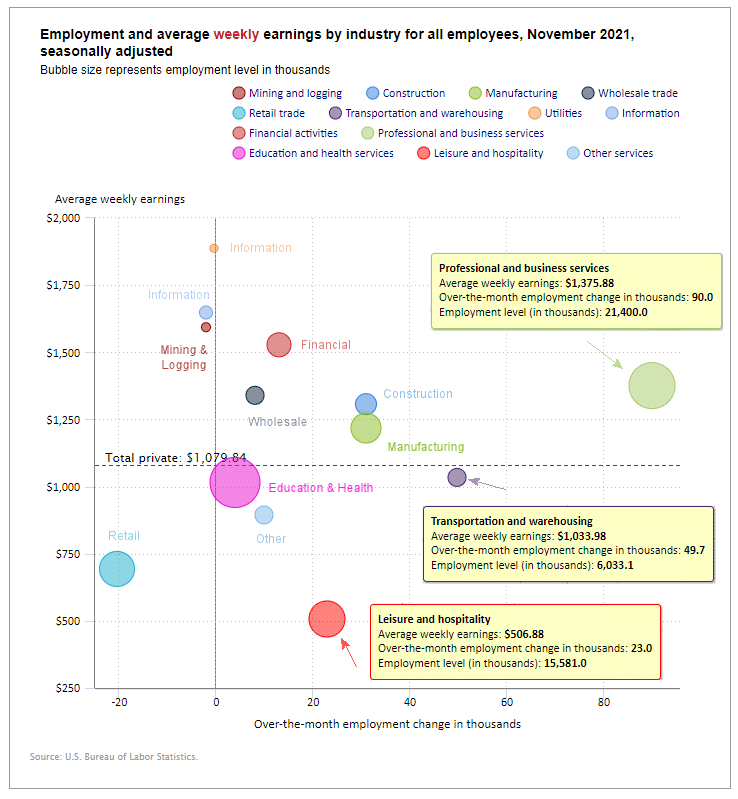
Employment by Sector
The employment “bubble chart” shows each sector separately (on a seasonally adjusted basis). Bubble Size tells us total employment for each industry (i.e., larger bubbles mean more people are employed in that sector). Bubble location on the chart tells us that there is a change in Employment Levels over the most recent month… The further to the right the bubble, the larger the number of jobs, and the higher up on the chart, the larger the average salary.
For a change, Leisure & Hospitality was NOT the largest gainer this month with a gain of only 23,000 jobs. Instead, Professional & Business Services gained 90,000 jobs this month, and Transportation and Warehousing gained 49,700 jobs.
Average weekly wages rose from $1,074.31 in October to $1,079.84 in November.
 Click for larger Image
Employment and Average Weekly Earnings by Industry
November 2021, Seasonally Adjusted
| Industry | Monthly Increase | Average Weekly Earnings | Employment Level |
| Total Private Employment | 235,000 | $1,079.84 | 126,711,000 |
| Mining and Logging | -2,000 | $1,593.30 | 645,000 |
| Construction | 31,000 | $1,306.89 | 7,533,000 |
| Manufacturing | 31,000 | $1,218.06 | 12,546,000 |
| Wholesale trade | 8,000 | $1,339.74 | 5,747,300 |
| Retail trade | -20,400 | $693.31 | 15,434,000 |
| Transportation and Warehousing | 49,700 | $1,033.98 | 6,033,100 |
| Utilities | -400 | $1,887.27 | 536,100 |
| Information | -2,000 | $1,647.98 | 2,791,000 |
| Financial Activities | 13,000 | $1,527.75 | 8,905,000 |
| Professional and Business Services | 90,000 | $1,375.88 | 21,400,000 |
| Education and Health Services | 4,000 | $1,015.32 | 23,772,000 |
| Leisure and Hospitality | 23,000 | $506.88 | 15,581,000 |
| Other Services | 10,000 | $894.19 | 5,787,000 |
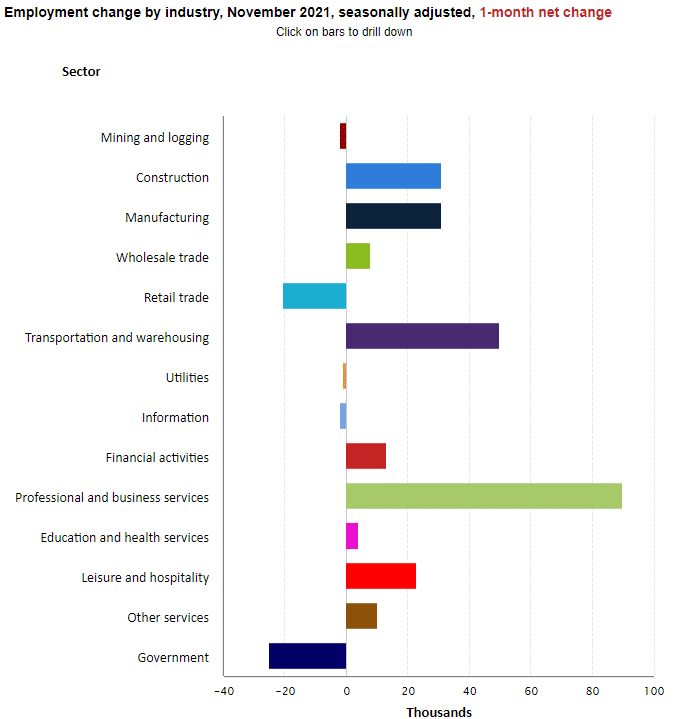
This chart provides another way to look at these monthly numbers. This chart includes government jobs that lost 25,000 jobs in November, 73,000 jobs in October, and 125,000 jobs in September.
Click for larger Image
Source: BLS Employment by Industry
Looking at Employment Change by Industry over the last 12 months we can see the improvement in all the sectors except Utilities which tend to be very stable year over year.
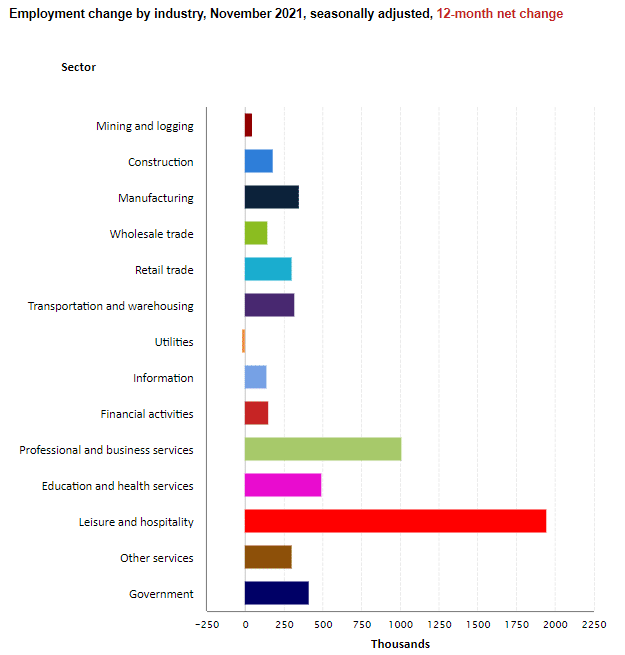 Source: BLS
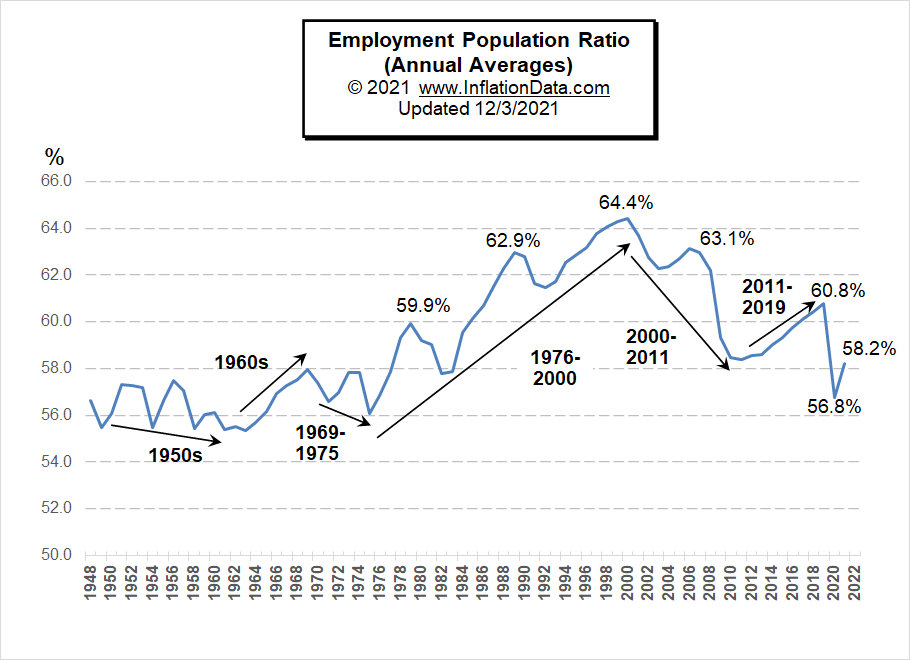
Employment-Population Ratio
Recently we added more coverage of the Employment-Population Ratio. This chart shows the actual percentage of the population that’s working, unlike the Labor Force Participation Rate, which shows the portion of the population working or looking for work.
By looking at annual averages rather than monthly numbers, we can see the long-term trends in the percentage of the population that is working. For more information and to see the full commentary on these trends, see Employment-Population Ratio.
U1 through U6 Unemployment Rates
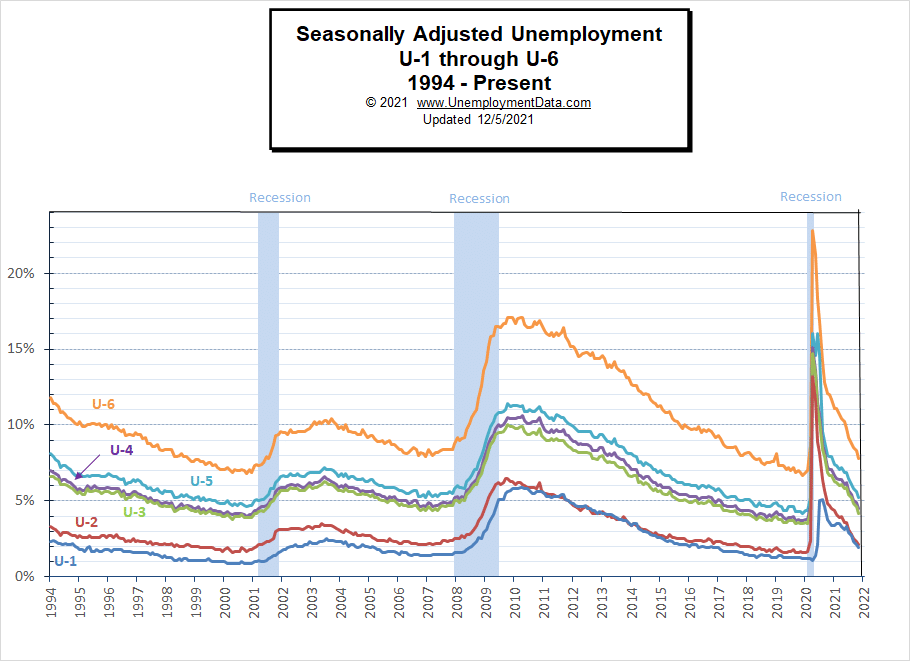
For more information about the various measurements of unemployment, see What Is U-6 Unemployment?
Current Employment
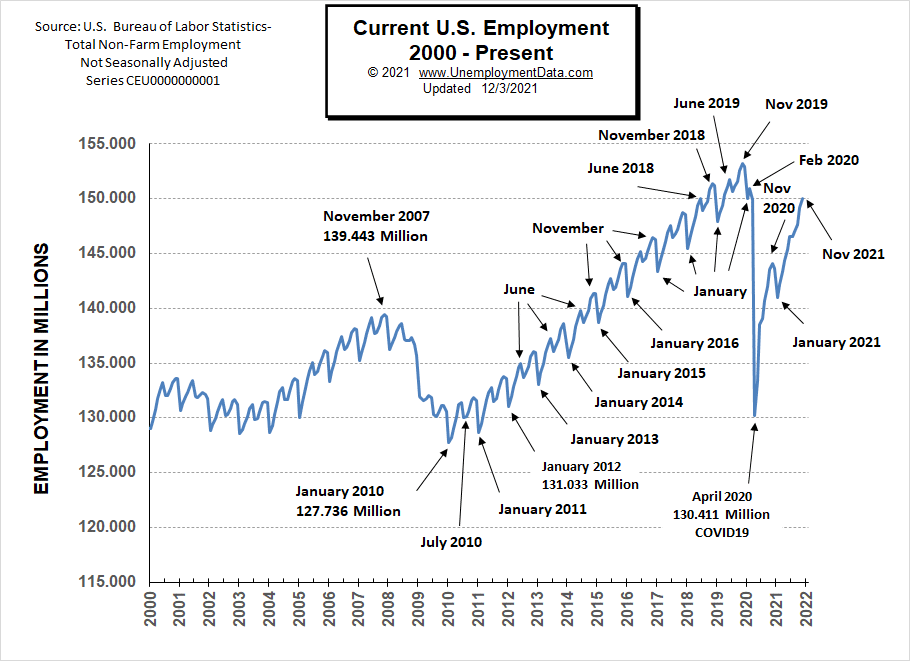
November employment ticked up, but still, 3.173 million below November 2019 levels plus the Civilian Non-Institutional Population has increased by 1.9 million.
See Current Employment for more info.
Unemployment Normalizing
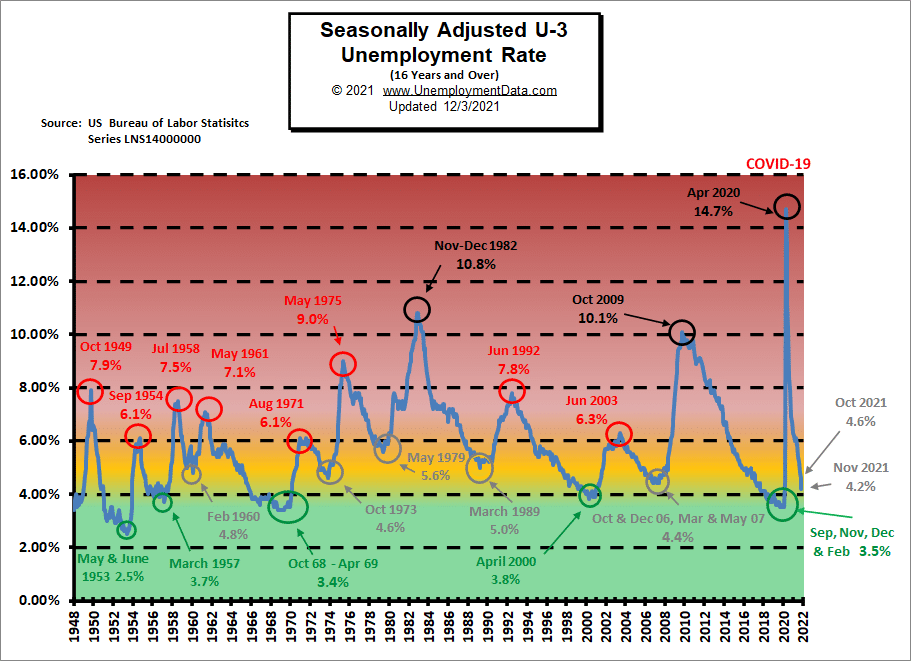
The “red zone” in the chart below indicates things are really bad. Historically “Bad” for the U-3 usually starts at around 6.5%-7% and stops at about 10%, with only three occasions getting above 10%. In 2020 COVID sent unemployment from really good (green zone) to really bad virtually overnight.
The yellow zone (from about 4% to 6%) is the normal operating range, and when unemployment stays in this range, the economy is generally doing OK. Below 4%, the economy is doing great, while above 7%, the economy is in trouble. The adjusted U-3 unemployment rate has fallen from the horrendous 14.7% of April 2020 to 4.2% in November 2021, so it is once again nearing the green zone.
 Click for larger Image
Historical Employment
A high unemployment rate is a significant component of a recession. The blue bars in the chart below indicate official recessions, while the red line shows the Historical Employment Data. Several years after the 2008 crash, employment finally rose above the 2007 peak levels. Then in April 2020, COVID drove the number of people employed below the 2007 peak and approached the lows of the 2008-2010 crash. By August 2020, employment had rebounded above the 2007 peak level, but it remained below the 2019 peak despite an increasing population.
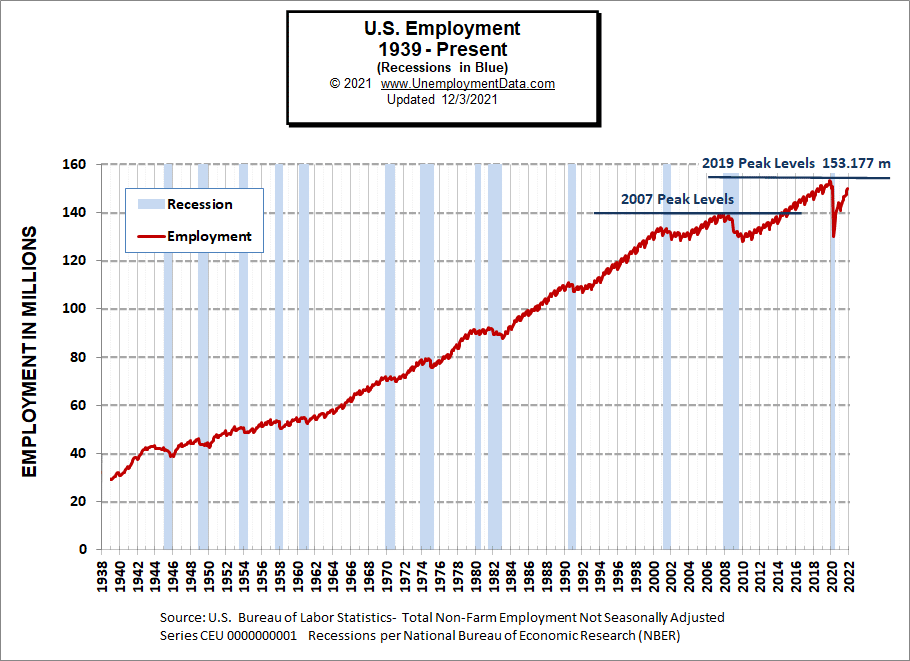
See Historical Employment Data for more info.
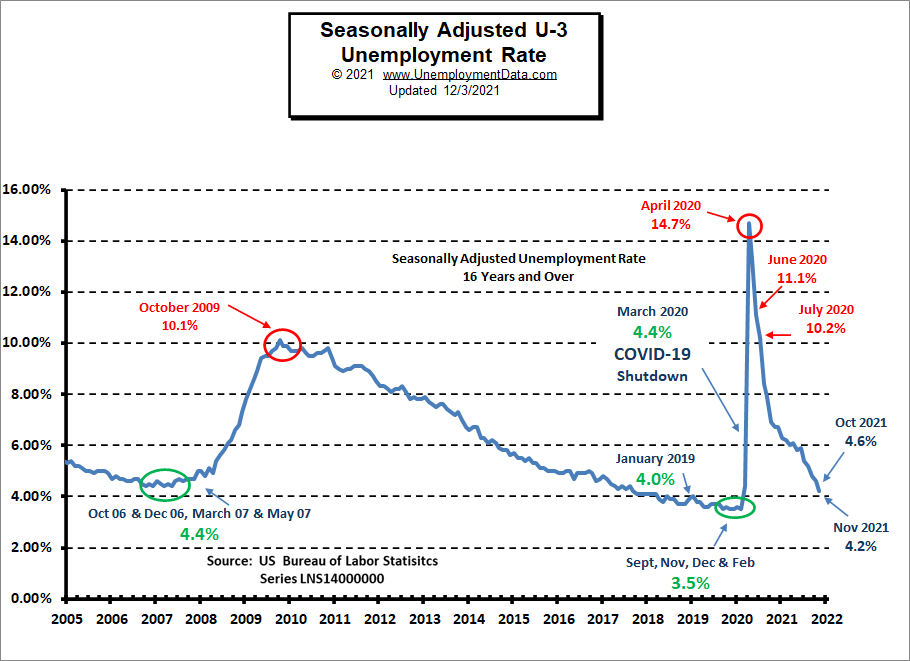
Current Seasonally Adjusted Unemployment
 Click for larger Image
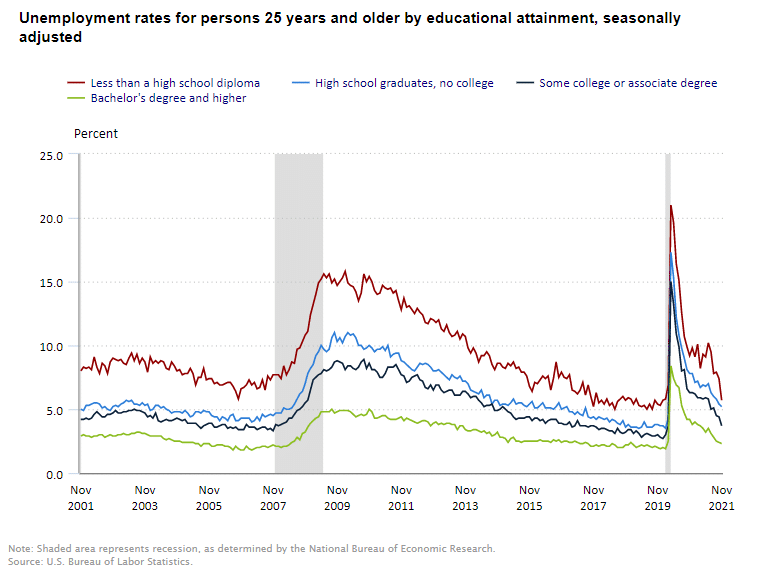
Unemployment by Education
Those with the least education always have the worst employment prospects and are the first to be laid off when the economy declines because they can easily be replaced later. Those with specialized knowledge and/or skills are retained at all costs. The unemployment rate for those with a Bachelors’s degree (or above) is typically between 2% and 3%, except when times are really terrible. In November, the unemployment rate for the most highly educated was 2.4%, while the least educated was 5.7%.
Click for larger Image
If you would like to receive this monthly report and other article updates, click here. You can unsubscribe at any time.
Here are some articles you might enjoy in case you missed them:
Read more on UnemploymentData.com.
- Starting a New Business? Tips to Find Capital to Begin
- Find Opportunities To Boost Your Military Career When You’re In A Slump
- High School Is Sufficient For These Mainstream Careers
- October 2021 Unemployment Down as Expected
- The Spectacular Benefits of a Sales And Marketing Career
From InflationData.com
- Is Bitcoin a Better Inflation Hedge Than Gold?
- How Nixon’s Revolutionary Move Influenced U.S. Inflation For 50 Years
- U.S. Inflation is Not the Only One Increasing
- Inflation: The New Normal?
- Annual Inflation Soars to Highest Level in 31 Years
From Financial Trend Forecaster
- Moore Inflation Predictor
- NYSE ROC
- NASDAQ ROC
- Curing Cancer with T-Cells
- 5 Revolutionary Developments in the Financial Industry
- How Is Technology Affecting Global Trading Markets
- From Pandemic To 2021 Supply Chain Disruption
- Batteries: New Sea-Water Based Battery to Replace Lithium
- Farming: Discovering New Ways to Feed the Planet
- Are Disease Outbreaks Market Indicators?
- Secrets To Maintain A Healthy Trading Psychology
- A Change May Be Nigh for Real Estate
- Will China’s Crackdown Send Bitcoin’s Price Tumbling?
- Why a Financial “Panic” May Be Just Around the Corner
From OptioMoney.com
- Can You Make Money with a Home Music Studio?
- Quick Guide To The Secrets Of FHA Loans
- Creative Ways to Make Money In Retirement
- Covering the Cost of Cancer
- What to Consider When Shopping for Health Insurance
From Your Family Finances