• About WordPress
    • WordPress.org
    • Documentation
    • Learn WordPress
    • Support
    • Feedback
  • Log In
  • Skip to primary navigation
  • Skip to main content
  • Skip to primary sidebar
  • Home
  • Contact us
  • Related Sites
    • InflationData.com
    • Financial Trend Forecaster
    • Your Family Finances
    • Elliott Wave University
    • Optio Money
  • About
    • Terms of Use
    • Disclaimer & Disclosure
    • Privacy Statement
  • Sitemap
    • 2009-2010 Posts
    • 2011 Posts

UnemploymentData.com

Your Source for Employment and Unemployment Data

Unemployment
  • Charts
    • Current Unemployment Rate Chart
    • Current Employment Rate (Chart and Data)
    • Current Employment vs Unemployment Chart
    • Historical Employment Data
    • Employment Population Ratio
    • Misery Index
  • Unemployment
    • Historical Unemployment Rate Tables
    • What Is U-6 Unemployment?
    • Unadjusted vs. Seasonally Adjusted U-3 Unemployment Rate
    • BLS vs. Gallup Unemployment Numbers
    • Current U-6 Unemployment Rate
    • What is the Labor Force Participation Rate?
    • What is the Real Unemployment Rate?
  • Employment
    • Current Employment Rate (Chart and Data)
    • Historical Employment Data
    • Contacting a Live Person at the State Employment Commission
      • How to Talk to a Live Person at the Virginia Unemployment Commission
      • Florida’s FLUID Unemployment Program
    • Benefits
      • Insurance
      • Retirement
    • Careers
    • Employment Costs
    • Experience
    • Government
    • Job Hunting
      • Interview
      • Resume
  • Find Articles
  • Education
    • Skills
  • General
    • Small Business
      • Outsourcing
    • Success
You are here: Home / BLS / New Unemployment Numbers- February

New Unemployment Numbers- February

March 13, 2017 by Tim McMahon

On Friday March 10th the U.S. Bureau of Labor Statistics released their Employment and Unemployment numbers for February 2017. The media was making a big deal about these numbers because they represent the “First full month since Trump took office”.

The numbers turned out to be moderately “Bullish” although the Commissioner’s statement said, “Total nonfarm payroll employment increased by 235,000 in February, and the unemployment rate was little changed at 4.7 percent. Employment gains occurred in construction, private educational services, manufacturing, health care, and mining.”

Now,   I’m not complaining… gaining 235,000 jobs is certainly better than losing them but what’s the big deal?  Well, first of all, the big deal is that it isn’t really 235,000 jobs. Those are “Seasonally Adjusted” numbers. So that means it is 235,000 more than usual for February. If you look at the total actual (not seasonally adjusted) numbers you will see that in January there were 143,261,000 non-farm jobs in the U.S. and in February there were 144,271,000 jobs for a net gain of  1,010,000 jobs. Over a million jobs sounds much better!

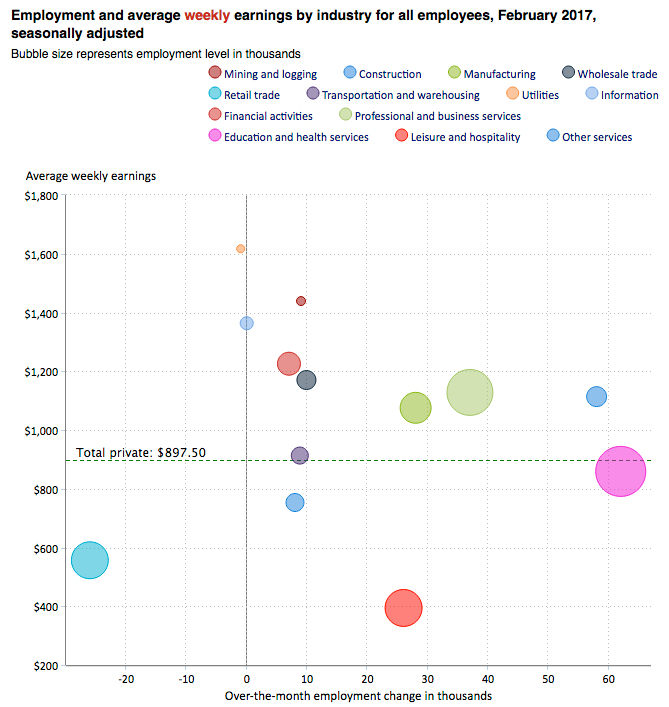
Plus a lot depends where the jobs come from. If we look at the chart above we see some dots above the line and some below. The size of the dots represents current employment level in thousands. The dotted line represents the average weekly income. So we want to see lots of big dots above the dotted line and to the right of the zero line. If the gains are all coming from Leisure and Hospitality (Red Dot center bottom) that isn’t good because they are low paying jobs.

From the chart we can see that Retail trade (light blue lower left corner) lost more than 25,000 jobs but they are relative low paying jobs while Leisure and Hospitality gained roughly the same number of jobs (even lower paying… not good).

Sort of good news is that Education and Health services (big pink dot center right) gained over 60,000 jobs. These are average paying jobs but there were quite a few created. The really good news is all the dots in the upper right quadrant. Things like Manufacturing,  Professional & Business Services, Construction and Mining & Logging. All high paying jobs gaining significant numbers.

Remember the Commissioner’s statement “…Employment gains occurred in construction, private educational services, manufacturing, health care, and mining.” All on the higher paying spectrum.

As far as Unemployment rates: Unadjusted U-6 fell from 10.1% in January to 9.5% in February. Unadjusted U-3 fell from 5.1% in January to 4.9% in February. And adjusted U-3 fell from 4.8% in January to 4.7% in February.

Gallup’s unadjusted U-3 fell from 5.8% in January to 5.5% in February. Gallup’s Unadjusted U-6 fell from 14.1% in January to 13.7% in February. The BLS’ Labor Force Participation rate rose 1/10th percent from 62.9% to 63% while Gallup’s “Good Jobs Index” fell 1/10th percent from 44.8% to 44.7%.

See Also:

  • Unemployment Rate Chart – The seasonally adjusted unemployment rate from 1948 to the present is one of the most watched statistics. Where is it now and should you trust it?
  • U-6 Unemployment Rate– U-6 is the broadest measure of unemployment and includes all classes of Unemployed plus those ”marginally attached” and/or part-time for economic reasons.
  • Current Employment Data – How many jobs are there actually? This chart shows Employment since Jan 2000 and what the current trend is.
  • Historical Employment Data Chart– How Many People Are Actually Employed? This chart shows the actual employment rate without all the mumbo jumbo. It gives a clear picture of  the employment level in the United States from 1939 to the Present. When employment is rising the economy is growing. When the employment rate levels off or declines times are not so good. Take a look and see how employment rates correspond to recessions over time.
  • Misery Index– Created by economist Arthur Okun to help gauge the level of misery the average person is suffering. It is a combination of the inflation rate and the unemployment rate.
  • Seasonally Adjusted Unemployment Rate in Table form– If you want to see the actual numbers.

Filed Under: BLS Tagged With: BLS, employment, jobs, unemployment

About Tim McMahon

Work by editor and author, Tim McMahon, has been featured in Bloomberg, CBS News, Wall Street Journal, Christian Science Monitor, Forbes, Washington Post, Drudge Report, The Atlantic, Business Insider, American Thinker, Lew Rockwell, Huffington Post, Rolling Stone, Oakland Press, Free Republic, Education World, Realty Trac, Reason, Coin News, and Council for Economic Education. Connect with Tim on Google+

Primary Sidebar

Search Site

Sponsored:

URGENT: These Stocks Stand Poised to Benefit from President Trump's Trade Wars!

As the Trump administration moves ahead with aggressive tariff policies on key imports, the mainstream media is scrambling.

This Free Report - which you can download now - reveals the names and ticker symbols of 5 Stock Poised to Benefit Most from President Trump's Tariff Wars.

Click Here to Download Your FREE Stock Report Now.

Recent Posts

  • April 2025 Employment / Unemployment Report
  • Would More Jobs Help Social Security?
  • March 2025- Employment / Unemployment Report
  • February 2025 Jobs Report
  • January 2025 BLS Employment Report

Resources

  • Bureau of Labor Statistics Current Population Survey Monthly survey of households conducted by the Bureau of Census for BLS. It provides data on the labor force, employment, unemployment, etc.
  • Capital Professional Services Providing web design and development and Internet marketing services
  • Elliott Wave University Using the Elliott Wave Principle to improve investment performance
  • Financial Trend Forecaster Featuring Moore Inflation Predictor, NYSE Rate of Change and NASDAQ Rate of change
  • InflationData.com Inflation calculators, databases, etc.
  • Intergalactic Web Designers Web design and development services
  • Your Family Finances

Articles by Category

Articles by Date

Disclaimer

At UnemploymentData.com we are not registered investment advisors and do not provide any individualized advice. Past performance is not necessarily indicative of future performance and future accuracy and profitable results cannot be guaranteed.

Privacy & Terms of Use

Privacy Statement & Terms of Use

Do Not Sell My Information

Copyright © 2025 · News Pro on Capital Professional Services, LLC. All rights reserved · Log in