
May 2022 Employment — Bureau of Labor Statistics (BLS) Jobs Report
![]()
- Adjusted U-3 was Unchanged at 3.6%
- Unadjusted U-3 was Up from 3.3% to 3.4%
- Unadjusted U-6 was Up from 6.6% to 6.7%
- Labor Force Participation Up from 62.2% to 62.3%
- Unadjusted Employment rose from 150.964 to 151.773 million
According to the Commissioner of the U.S. Bureau of Labor Statistics:
“Nonfarm payroll employment increased by 390,000 in May, and the unemployment rate remained at 3.6 percent. Notable job gains occurred in leisure and hospitality, in professional and business services, and in transportation and warehousing. Employment in retail trade declined. Nonfarm employment is down by 822,000, or 0.5 percent, from its February 2020 level before the onset of the coronavirus (COVID-19) pandemic.
In May, employment growth continued in leisure and hospitality (+84,000)… Employment in professional and business services increased by 75,000 in May… Transportation and warehousing added 47,000 jobs…”
You can read the full BLS report here.
As usual, they are talking about “Seasonally Adjusted Jobs” from the “Household Survey” rather than looking at the results reported by actual companies in the BLS “Establishment Survey”
But looking at the Establishment Survey report we see…
Originally the BLS reported employment of 150.938 million for April which they adjusted to 150.964 million. So they added 26,000 jobs disappeared for April. They are reporting 151.773 million jobs for May which is actually an increase of 835,000 jobs based on their original estimates or an increase of 809,000 based on their updated numbers.
Surprisingly, Retail LOST -60,700 jobs.
According to Trading Economics:
The US unemployment rate was unchanged at 3.6 percent in May of 2022, the same as in the previous two months, remaining the lowest since February 2020 and compared with market expectations of 3.5 percent. The number of unemployed people increased by 9 thousand to 5.950 million, while employment levels rose by 321 thousand to 158.426 million. Meanwhile, the labor force participation rate edged up to 62.3 percent in May from a 3-month low of 62.2 percent in April.
Stroudsburg PA News headline says “Lowest Unemployment Rate since 1969” … Umm No! Not really… the article text backtracks a little adding the word “about” saying… “about the lowest it has been since 1969.” I suppose that is “almost true” if you disregard the 4 months in 2019 and 2020 when it was lower (i.e. 3.5%) and 3.6% is almost 3.4%. I guess that is what passes for journalism these days.
Employment / Population Ratio
As we can see in the Employment-Population Ratio from May through July 2020, the Employment-Population ratio rebounded from 52.8% to 55.1%. Then the Employment / Population ratio rose steadily throughout 2021, so by May 2021, it was 58.0%. It increased slowly until December when it reached 59.5%. Through May 2022, the employment-population ratio only increased another 0.6% to reach 60.1%.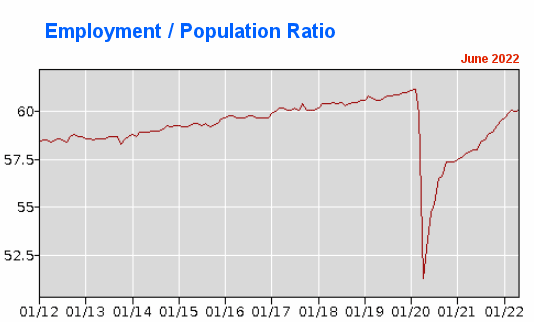
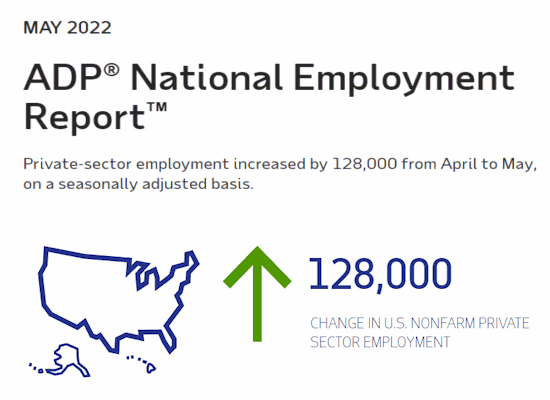
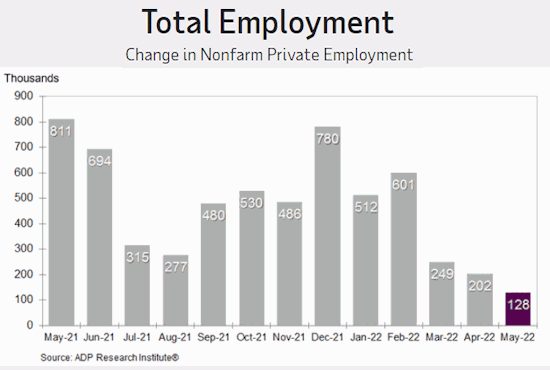
ADP National Employment Report
In addition to the BLS, we can look at the Jobs Report generated by private companies like ADP Research Institute. Once again, ADP numbers are only half of the BLS “Current Population Survey (CPS)” numbers and roughly 1/4 of their “Current Employment Statistics survey (CES)” numbers.
The interesting thing about ADP data is that they also provide breakdowns based on company size. And small companies continue to shrink. Long-term this is NOT GOOD small companies are where the future big companies come from.
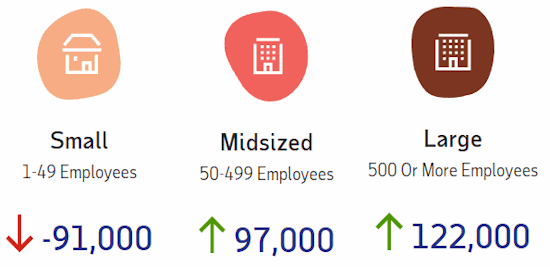 Looking at the total employment changes according to ADP we see that May’s increase in the smallest in the last year. So, post-COVID gains appear to be dying out.
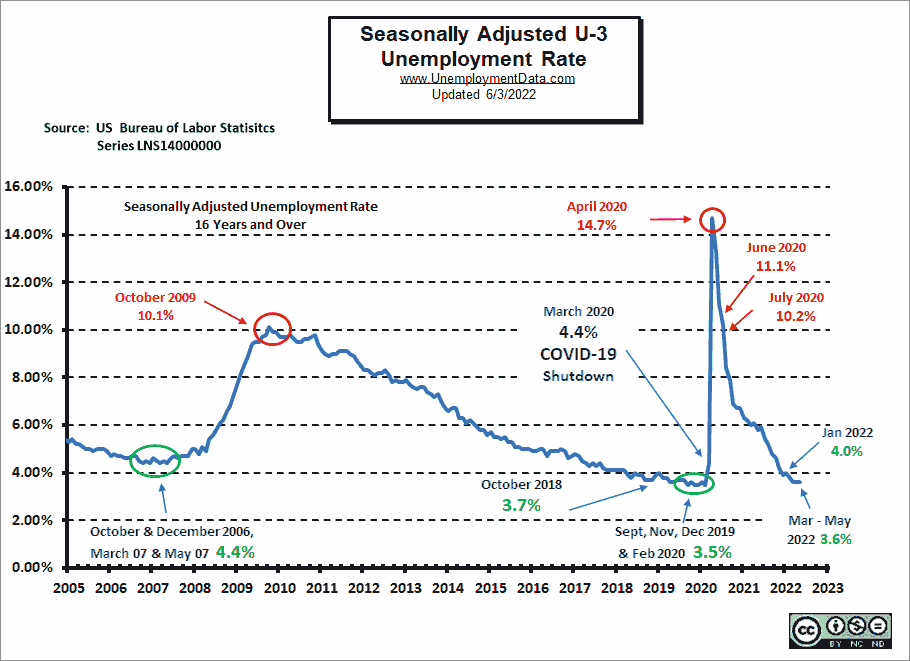
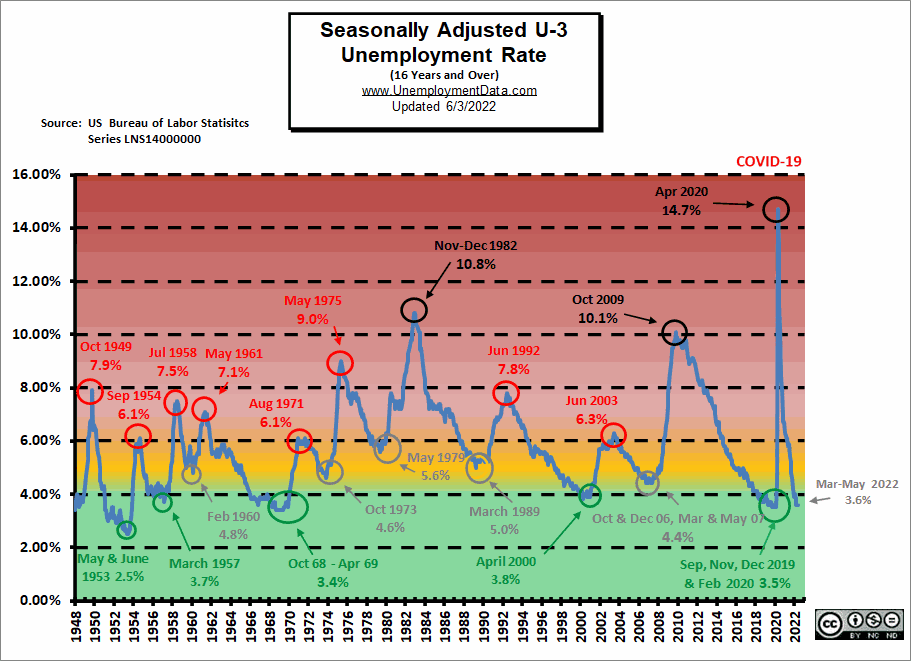
Unemployment Historically Low
Although not quite at “the lowest since 1969” unemployment levels are in historically low territory. After all, the FED did pump unprecedented TRILLIONS into the economy to get us to this place.
See: FED Actions for more info.
But we can see that Seasonally Adjusted U-3 is definitely in the “Green” territory.
 Click for a larger Image
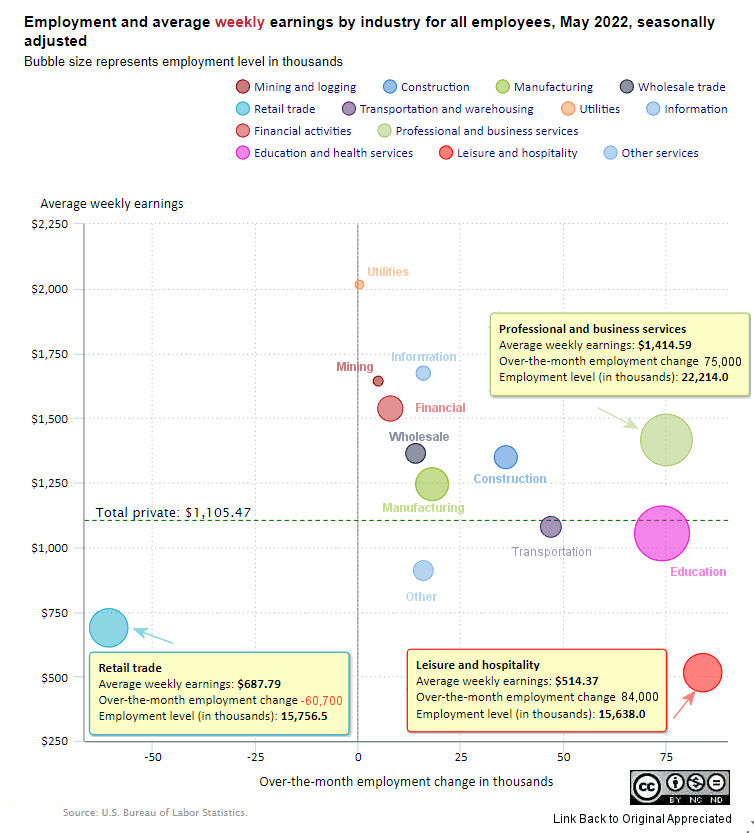
May 2022 Employment by Sector
The employment “bubble chart” is a quick and easy way to see how each sector performs on a seasonally adjusted basis. The Bubble’s Size tells us the total Employment for that industry (i.e., larger bubbles mean more people are employed in that sector).
The bubble’s location on the chart tells us that there has been a change in Employment Levels over the most recent month… A bubble further to the right indicates larger job growth. A bubble’s vertical location on the chart shows the average industry salary.
Average weekly wages $1,105.47 up from $1,102.01 in April, $1,097.86 in March and $1,086.46 in December 2021.
 Click for a larger Image.
Remember, these are Seasonally Adjusted Numbers so they aren’t cumulative! Once again, Leisure and Hospitality was the largest gainer with 84,000 new jobs. Professional and Business Services gained 75,000 jobs. Surprisingly, Retail LOST -60,700 jobs after gaining 29,200 jobs last month.
Employment and Average Weekly Earnings by Industry
May 2022, Seasonally Adjusted Employment
| Industry | Monthly Increase | Average Weekly Earnings | Employment Level |
| Total Private Employment | 333,000 | $1,105.47 | 129,418,000 |
| Mining and Logging | 5,000 | $1,642.20 | 618,000 |
| Construction | 36,000 | $1,347.84 | 7,664,000 |
| Manufacturing | 18,000 | $1,243.51 | 12,768,000 |
| Wholesale trade | 14,100 | $1,362.64 | 5,851,500 |
| Retail trade | -60,700 | $687.79 | 15,756,500 |
| Transportation and Warehousing | 47,000 | $1,078.39 | 6,503,300 |
| Utilities | 500 | $2,015.41 | 539,300 |
| Information | 16,000 | $1,672.99 | 2,967,000 |
| Financial Activities | 8,000 | $1,536.00 | 8,948,000 |
| Professional and Business Services | 75,000 | $1,414.59 | 22,214,000 |
| Education and Health Services | 74,000 | $1,053.24 | 24,258,000 |
| Leisure and Hospitality | 84,000 | $514.37 | 15,638,000 |
| Other Services | 16,000 | $909.57 | 5,692,000 |
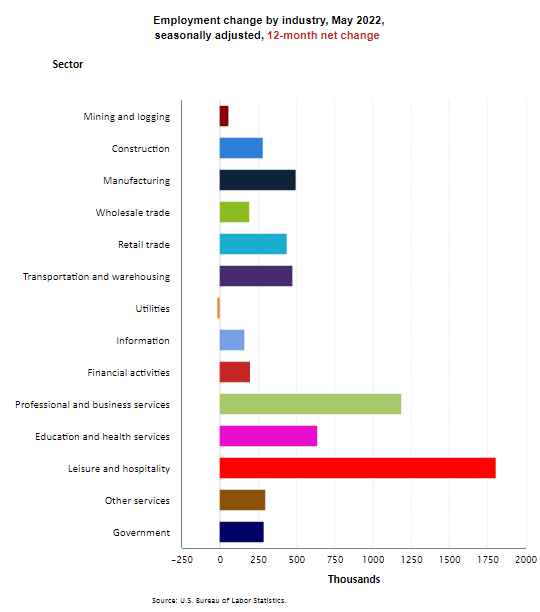
Annual Employment Change by Industry
Looking at Employment Change by Industry over the last 12 months, we can see that Government gained 288,000 jobs over the year while Leisure and Hospitality gained 1,808,000. And Utilities lost -3,000 jobs.
May 2022 Unemployment by Education
College grads only have a 2% unemployment rate, those with some college rose from 3.1% in April to 3.3% in May, while those with less than a High School diploma actually fell from 5.4% in April to 5.2% in May (returning to March levels).
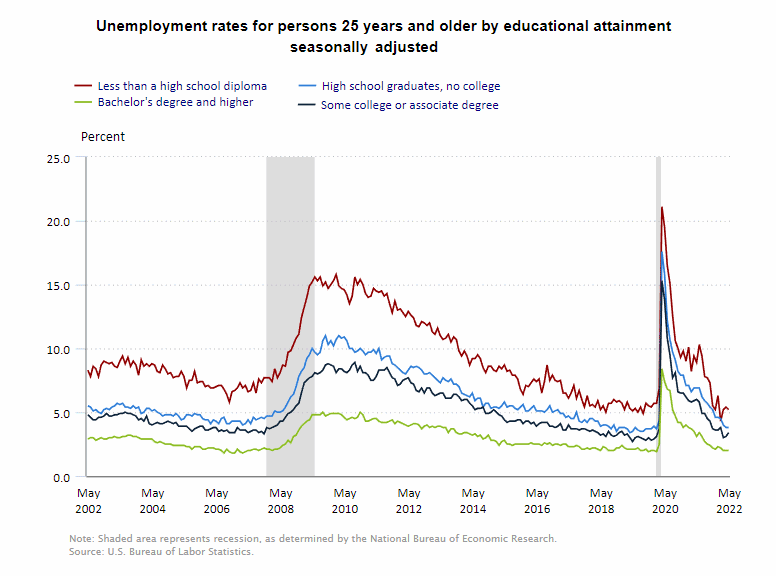
Source: BLS
May 2022 Labor Force Participation Rate
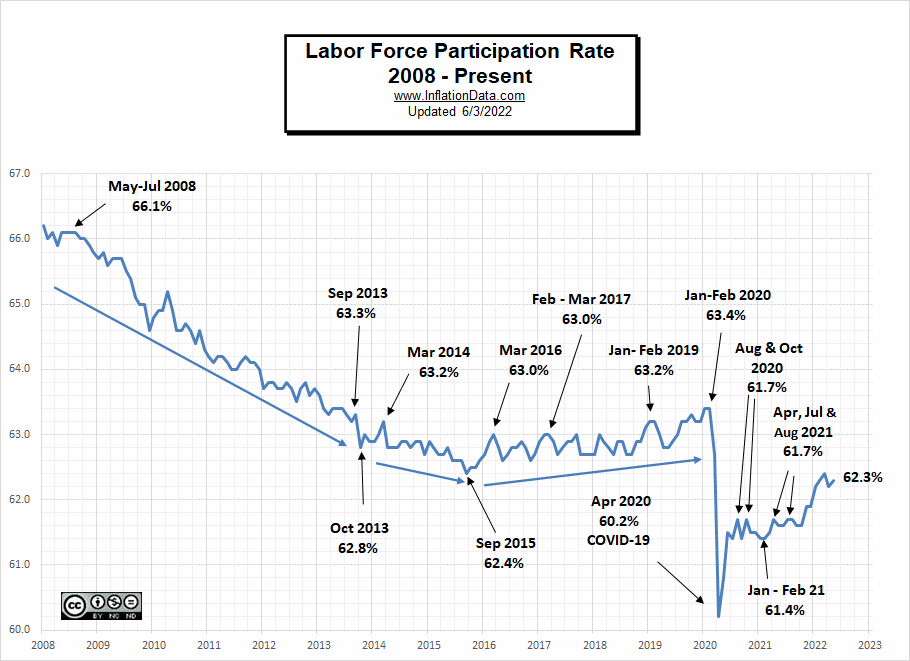 LFPR ticked up 1/10th% in May but is still more than an entire percentage point below Jan-Feb 2020 levels possibly indicating a permanent exodus from the labor force by one spouse in order to be more active in their children’s lives and education.
See Labor Force Participation Rate for more information.
Seasonally Adjusted U1 through U6 Unemployment Rates
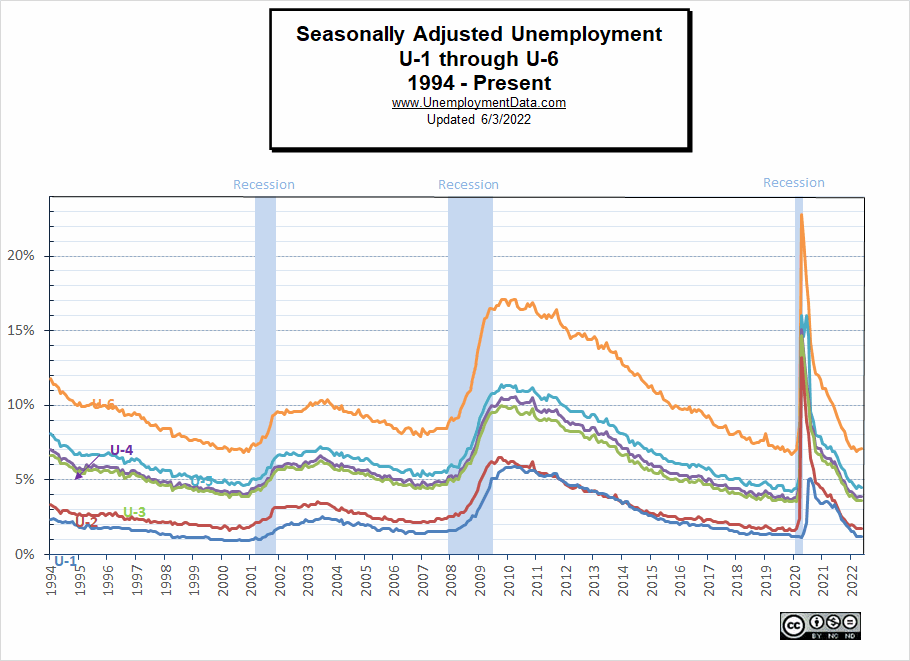
For more information about the various measurements of unemployment, see What Is U-6 Unemployment?
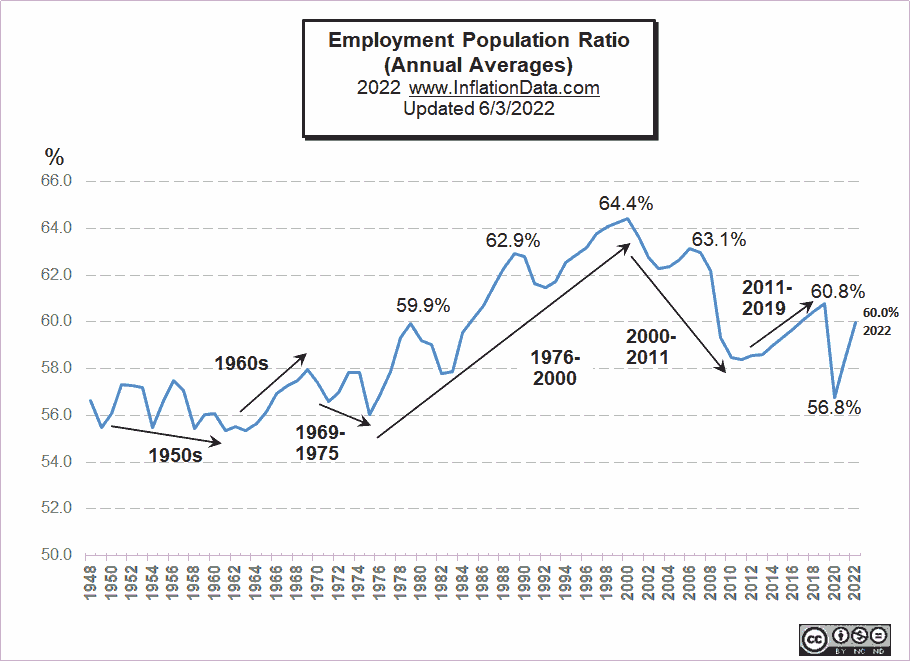
May Employment-Population Ratio
This chart shows the actual percentage of the population that’s working, unlike the Labor Force Participation Rate, which shows the portion of the people working or looking for work. The Annual Average Employment-Population Ratio for 2021 was 58.3% so far for 2022 it is 60.0%.
By looking at annual averages rather than monthly numbers, we can see the long-term trends in the percentage of the population that is working. For more information and the full commentary on these trends, see Employment-Population Ratio.
May 2022 Employment
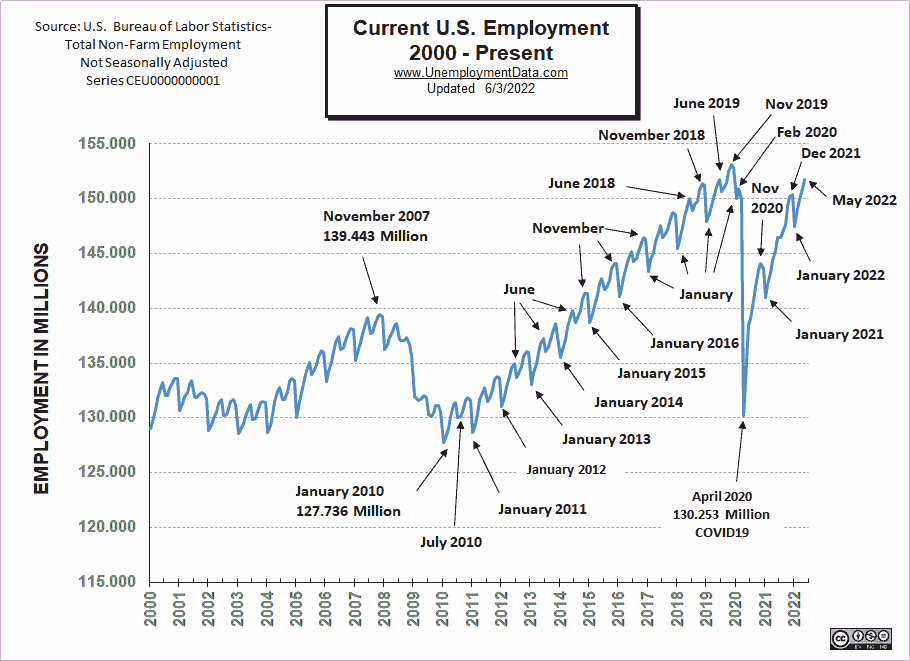
May 2022 employment remains above December 2021 but is still below November 2019 levels, plus the Civilian Non-Institutional Population has increased by over 4 million since then.
See Current Employment for more info.
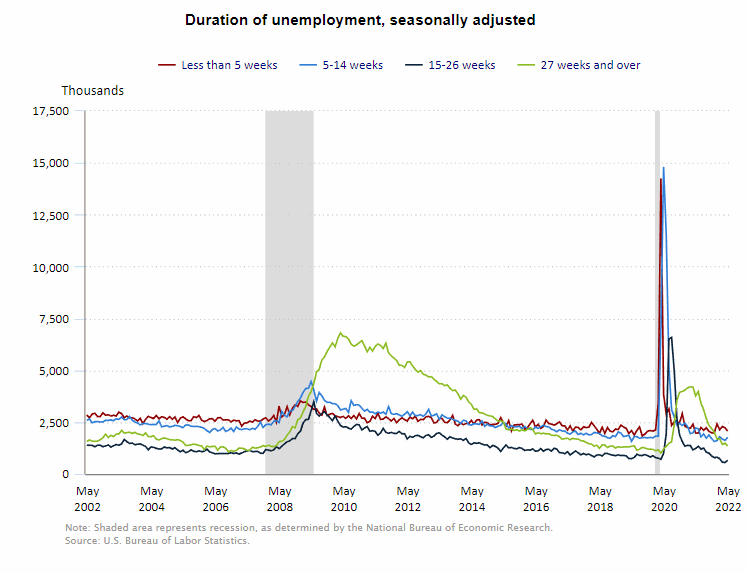
Duration of Unemployment
Long-term unemployment (i.e. 27 weeks and over) fell in May but in a hint of what may be coming those unemployed for 15-26 weeks ticked up as did 5-14 weeks.
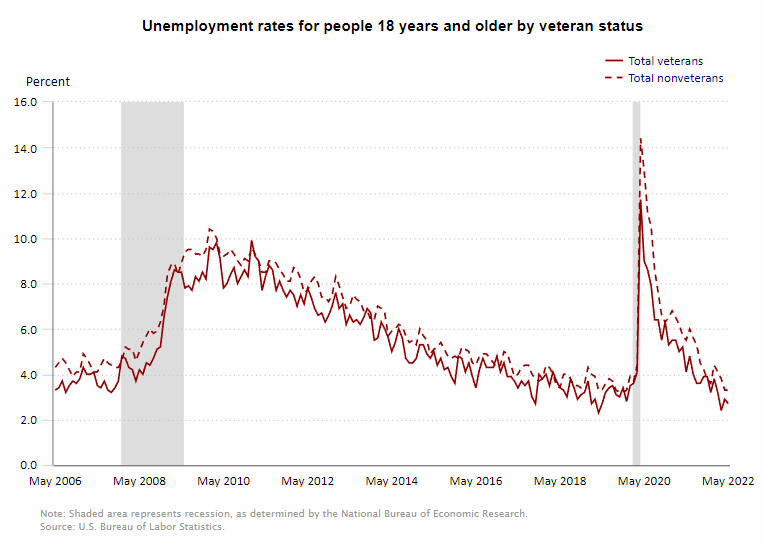
Unemployment by Veteran Status
Here is one that may surprise you. If you listen to the media all our Veterans are homeless living on the streets. But according to this chart, Veterans are actually less likely to be unemployed. Unemployment for Veterans was 2.7% in May and 3.3% for non-veterans (not Seasonally Adjusted) although how this adds up to 3.4% not-seasonally adjusted for everyone I’m not sure.
Click here if you would like to receive this monthly report and other article updates. You can unsubscribe at any time.
Here are some articles you might enjoy if you missed them:
Read more on UnemploymentData.com.
- How Is Time Management Important In The Workplace?
- Top Cities for Gig Worker Opportunities
- April Unemployment Holds Steady
- Jobs of the Future: Growing Your Career in the IT Field
- Practical Resources for Migrant Workers in the U.S.
From InflationData.com
- Inflation Adjusted Gasoline Hits New High (almost )
- Worldwide Inflation by Country 2022
- Analyzing 5 Ways You Can Hedge Against Surging Inflation
- April Inflation Down, But…
- Roots of Our Current Inflation
- How Families Are Adjusting To The Crazy Inflation Rates
- How To Invest In Cryptocurrency: 4 Tips For Beginners To Get Started
- March Inflation Highest Since 1981
From Financial Trend Forecaster
- Moore Inflation Predictor
- NYSE ROC
- NASDAQ ROC
- The Fed’s New “Tightening” Plan Is Too Little, Too Late
- Keynesians and Market Monetarists Didn’t See Inflation Coming
- Elon Musk Ambushes Twitter
- Can Ruthless Governments Make Crypto Worthless?
- Will Russian Sanctions Open a Can of Worms?
- In What Universe is $100+ Crude Oil Cheap?
- Is the Correction Over Yet?
- Why Investors are Consistently Fooled by the Stock Market
- Is Bitcoin Headed to Zero?
- Predicting the Collapse of a “Parabolic Rise”
- Surging Housing Prices Are Entering The Stratosphere- Look Out Below
- Germany’s DAX: What You Can Learn from the 2007 Top
- The Market is Currently a “Mixed Bag”
- The Journey to High-Confidence Trading Starts Now!
From OptioMoney.com
- Common Tax Mistakes That You Need To Avoid
- 6 Passive Income Ideas to Grow Your Wealth
- Surprising Ways a Storage Unit Can Save You Money
- Guide to Managing Small Business Finances
- Unlock The Benefits Of A Good Credit Score
From Your Family Finances