
Highlights from the Bureau of Labor Statistics (BLS) employment / unemployment report for June released on July 2nd.
![]()
- Unadjusted U-3 was UP from 5.5% to 6.1%
- Adjusted U-3 was UP from 5.8% to 5.9%
- Unadjusted U-6 was UP from 9.7% to 10.1%
- Labor Force Participation unchanged at 61.6%
- Unadjusted Employment rose from 145.385 million to 146.517 million
According to the Commissioner of the U.S. Bureau of Labor Statistics:
“Nonfarm payroll employment rose by 850,000 in June, and the unemployment rate changed little at 5.9 percent. Notable job gains occurred in leisure and hospitality, public and private education, professional and business services, retail trade, and other services…
Leisure and hospitality added 343,000 jobs in June as pandemic-related restrictions continued to ease in some parts of the country. Job gains continued in food services and drinking places (+194,000); accommodation (+75,000); and arts, entertainment, and recreation (+74,000). Leisure and hospitality has added 1.6 million jobs since January and accounts for about half of all the jobs added thus far this year. However, employment in the industry is down by 2.2 million, or 12.9 percent, since February 2020.”
As usual, they are talking about “Seasonally Adjusted Jobs” from the “Current Population Survey (CPS)” rather than looking at the results reported by actual companies in their “Current Employment Statistics survey (CES)”
But looking at the CES report we see…
Originally the BLS reported 145.385 for May which they adjusted to 145.369 million. For June they are currently saying employment is 146.517 million.
which is actually an increase of 1,148,000 jobs based on their original estimates.
Current Employment
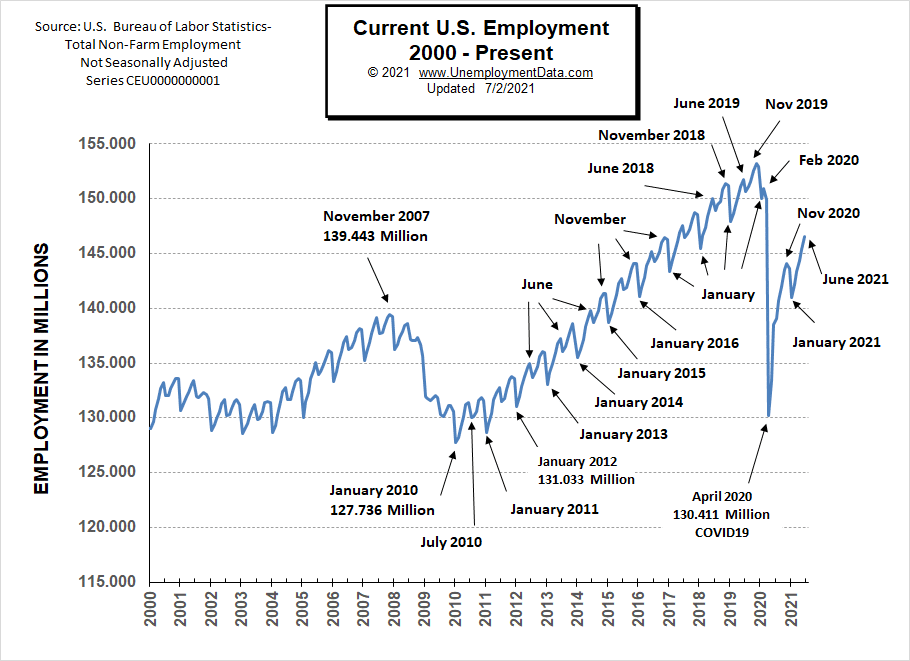
Despite the uptick in Unemployment in both the adjusted and non-adjusted categories. Actual employment was up in June. Perhaps, because school is out more people entered the workforce but haven’t found jobs yet.
Typically the low point for each year occurs in January and then it moves almost straight up to a small peak around June with a slight drop around July and then the highest peak in employment happens in November with a slight decline in December. As expected January 2021 employment dropped sharply (perhaps a bit more sharply than typical). But February through June saw the typical rebound.
Note: In 2020, the COVID virus shortcircuited the normal trend with a drop that began in March, and by April it had wiped out all the employment gains since July 2010. June 2020 saw employment rebound to approximately the January 2015 level. Fortunately, July did not follow the traditional falling pattern but instead rose (although only slightly). August’s employment rose to roughly the January 2016 level. September employment rose roughly triple the rate at which it rose in 2019. October’s employment rose to slightly above the January 2017 level. In December we got the traditional slight decline. And in May we have returned to the June 2016 level for employment but the Civilian Noninstitutional Population has increased by 7.8 million since then.
See Current Employment for more info.
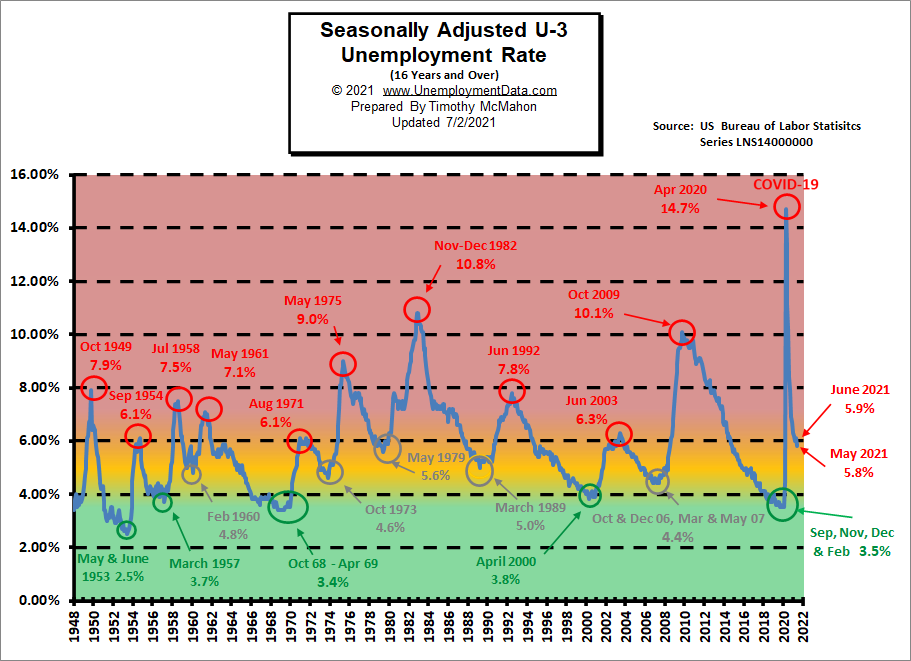
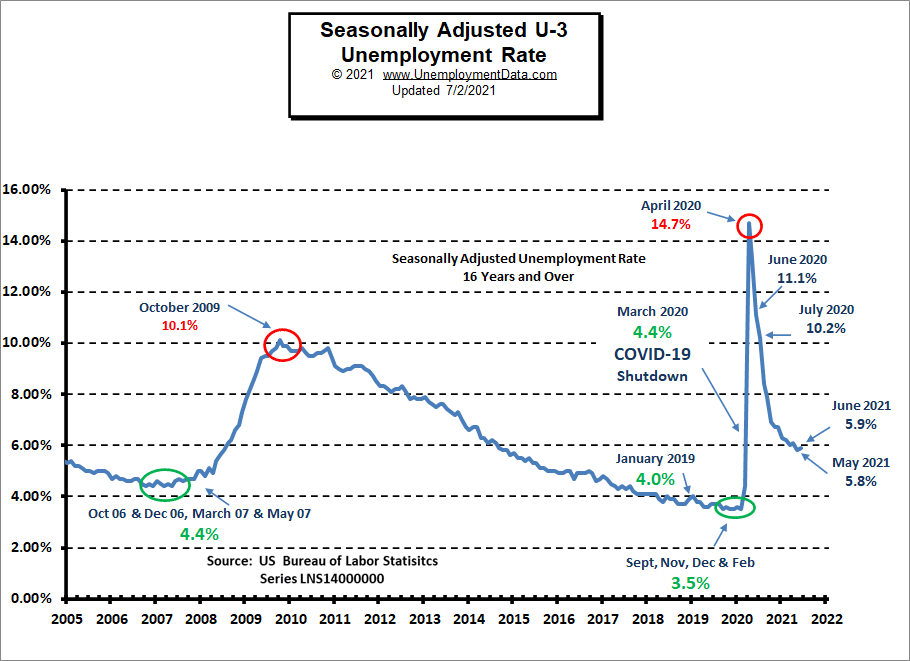
Unemployment Borderline “Red Zone”
As we can see from the chart below when unemployment gets into the “red zone” things are really bad. But historically “Bad” for the U-3 usually starts at around 6.5%-7% and stops at around 10% with only two previous occasions getting into the 10% range. But this time, due to COVID shutdowns, the U.S. economy went from really good (green zone) to really bad virtually overnight.
The yellow zone is the normal operating range and it runs from about 4% to 6% and when unemployment stays in this range the economy is generally doing OK. Below 4% and the economy is doing great and above 7% and the economy is in for trouble. Currently, the U-3 unemployment rate has fallen from the horrendous 14.7% of April 2020 down to the normally bad 6.0%. We have to remember that the PEAKS in 1954, 1971, and 2003 were at 6.3% and that was the worst it got. The September 1954 and August 1971 peaks were at 6.1% so although current levels are slightly better than that, they were they still aren’t good. June’s 5.9% Adjusted U-3 is still borderline bad.
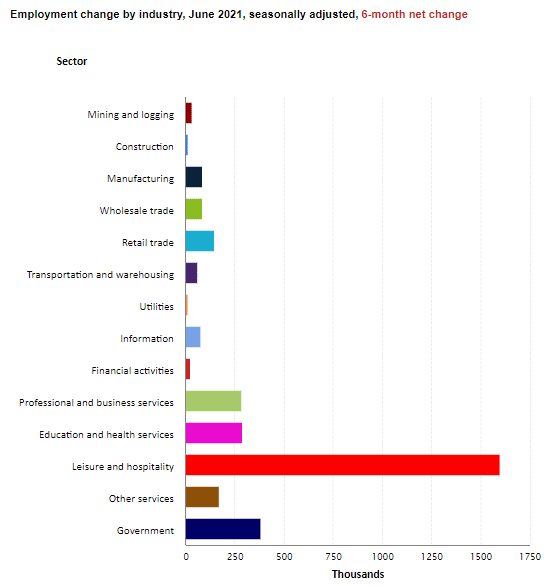
Employment by Sector
The employment “bubble chart” shows how each sector of the economy is doing (employment-wise on a seasonally adjusted basis).
Typically January is the worst month with retailers and hospitality reducing seasonal staff. In January 2021 Leisure and Hospitality lost -61,000 jobs. As things begin to reopen, February- April saw Leisure and Hospitality GAIN a massive number of jobs.
In June Leisure and Hospitality gained another 343,000 jobs. Professional and Business Services gained 72,000 jobs, Retail gained 67,100 jobs, Education and Health gained 59,000 jobs and Wholesale gained 21,300 jobs. The only losers were Construction -7,000 and Financial -1,000 jobs.
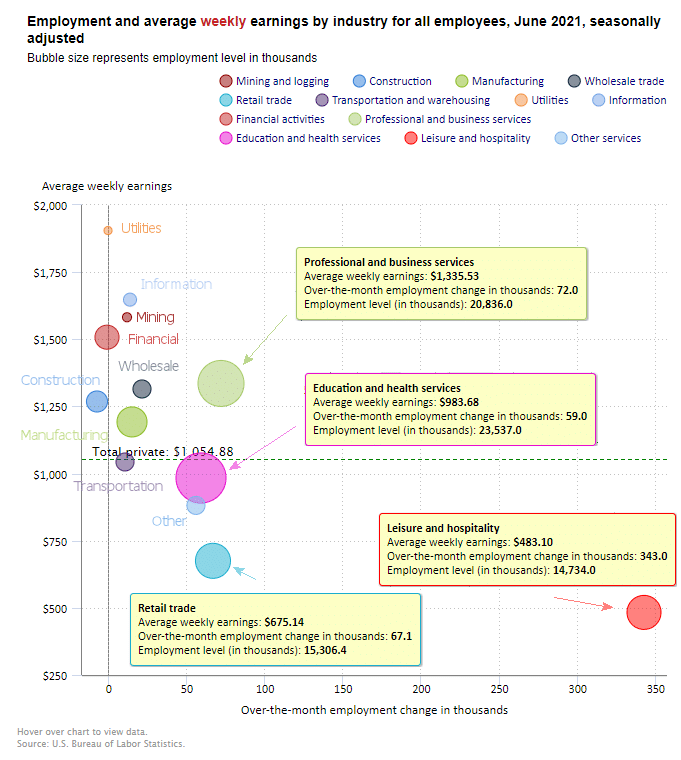
Average weekly wages fell from $1,058.52 in May to $1,054.88 in June.
(See the table below for details.)
How to read this chart:
The bubbles location on the chart tell us two things:
- Change in Employment Levels over the most recent month.
- Average Weekly earnings.
- The further to the right the bubble the larger the increase in the number of jobs.
- The higher up on the chart the larger the average salary.
Bubble Size tells us:
- Total Employment for the sector.
- Larger bubbles mean more people are employed in that sector.
Employment and Average Weekly Earnings by Industry
June 2021, Seasonally Adjusted
| Industry | Monthly Increase | Average Weekly Earnings | Employment Level |
| Total Private Employment | 662,000 | $1,054.88 | 123,919,000 |
| Mining and Logging | 12,000 | $1,582.00 | 630,000 |
| Construction | -7,000 | $1,268.40 | 7,410,000 |
| Manufacturing | 15,000 | $1,192.33 | 12,318,000 |
| Wholesale trade | 21,300 | $1,314.93 | 5,702,800 |
| Retail trade | 67,100 | $675.14 | 15,306,400 |
| Transportation and Warehousing | 10,700 | $1,043.25 | 5,729,500 |
| Utilities | 0 | $1,904.85 | 539,300 |
| Information | 14,000 | $1,647.61 | 2,736,000 |
| Financial Activities | -1,000 | $1,507.76 | 8,800,000 |
| Professional and Business Services | 72,000 | $1,335.53 | 20,836,000 |
| Education and Health Services | 59,000 | $983.68 | 23,537,000 |
| Leisure and Hospitality | 343,000 | $483.10 | 14,734,000 |
| Other Services | 56,000 | $881.47 | 5,640,000 |
Another way to look at these monthly numbers. This one includes government jobs and shows the magnitude of the gain in Leisure and Hospitality jobs.
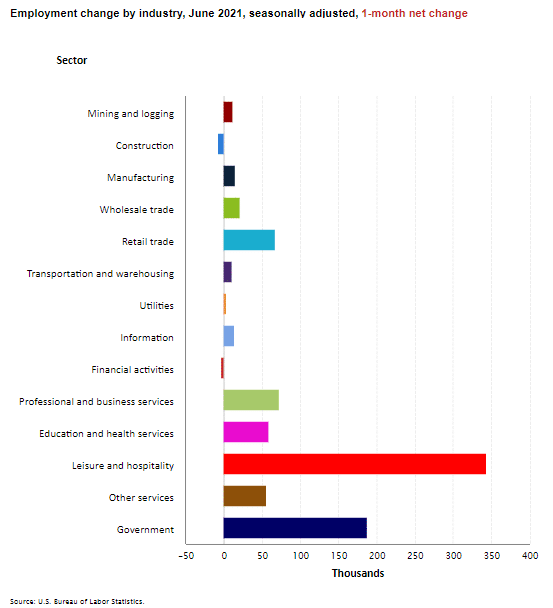
Looking at it over 6 months we can see an improvement in all sectors.
Source: BLS
U1 through U6 Unemployment Rates
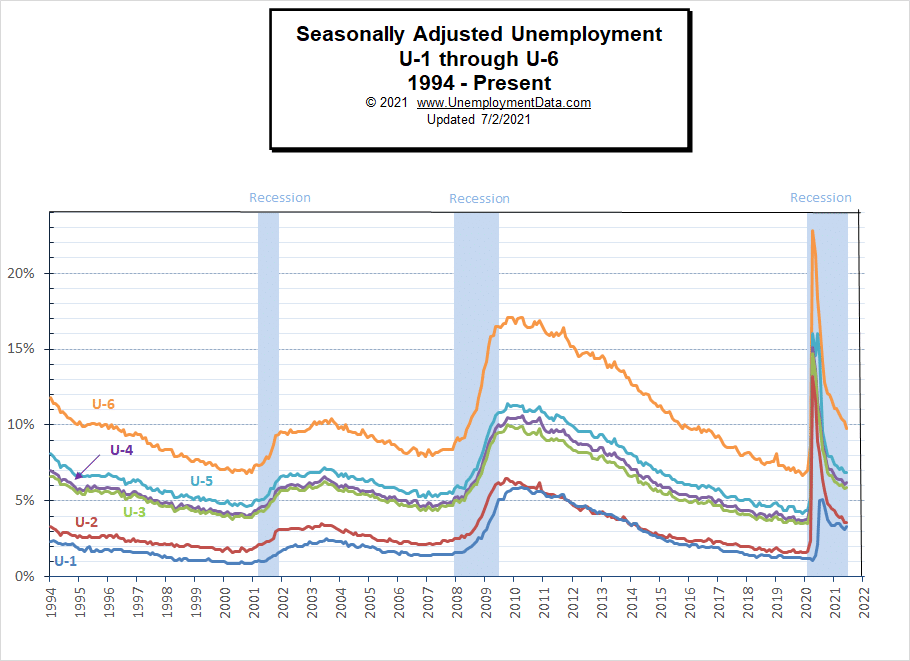
This month we had a very slight uptick in seasonally adjusted unemployment with it visible even in the U-1 category.
For more information about the various measurements of unemployment see What Is U-6 Unemployment?
Previous Record Low Unemployment (Seasonally Adjusted U-3)
If we consider anything 4% or below as “low” we have had a few “low” stretches as we can see in the table below.
(4% or below in Green)
| Jan | Feb | Mar | Apr | May | Jun | Jul | Aug | Sep | Oct | Nov | Dec | |
| 1950 | 6.5% | 6.4% | 6.3% | 5.8% | 5.5% | 5.4% | 5.0% | 4.5% | 4.4% | 4.2% | 4.2% | 4.3% |
| 1951 | 3.7% | 3.4% | 3.4% | 3.1% | 3.0% | 3.2% | 3.1% | 3.1% | 3.3% | 3.5% | 3.5% | 3.1% |
| 1952 | 3.2% | 3.1% | 2.9% | 2.9% | 3.0% | 3.0% | 3.2% | 3.4% | 3.1% | 3.0% | 2.8% | 2.7% |
| 1953 | 2.9% | 2.6% | 2.6% | 2.7% | 2.5% | 2.5% | 2.6% | 2.7% | 2.9% | 3.1% | 3.5% | 4.5% |
| 1954 | 4.9% | 5.2% | 5.7% | 5.9% | 5.9% | 5.6% | 5.8% | 6.0% | 6.1% | 5.7% | 5.3% | 5.0% |
| 1955 | 4.9% | 4.7% | 4.6% | 4.7% | 4.3% | 4.2% | 4.0% | 4.2% | 4.1% | 4.3% | 4.2% | 4.2% |
| 1956 | 4.0% | 3.9% | 4.2% | 4.0% | 4.3% | 4.3% | 4.4% | 4.1% | 3.9% | 3.9% | 4.3% | 4.2% |
| 1957 | 4.2% | 3.9% | 3.7% | 3.9% | 4.1% | 4.3% | 4.2% | 4.1% | 4.4% | 4.5% | 5.1% | 5.2% |
| 1958 | 5.8% | 6.4% | 6.7% | 7.4% | 7.4% | 7.3% | 7.5% | 7.4% | 7.1% | 6.7% | 6.2% | 6.2% |
| … | … | … | … | … | … | … | … | … | … | … | … | … |
| 1965 | 4.9% | 5.1% | 4.7% | 4.8% | 4.6% | 4.6% | 4.4% | 4.4% | 4.3% | 4.2% | 4.1% | 4.0% |
| 1966 | 4.0% | 3.8% | 3.8% | 3.8% | 3.9% | 3.8% | 3.8% | 3.8% | 3.7% | 3.7% | 3.6% | 3.8% |
| 1967 | 3.9% | 3.8% | 3.8% | 3.8% | 3.8% | 3.9% | 3.8% | 3.8% | 3.8% | 4.0% | 3.9% | 3.8% |
| 1968 | 3.7% | 3.8% | 3.7% | 3.5% | 3.5% | 3.7% | 3.7% | 3.5% | 3.4% | 3.4% | 3.4% | 3.4% |
| 1969 | 3.4% | 3.4% | 3.4% | 3.4% | 3.4% | 3.5% | 3.5% | 3.5% | 3.7% | 3.7% | 3.5% | 3.5% |
| 1970 | 3.9% | 4.2% | 4.4% | 4.6% | 4.8% | 4.9% | 5.0% | 5.1% | 5.4% | 5.5% | 5.9% | 6.1% |
| … | … | … | … | … | … | … | … | … | … | … | … | … |
| 1999 | 4.3% | 4.4% | 4.2% | 4.3% | 4.2% | 4.3% | 4.3% | 4.2% | 4.2% | 4.1% | 4.1% | 4.0% |
| 2000 | 4.0% | 4.1% | 4.0% | 3.8% | 4.0% | 4.0% | 4.0% | 4.1% | 3.9% | 3.9% | 3.9% | 3.9% |
| 2001 | 4.2% | 4.2% | 4.3% | 4.4% | 4.3% | 4.5% | 4.6% | 4.9% | 5.0% | 5.3% | 5.5% | 5.7% |
| … | … | … | … | … | … | … | … | … | … | … | … | … |
| 2018 | 4.1% | 4.1% | 4.1% | 3.9% | 3.8% | 4.0% | 3.9% | 3.9% | 3.7% | 3.7% | 3.7% | 3.9% |
| 2019 | 4.0% | 3.8% | 3.8% | 3.6% | 3.6% | 3.7% | 3.7% | 3.7% | 3.5% | 3.6% | 3.5% | 3.5% |
| 2020 | 3.6% | 3.5% | 4.4% | 14.7% | 13.3% | 11.1% | 10.2% | 8.4% | 7.9% | 6.9% | 6.7% | 6.7% |
| 2021 | 6.3% | 6.2% | 6.0% | 5.8% | 5.9% |
Historical Employment
Historically employment is closely tied to recessions because one of the primary determining factors of whether the economy is officially in a recession is an increase in the unemployment rate. The chart below provides the Historical Employment Data overlaid on blue bars showing periods of official recessions. In April, the number of people employed fell below the 2007 peak, near the lows of the 2008-2010 crash. In August 2020, it rebounded back above the 2007 peak level. According to the National Bureau of Economic Research (NBER) we have officially been in a recession since February 2020. Since they measure a recession beginning from the peak, that just means the economy was no longer growing, which is pretty obvious due to the virus.
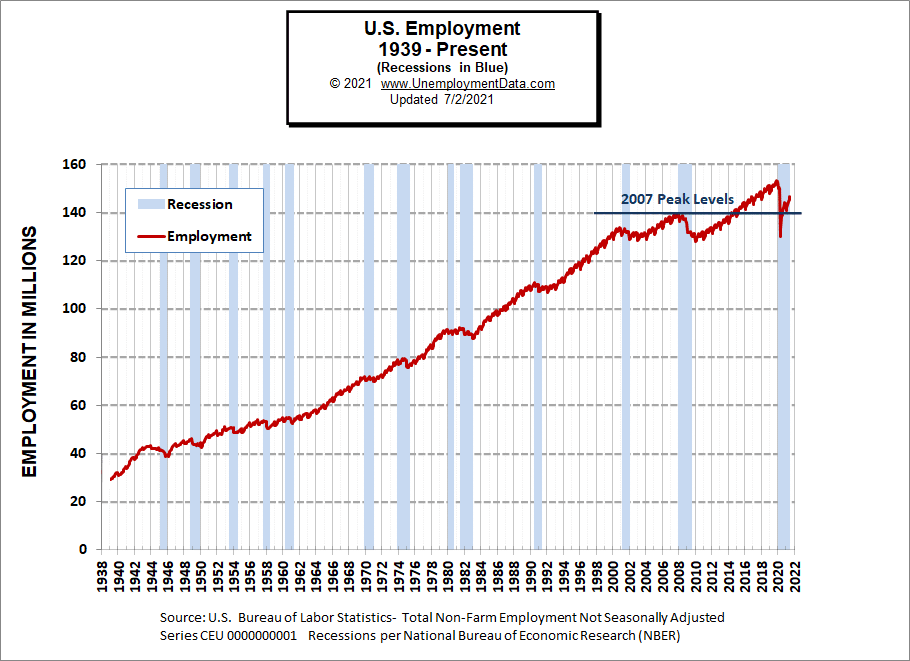
See Historical Employment Data for more info.
Current Seasonally Adjusted Unemployment
 See Current Employment Commentary for more info.
Unemployment by Education
Typically those with a Bachelor’s degree are relatively immune to unemployment. Although during the 2008 recession college grads’ unemployment rose to slightly above 4%. Those with a Bachelor’s degree or higher had a low of 1.9% unemployment in February 2019 and rose to 8.4% in April 2020. Unemployment fell to 3.8% in December but rose back to 4% in January and was 3.2% in May rising to 3.5% in June.
Unemployment among those with less than a high school diploma continues to rise much more sharply than in other sectors.
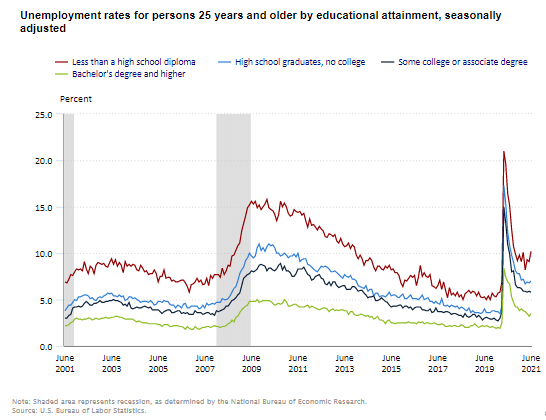
Note: I contacted the BLS and asked why they have not added a shaded region for the current recession, which began in February 2020 according to NBER and they said for some reason, they won’t add it until it ends.
Source: Bureau of Labor Statistics
Reasons for Unemployment – Layoff Status
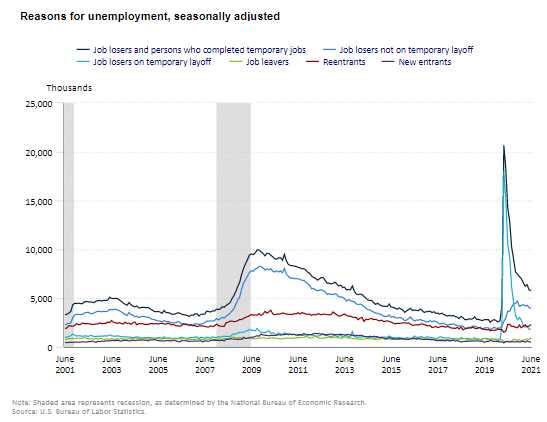 Most categories were relatively flat for the last few months after falling sharply in previous months. New entrants and Job leavers remain very low. Those on temporary layoffs continue to fall.
Note: As in the previous chart, the BLS has not added a shaded region for the current recession which began in February 2020 according to NBER.
Source: BLS
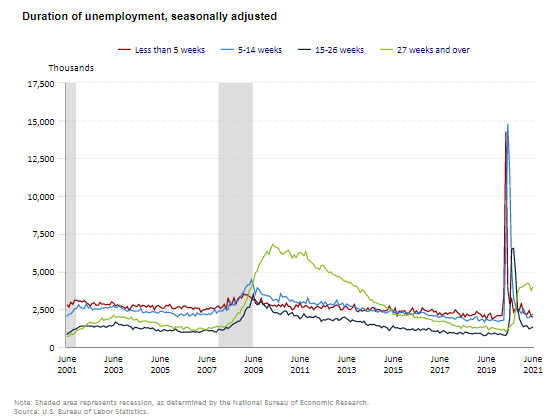
Duration of Unemployment
It appears that those who are “long-term unemployed” i.e. over 27 weeks has ticked back up again this month.
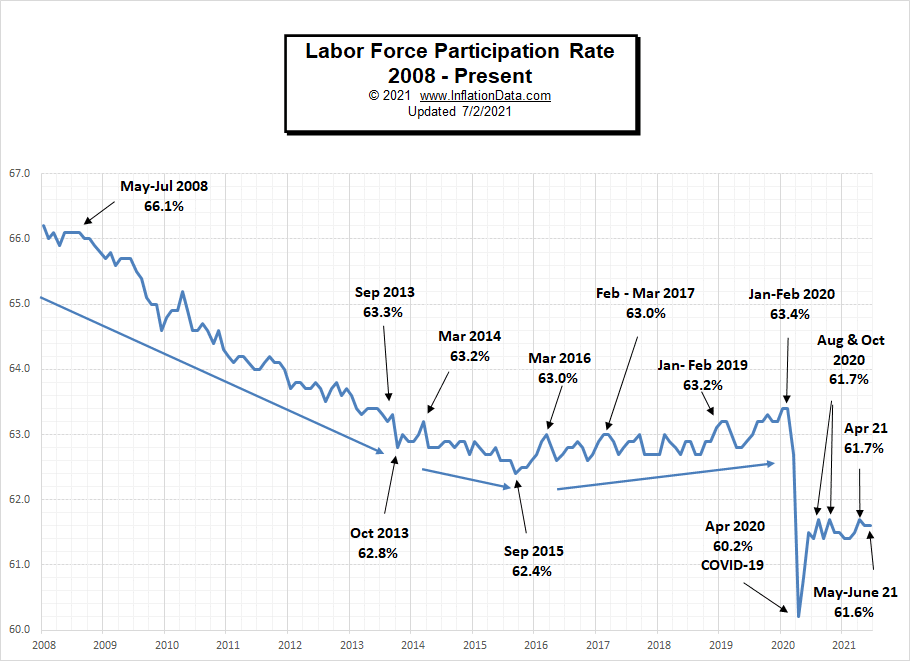
Labor Force Participation Rate
Even though Unemployment was in record low territory for quite some time, it wasn’t until January and February 2020, that the LFPR was finally able to claw its way back to 63.4%, its highest level since 2013.
Then COVID decimated all those gains dropping the LFPR down to 60.2% in April. In May 2020, it began to rebound and in June the LFPR was able to bounce back a little more to 61.5%, it fell slightly in July but this was probably due to people returning to the labor force rather than other factors. Over the last few months, the LFPR has bounced around between 61.4% and 61.7%. In May it fell again to 61.6% from 61.7% in April.
See Labor Force Participation Rate for more information.
If you would like to receive this monthly report and other article updates click here you can unsubscribe at any time.
Here are some articles you might enjoy in case you missed them:
Read more on UnemploymentData.com.
- Accountant vs Bookkeeper: What Do They Do for a Small Business?
- How to Make Yourself More Employable
- 4 Major Costs of Workplace Injuries to Include in Your Claim
- 4 Types of Business You Can Easily Start on Your Own
- How to Become a Hairstylist: A Career Guide
From InflationData.com
- How Does a Country “Export” its Inflation?
- May’s Annual Inflation Soars to ~5%
- 5 Ways Inflation Affects the Accounting Industry
- The 3 Stages of Inflation
- April Inflation More than Double FED Target
- Managing Business During Periods of Inflation
From Financial Trend Forecaster
- Moore Inflation Predictor
- NYSE ROC
- NASDAQ ROC
- What are NFTs and Why are They Going Crazy?
- Is Bitcoin Headed For a Fall?
- Blockchain Goes to Ethiopia
- Online Stockbrokers Going Public
From Elliott Wave University
- Why “Trouble is Brewing” for the U.S. Housing Market
- The Fear of Missing Out
- The Bitcoin Crime Wave Hits
- Elliott Wave Analysis Can Help You See Countertrends. Pattern in Focus: the Zigzag.
- Capital Gains Tax Hike News: Was It REALLY to Blame for Sell-off?
From OptioMoney.com
- How to Minimize Complications When Reducing Your Mortgage
- How Much Value Does An Extra Bedroom Add To A House?
- The Downsides of Paying-off Your Mortgage Early
- Downsizing Mistakes People Make in Retirement
- The Complete Guide to Selling Rental Property
From Your Family Finances