
The U.S. Bureau of Labor Statistics (BLS) released its employment / unemployment report for July on August 2nd, 2024.
Employment / Unemployment
![]()
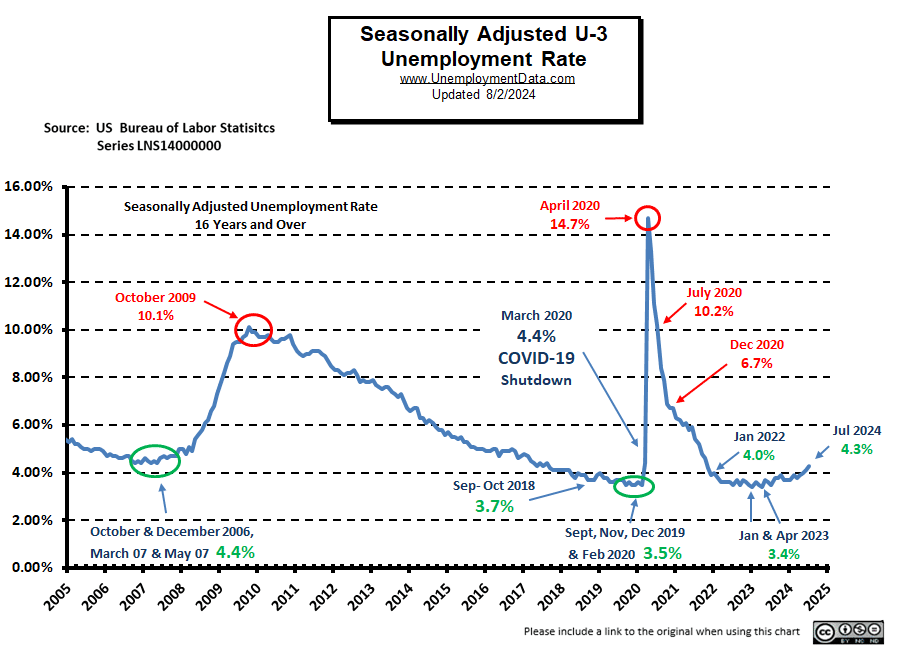
- Seasonally Adjusted U3- 4.3% up from 4.1% in June
- Unadjusted U3- 4.5% up from 4.3% in June
- Unadjusted U6- 8.2% up from 7.7% in June
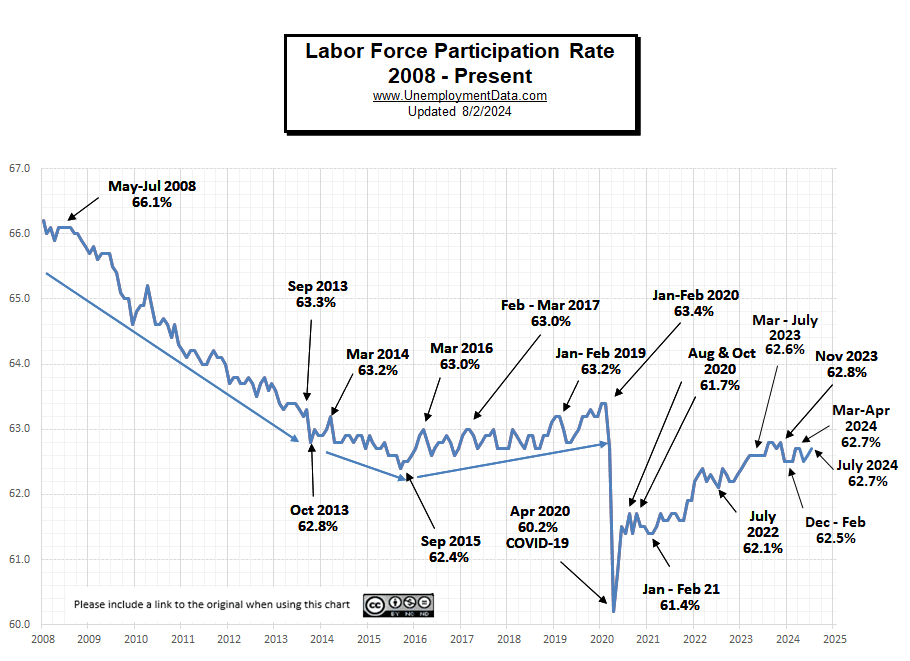
- Labor Force Participation Rate 62.7% up from 62.6%
- Employment 158.445 million down from 159.360 million
- Next data release September 6th, 2024
Summary:
Total Employed decreased in July, adjusted and Unadjusted Unemployment was up.
According to the Commissioner of the U.S. Bureau of Labor Statistics:
“The unemployment rate rose to 4.3 percent in July, and nonfarm payroll employment edged up by 114,000, the U.S. Bureau of Labor Statistics reported today. Employment continued to trend up in health care, in construction, and in transportation and warehousing, while information lost jobs.”
You can read the full BLS report here.
As usual, they are talking about “Seasonally Adjusted Jobs”.
Looking at the Unadjusted Establishment Survey report we see…
Originally the BLS reported employment of 159.392 million for June
which they then adjusted to 159.360 million in August.
They are currently reporting 158.445 million jobs for July which is actually a decrease of 947,000 jobs based on their original numbers. The LFPR was up at 62.7% but the Employment/Population Ratio was down from 60.1% to 60.0%.
Bad News for the Market?
On Wednesday (prior to the Jobs data release on Friday) the stock market reacted bullishly to FED Chairman Powell’s dovish speech with anticipation of a September rate cut. But then markets reversed course on Thursday on preliminary Employment numbers. But what they failed to recognize is that the worst months (highest unemployment) are usually January, June, and July. So a bad July doesn’t really signify much.
Adding to the market’s woes, Intel dropped a bombshell with its earnings report. The company announced plans to slash jobs and suspend dividends after missing earnings targets and delivering a disappointing sales forecast. Intel shares cratered over 25% in early trading, dragging other chip stocks down with it.
In other news, Israel is suspected of killing a Hamas leader inside Iran. So now the market also fears retaliation by Iran causing a war in the Middle East. In addition to these political problems, Japan is creating financial problems for the U.S. by raising interest rates while other countries are lowering them. As you can see from the chart below, Japan has had zero or near-zero interest rates for almost 30 years. For a brief stretch, their rates got all the way up to 3/4 of 1%! (Horror of Horrors). But since 2008 they have been below 1/3rd of 1%.
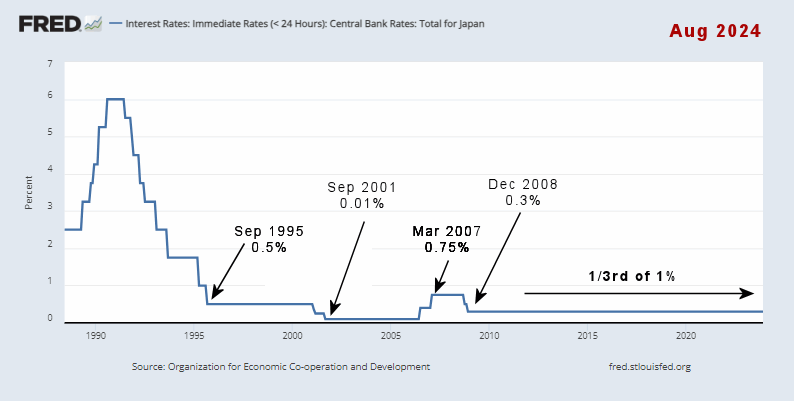
This has created what is called the “Carry Trade” where people could borrow Yen almost interest-free and invest that money in higher-yielding things like Nvidia or other NASDAQ stocks or even lower-risk things like U.S. Treasury Bills. However, with the Bank of Japan (BOJ) raising rates, the free money is drying up, which creates selling pressure on the NASDAQ.
The NYSE was down -1.79% on Friday after being down -1.16% on Thursday.
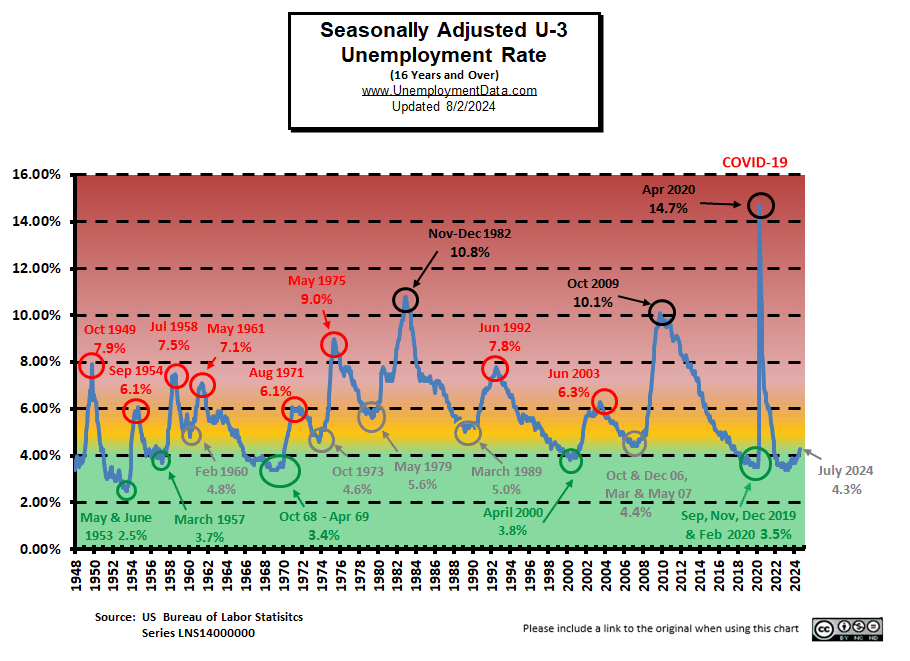
Current Unemployment Rate Chart
Seasonally Adjusted U3 Unemployment remains above the pre-COVID 2019 cyclical lows of 3.5%, but is approaching the yellow zone.
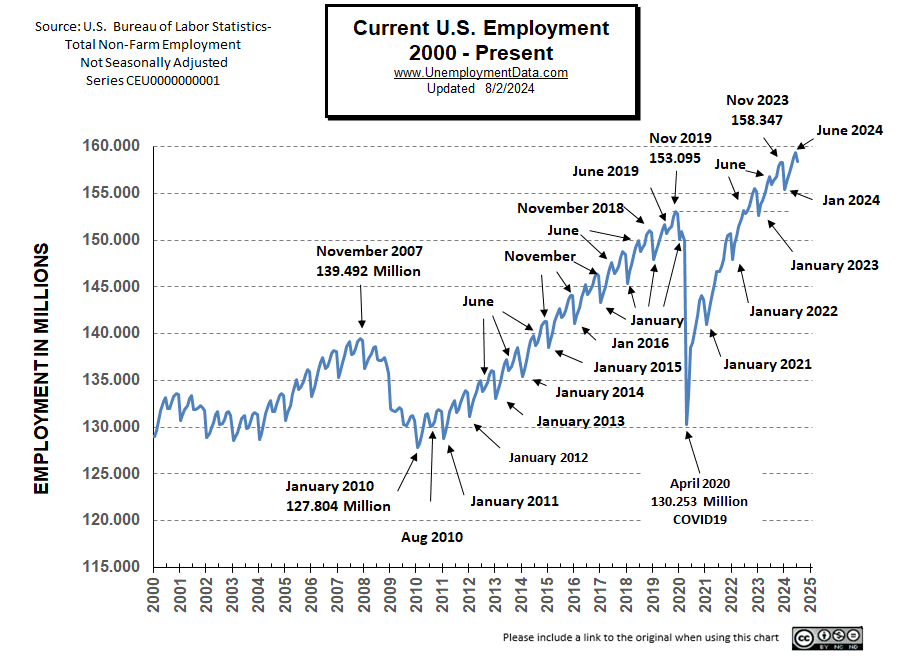
Current Employment Rate
The BLS originally reported employment in June as 159.392 million which they adjusted to 159.360 million. For July they are reporting 158.445 million which is 947,000 less than they originally reported or 915,000 less than they are currently reporting for June.
Employment is 2,464,000 Above Year-Ago Levels and 7.477 million above February 2020 (prior to the Covid Crash)
However, the Civilian Population has also increased by about 8.886 million since February 2020 (probably not counting the millions of illegal aliens that have come since then).
See Current Employment for more information.
BLS: July 2024 Employment by Sector
The BLS employment “bubble chart” based on the Establishment Survey Data gives us a good picture of the Seasonally adjusted employment numbers.
The Bubble’s Size tells us the total Employment for that industry (i.e., larger bubbles mean more people are employed in that sector).
The bubble’s location on the chart tells us that there has been a change in Employment Levels over the most recent month… A bubble further to the right indicates larger job growth. A bubble’s vertical location on the chart shows the average industry salary.
Remember, these are Seasonally Adjusted Numbers, so they aren’t cumulative!
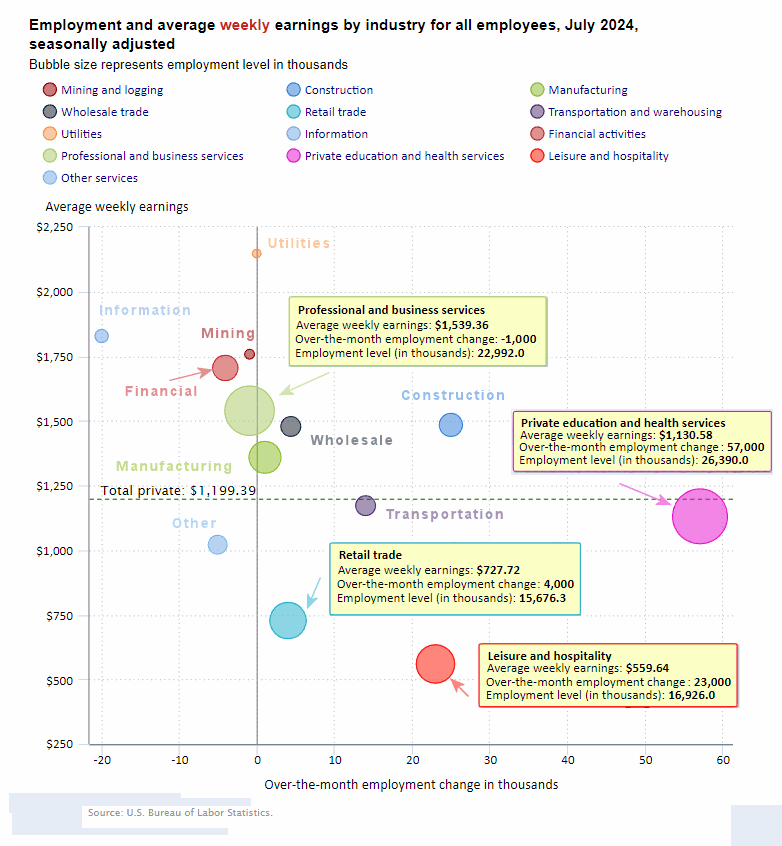
Looking at the above chart we can see more bubbles to the left of the zero line than we have seen recently.
Education and Health added 57,000 jobs in July less than the 82,000 jobs added in June. Construction added 25,000 jobs and Leisure and Hospitality Services added 23,000 jobs. Average weekly wages fell by a little over $1.
BLS Average Weekly Wages
| Date | Average Weekly Wage |
| July 2024 | $1,199.39 |
| June 2024 | $1,200.50 |
| May 2024 | $1,197.41 |
| April 2024 | $1,191.93 |
| March 2024 | $1,193.34 |
| February 2024 | $1,185.75 |
| January 2024 | $1,178.16 |
| December 2023 | $1,175.46 |
| November 2023 | $1,173.04 |
| October 2023 | $1,166.20 |
| September 2023 | $1,165.47 |
| August 2023 | $1,163.41 |
| July 2023 | $1,157.28 |
| June 2023 | $1,155.15 |
| May 2023 | $1,146.99 |
| April 2023 | $1,147.58 |
| March 2023 | $1,141.34 |
| February 2023 | $1,141.61 |
| January 2023 | $1,146.14 |
| December 2022 | $1,125.73 |
| November 2022 | $1,129.01 |
| October 2022 | $1,124.01 |
| September 2022 | $1,119.87 |
| August 2022 | $1,116.42 |
| July 2022 | $1,116.54 |
| June 2022 | $1,106.76 |
| May 2022 | $1,105.47 |
| April 2022 | $1,102.01 |
| December 2021 | $1,086.46 |
BLS Employment and Average Weekly Earnings by Industry
July 2024, Seasonally Adjusted Employment
Note that due to “seasonal adjusting,” although they may claim that there was a “monthly increase” (or decrease), there isn’t always an actual increase; you can’t just subtract last month’s “employment level” from this month’s level. For instance, Construction employment was supposed to have been up by 25,000 in July. But June had 8,245,000 and July had 8,260,000 which looks like a 15,000 job increase. And Manufacturing went from 12,950,000 to 12,953,000 which looks like a 3,000 job increase but due to adjusting it is only a 1,000 increase.
| Industry | Monthly Increase | July Ave. Weekly Earnings | July Employment Level | June Employment Level |
| Total Private Employment | 97,000 | $1,199.39 | 135,384,000 | 135,274,000 |
| Mining and Logging | -1,000 | $1,757.82 | 633,000 | 634,000 |
| Construction | 25,000 | $1,484.49 | 8,260,000 | 8,245,000 |
| Manufacturing | 1,000 | $1,358.99 | 12,953,000 | 12,950,000 |
| Wholesale trade | 4,300 | $1,478.37 | 6,177,200 | 6,181,100 |
| Retail trade | 4,000 | $727.72 | 15,676,300 | 15,674,800 |
| Transportation and Warehousing | 14,000 | $1,171.98 | 6,635,900 | 6,593,700 |
| Utilities | -100 | $2,147.56 | 589,500 | 589,600 |
| Information | -20,000 | $1,828.17 | 2,996,000 | 3,027,000 |
| Financial Activities | -4,000 | $1,704.69 | 9,241,000 | 9,244,000 |
| Professional and Business Services | -1,000 | $1,539.36 | 22,992,000 | 22,950,000 |
| Private Education and Health Services | 57,000 | $1,130.58 | 26,390,000 | 26,348,000 |
| Leisure and Hospitality | 23,000 | $559.64 | 16,926,000 | 16,913,000 |
| Other Services | -5,000 | $1,021.00 | 5,914,000 | 5,924,000 |
Source: BLS
ADP® National Employment Report
ADP provides an independent (non-government) estimate of private-sector employment and pay, based on data derived from ADP client payrolls. According to ADP®, In collaboration with Stanford Digital Economy Lab.
ADP: Private employers added 122,000 jobs in July
(This was slower growth than May’s 152,000 and June’s 150,000)
- Job creation edged down as pay gains continued to slow.

Source: ADP®
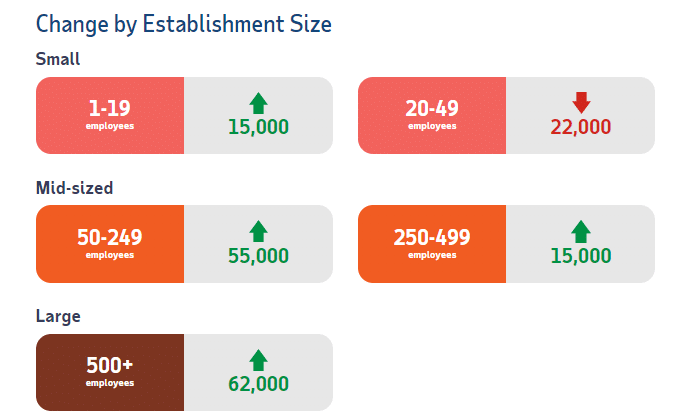
ADP Private Employment by Establishment Size
As we can see from the graphic below most establishment sizes had positive gains. The only sector that declined slightly were those establishments with 20-49 employees.
July ADP Changes:
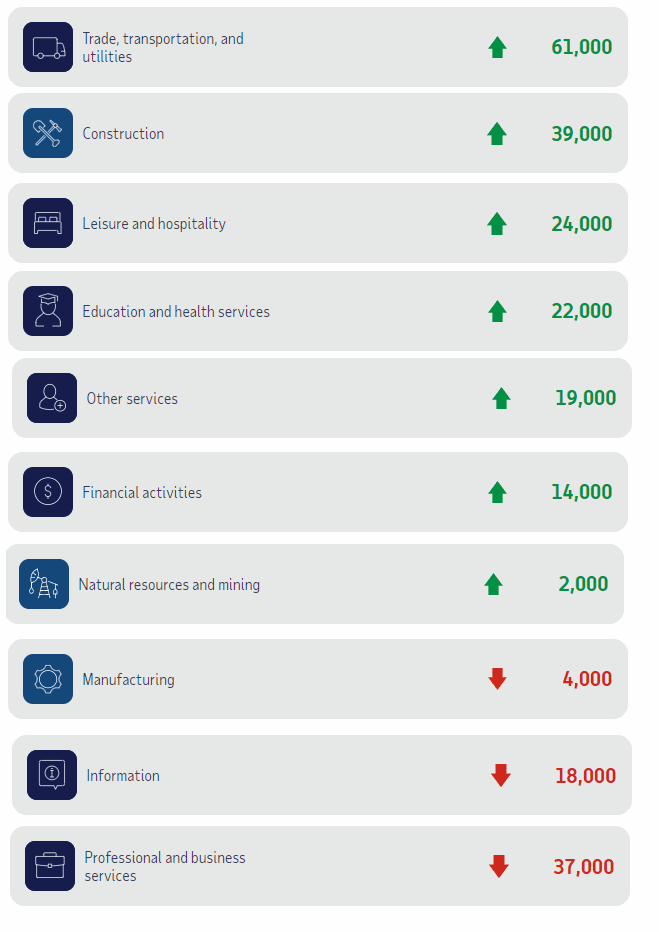
ADP Job Gainers / Losers
ADP provides an entirely different picture of the job situation compared to the BLS perspective. For instance while the ADP says Transportation gained 61,000 jobs, BLS says they gained 14,000 jobs. This may be due to slightly different classification and groupings of jobs.
Unemployment
July’s Seasonally Adjusted Unemployment is up from 4.1% to 4.3%.
Labor Force Participation Rate
Surprisingly, the LFPR is up slightly from 62.6% to 62.7%. If employment is down you would expect LFPR to be down as well.
 See Labor Force Participation Rate for more information.
Less Than Full Employment
This chart compares employment levels with the (inverted) unemployment rate.
Full Employment is when everyone who wants a job has one. It is generally considered to be around 3%. After the unemployment rate almost touched the magic full employment line in April 2023, it began moving away (i.e., higher unemployment).
Note: The Unemployment rate is inverted to track the employment rate. Neither is Seasonally Adjusted. For more information see Employment vs. Unemployment.
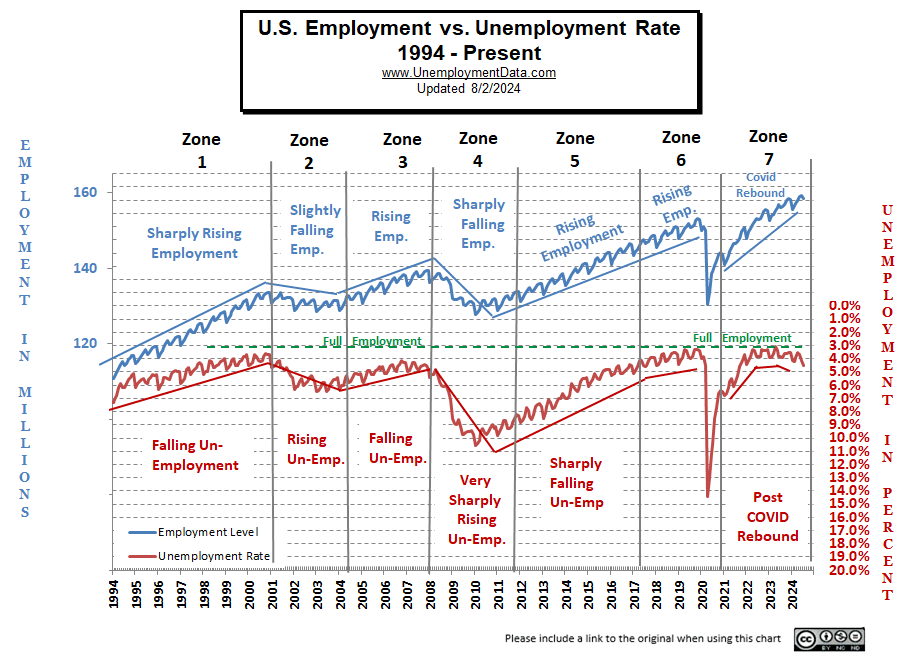
Note: Full employment is not considered to be at zero percent because even when employers are having difficulty finding employees, some people are still unemployed due to either:
- structural unemployment (mismatch between worker skills and job requirements, i.e., not enough training) or
- frictional unemployment There will always be people who have quit or have lost a seasonal job and are in the process of getting a new job. Or
- Simply because they quit their job knowing it would be easy to find another (hopefully better) job.
Seasonally Adjusted U1 through U6 Unemployment Rates
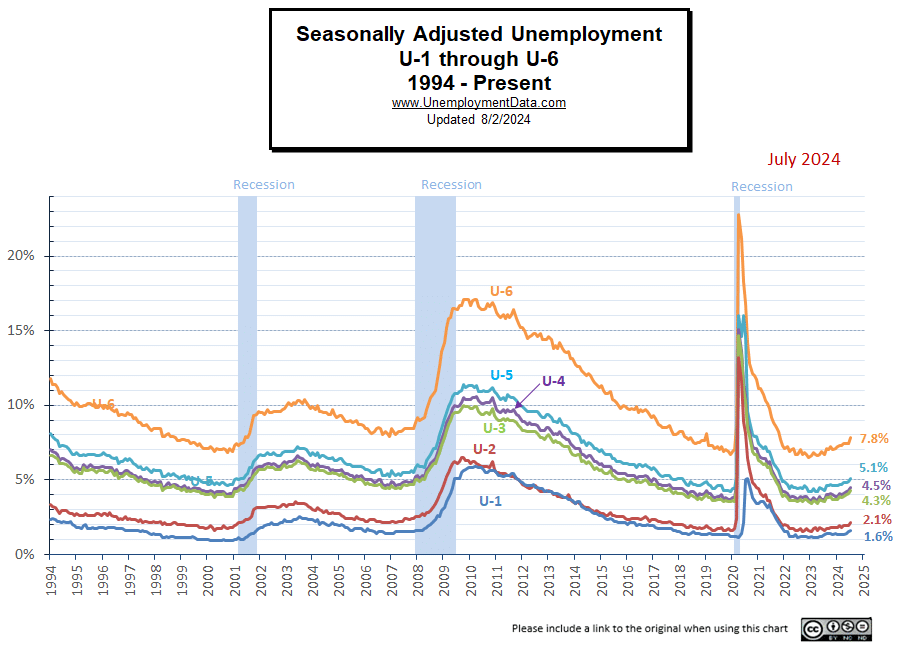 For more information about the various measurements of unemployment, see What Is U-6 Unemployment?
Seasonally Adjusted Unemployment by Education
This chart does refute the idea that getting a college education doesn’t help you find a job. Those with a 4 year degree have half the unemployment level than someone with only a High School diploma. But it doesn’t show whether they are “underemployed” i.e. working as a Barista at Starbucks or flipping burgers at McDonalds. And these numbers only apply to people over the age of 25 (so they have had some time to settle in).
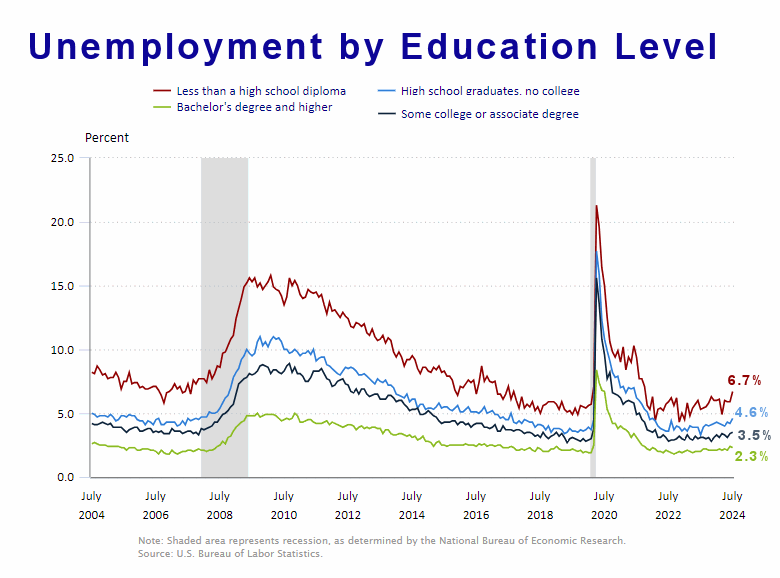
Source: BLS
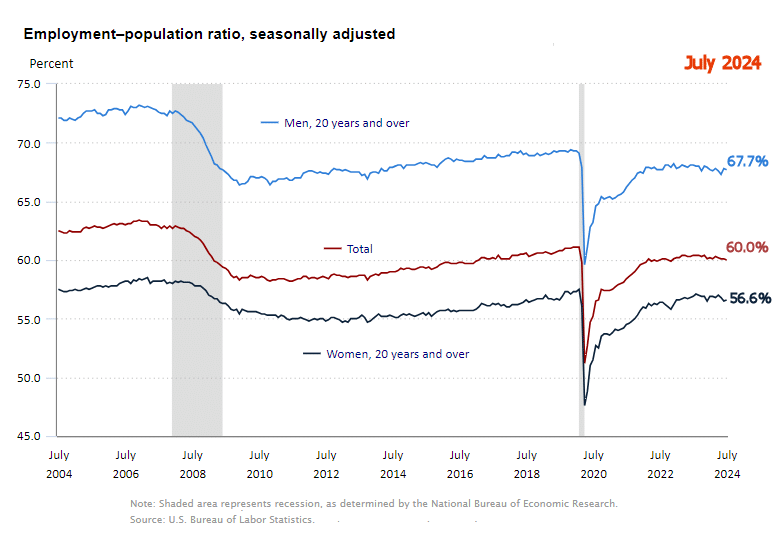
Employment-Population Ratio
This charts shows the Employment-Population Ratio by gender. Showing that Men make up a much larger portion of the workforce, i.e., 67.7% of men are employed (compared to 67.8% last month) and only 56.6% of women are employed. But…
As you can see 20 years ago, back in 2004, almost 72% of men were working and 57% of women were working. In 2008 the Great Recession caused a massive decline in employment for both men and women. By December of 2009, only 66.4% of men were working and 55.4% of women. Over the next decade, women workers rebounded to 57.5% but men only rebounded to 69.3%.
Now less than 68% of men are working and less than 57% of women are working, so it isn’t women who have left the workforce but men. Perhaps there are more stay-at-home Dads because their wives could earn more? Or more men decided to retire in 2009 and 2020, rather than bother returning to the workforce.
 Read more on UnemploymentData.com.
- Why Consumer Sentiment Fell To A Seven-Month Low
- The American Labor Market: Fact vs. Fiction
- Unlocking The Value Of A “Career College” Degree In Today’s Economy
From InflationData.com
- Inflation Causes Inequality
- Navigating High Inflation: Should You Buy, Sell, or Hold Off on Real Estate?
- Annual Inflation Falls Below 3%
- Inflation’s Hidden Impact on Healthcare: What’s Driving Costs Up?
- The Death of the PetroDollar
From Financial Trend Forecaster
- Moore Inflation Predictor
- NYSE ROC
- NASDAQ ROC
- Canada’s Economic Crisis
- Crypto: Crash or Opportunity?
- Bureaucracy: The Red Tape that Prevents Economic Growth
- How Washington and the Fed Caused the Commercial Real Estate Crisis
- The Results Are In: Free Market Capitalism Improves Lives
- Elliott Wave Analysis of Bitcoin
- Is a China-Taiwan Conflict Likely? Watch the Region’s Stock Market Indexes
- What New York City’s Art Auctions Tell You About the Stock Market — and Social Mood
- Why You Should Pay Attention to This Time-Tested Indicator Now
- Gold: Setting Near-Term Price Targets
From OptioMoney
- Financial Considerations When Moving to Florida
- Splitting Your Golden Years:
- Home-Buying Guide for Newlyweds
- Smart Ways to Save for a Rainy Day Fund
From Your Family Finances