
January 2022 Unemployment report from the Bureau of Labor Statistics (BLS)
![]()
- Adjusted U-3 was UP from 3.9% to 4.0%
- Unadjusted U-3 was Up from 3.7% to 4.4%
- Unadjusted U-6 was Up from 7.2% to 7.9%
- Labor Force Participation Up from 61.9% 62.2%
- Unadjusted Employment fell from 150.349 million to 147. 525 million
January 2022 Unemployment report: Establishment news media chose to put a positive spin on this month’s Jobs report focusing on the Bureau of Labor Statistics 467,000 jobs number. U.S. News says, US Economy Defies Omicron and Adds 467,000 Jobs in January. Long-time readers of this site will remember that this is a Seasonally Adjusted number based on the “Current Population Survey (CPS)” rather than looking at the results reported by actual companies in their “Current Employment Statistics survey (CES)”. As we explain below, more people were NOT employed in January than in December all that the adjusted number indicates is that fewer people lost their jobs in January than in a typical January. In actuality, there were 2.6 million fewer employed in January 2022 than in December 2021 and even the Seasonally Adjusted Unemployment rate INCREASED from 3.9% to 4.0% while UNADJUSTED unemployment increased even more.
According to the Commissioner of the U.S. Bureau of Labor Statistics:
“Nonfarm payroll employment increased by 467,000 in January, and the unemployment rate was little changed at 4.0 percent. Employment growth continued in leisure and hospitality, in professional and business services, in retail trade, and in transportation and warehousing. Employment has increased by 19.1 million since April 2020 but is down by 2.9 million, or 1.9 percent, from its level before the onset of the coronavirus (COVID-19) pandemic in February 2020. Monthly job growth averaged 555,000 in 2021.”
As usual, they are talking about “Seasonally Adjusted Jobs” from the “Current Population Survey (CPS)” rather than looking at the results reported by actual companies in their “Current Employment Statistics survey (CES)”
But looking at the CES report we see…
Originally the BLS reported 150.170 million for December which they adjusted to 150.349 million. For January they are reporting 147.525 million.
which is actually a decrease of 2,645,000 jobs based on their original estimates or a decrease of 2,824,000 based on their updated numbers. Typically January loses a significant number of jobs due to post-holiday layoffs so January employment decreases are not that unusual. But if we look at the adjusted numbers we see that even the seasonally adjusted unemployment was up suggesting that the layoff was a bit worse than usual.
ADP National Employment Report
In addition to the BLS, we can look at the Jobs Report generated by private companies like ADP Research Institute.
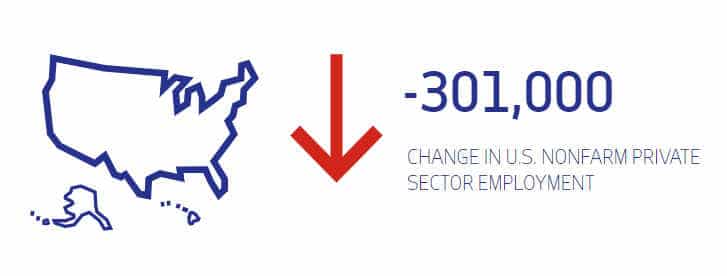
The interesting thing about ADP data is that they also provide breakdowns based on company size. Small businesses with 1-49 employees lost -144,000 jobs, midsized businesses with 50-499 Employees lost -59,000 jobs and large companies with 500 or more employees lost-98,000 jobs.
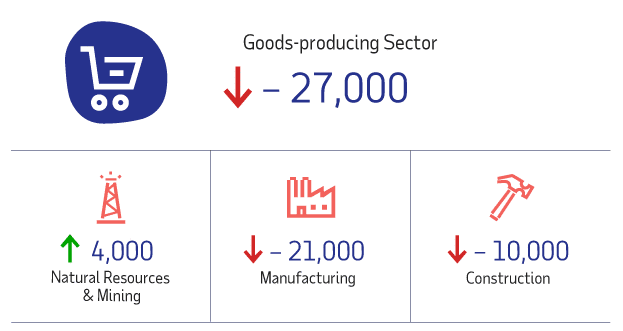
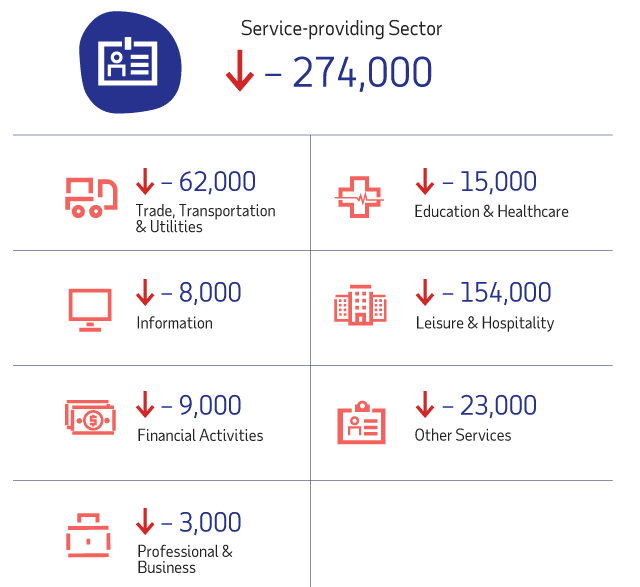
ADP by Sector
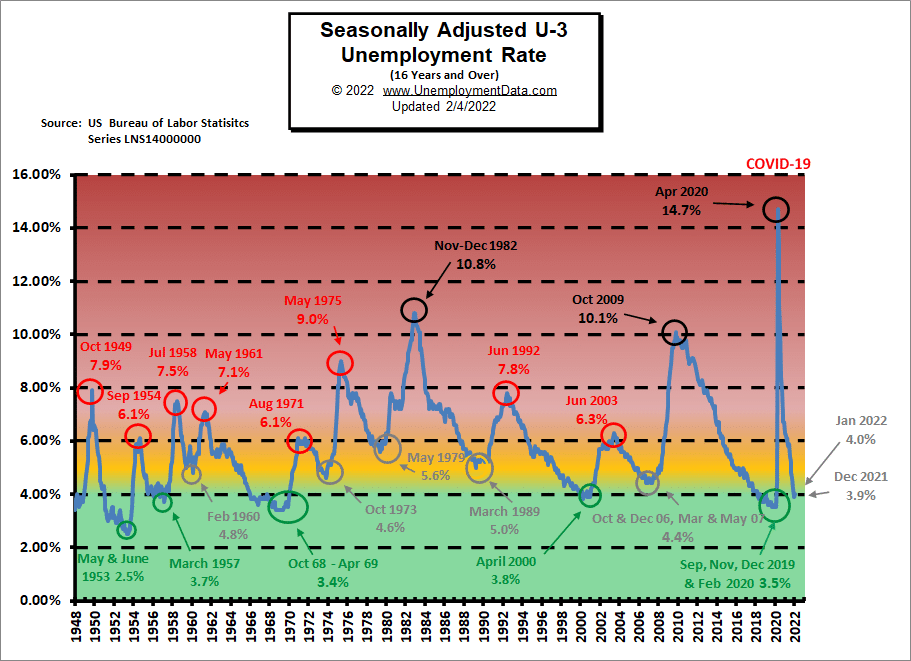
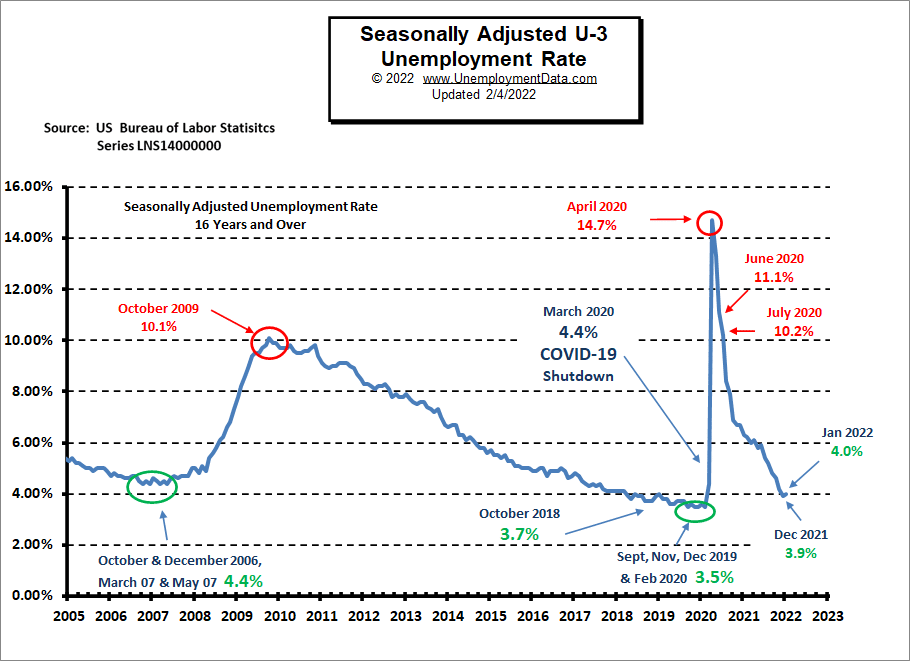
Unemployment Normalizing
Despite the fact that a couple of million seasonal workers were laid-off in January 2022, unemployment is still in the “Green Zone,” indicating that unemployment is doing reasonably well. Rather than a shortage of jobs, anecdotal evidence suggests a lack of workers. Help wanted signs are prevalent, but people seem reluctant to return to work either due to fear of COVID or a realization that spending time with family (or homeschooling) is more important than a second income eaten up by additional childcare, travel, and food preparation costs. This idea is reinforced by the low unemployment numbers combined with a low LFPR indicating many people have left the labor force.
 Click for larger Image
January 2022 Labor Force Participation Rate
LFPR breaks out of its recent channel but is still well below 2019 levels.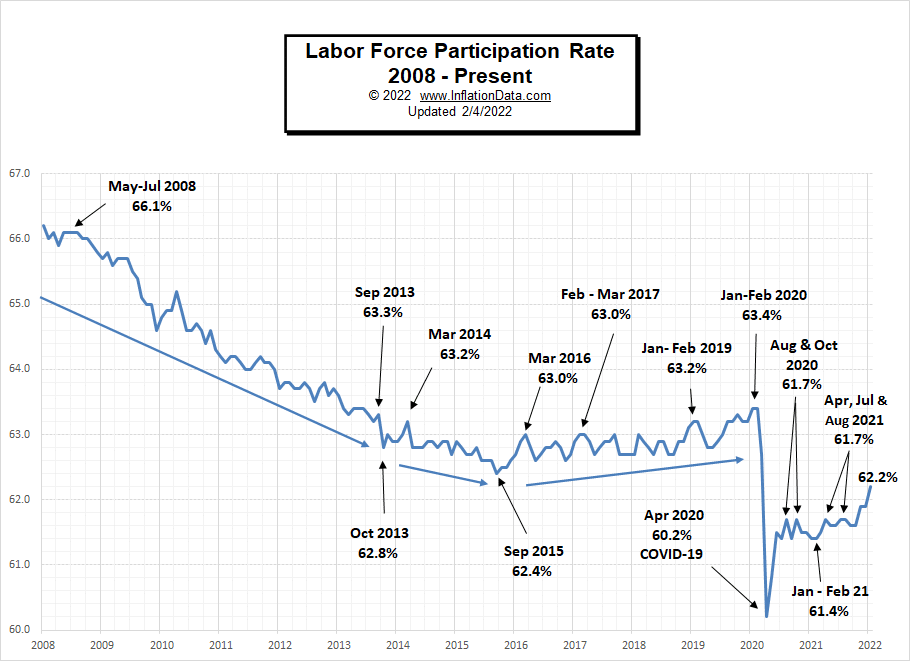
Despite the bullish proclamation by US News, this is really the only positive note in this month’s Labor Report. More people are entering the Labor Force but we are still well below pre-pandemic levels, only now approaching the record lows of 2015 and nowhere near 2008 levels.
As we explain in the page on the Labor Force Participation Rate, the BLS has a strange definition of Labor Force Participation, and so if you “want a job” but don’t look, you aren’t in the Labor Force.
Historical Employment
Employment experienced its typical January pull-back and employment levels have still not returned to pre-pandemic levels. The 2020 COVID scare saw a sharp decline in Employment but a very brief recession.
Note: Despite having a “pandemic,” the U.S. Census Bureau says the U.S. population has still increased by over 3.1 million since February 2020.
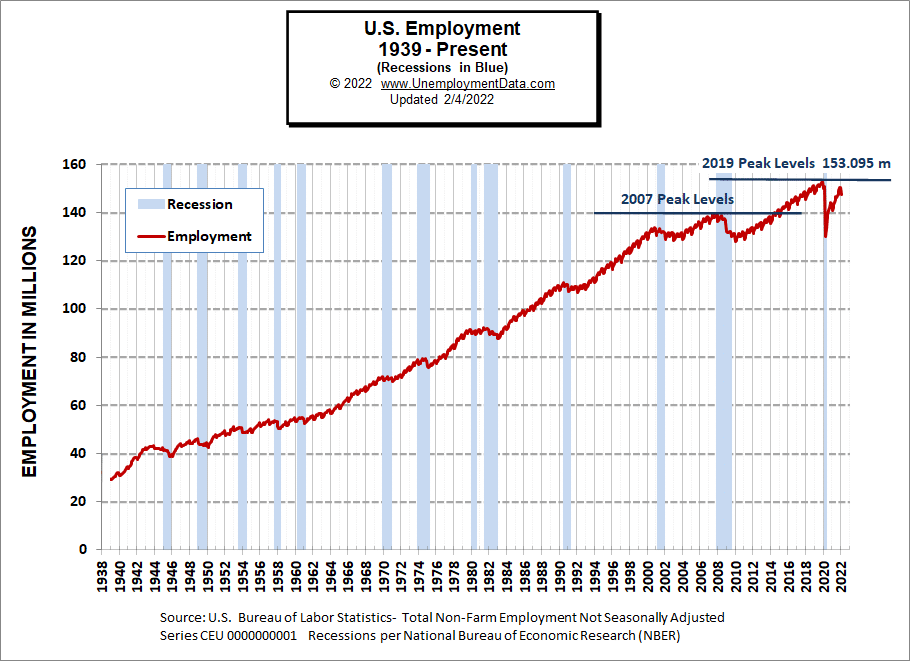
See Historical Employment Data for more info.
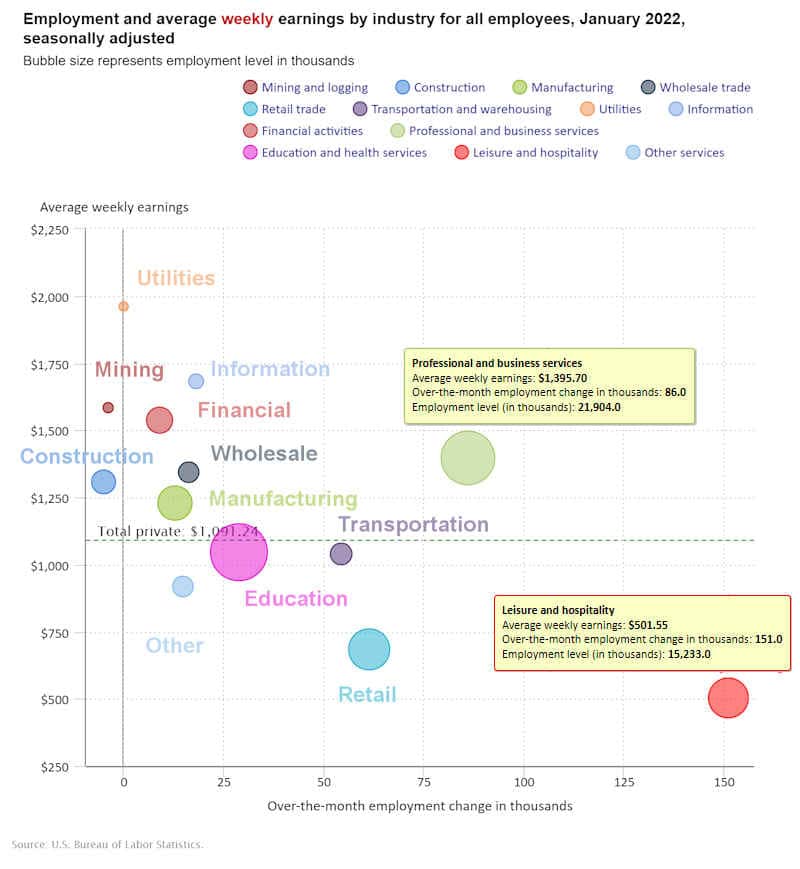
January 2022 Employment by Sector
The employment “bubble chart” is a quick and easy way to see how each sector performs on a seasonally adjusted basis. The Bubble’s Size tells us total Employment for that industry (i.e., larger bubbles mean more people are employed in that sector).
The bubble’s location on the chart tells us that there is a change in Employment Levels over the most recent month… The further to the right the bubble, the larger the number of jobs, and the higher up on the chart, the larger the average salary.
Average weekly wages rose by $6.62 from $1,079.84 in November to $1,086.46 in December.
 Click for larger Image
Remember these are Seasonally Adjusted Numbers! Once again, Leisure and Hospitality was the largest gainer along with Retail, Professional and Business Services, and Transportation. Since retail typically cuts way back in January, but it shows gains this January, it appears that this time stores have decided to hang onto employees since they are becoming harder to find. Typically January is also a bad month for Construction, and Mining and Logging, due primarily to weather-related lay-offs.
Employment and Average Weekly Earnings by Industry
January 2022, Seasonally Adjusted Employment
Average Weekly Earnings $1,091.24 up from $1,086.46 in December.
| Industry | Monthly Increase | Average Weekly Earnings | Employment Level |
| Total Private Employment | 444,000 | $1,091.24 | 127,485,000 |
| Mining and Logging | -4,000 | $1,583.19 | 582,000 |
| Construction | -5,000 | $1,308.06 | 7,523,000 |
| Manufacturing | 13,000 | $1,228.51 | 12,559,000 |
| Wholesale trade | 16,400 | $1,343.87 | 5,768,000 |
| Retail trade | 61,400 | $682.36 | 15,658,400 |
| Transportation and Warehousing | 54,200 | $1,037.70 | 6,336,900 |
| Utilities | 100 | $1,962.65 | 538,000 |
| Information | 18,000 | $1,681.53 | 2,934,000 |
| Financial Activities | 9,000 | $1,535.27 | 8,875,000 |
| Professional and Business Services | 86,000 | $1,395.70 | 21,904,000 |
| Education and Health Services | 29,000 | $1,045.75 | 23,953,000 |
| Leisure and Hospitality | 151,000 | $501.55 | 15,233,000 |
| Other Services | 15,000 | $918.02 | 5,621,000 |
This chart provides another way to look at these monthly numbers. This chart includes government jobs that lost 12,000 jobs in December but gained 23,000 jobs in January.
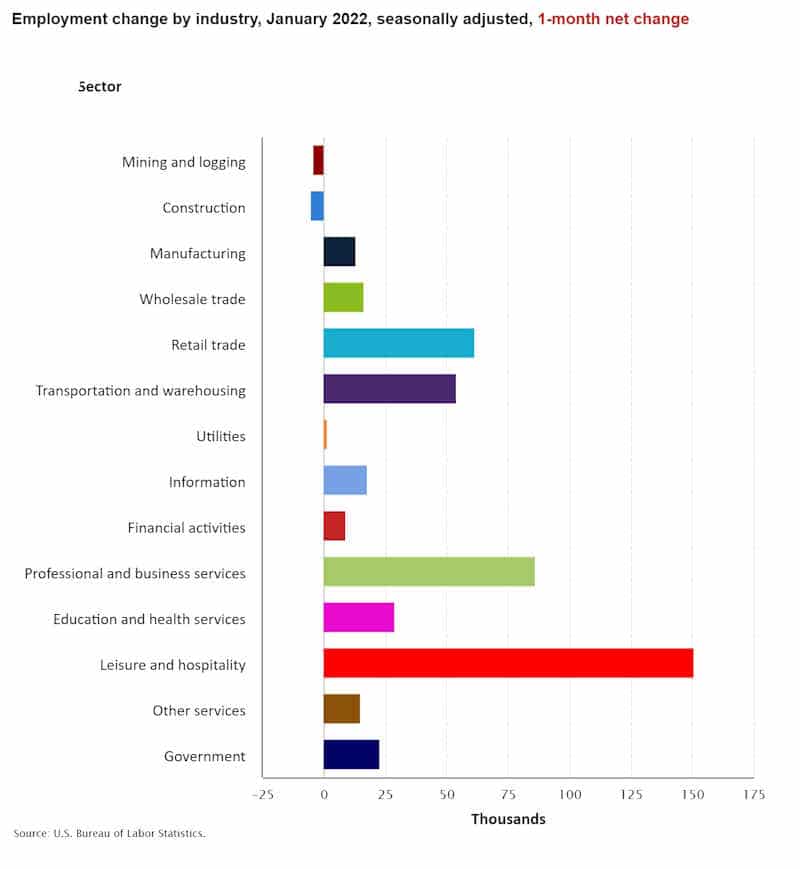
Source: BLS Employment by Industry
But looking at Employment Change by Industry over the last 12 months, we can see that Government gained 356,000 jobs over the year.
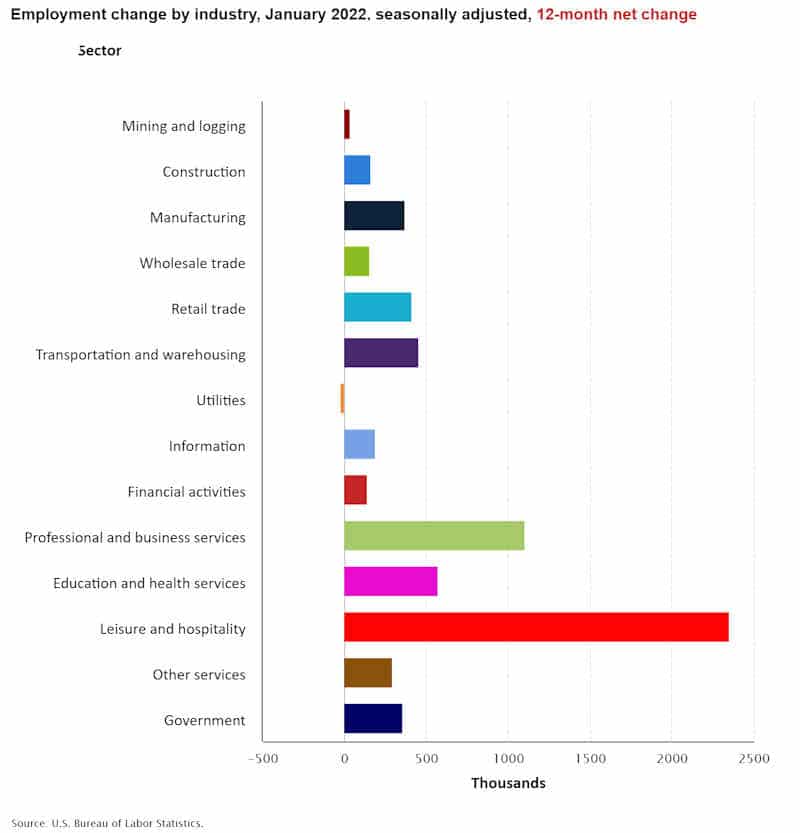 Source: BLS
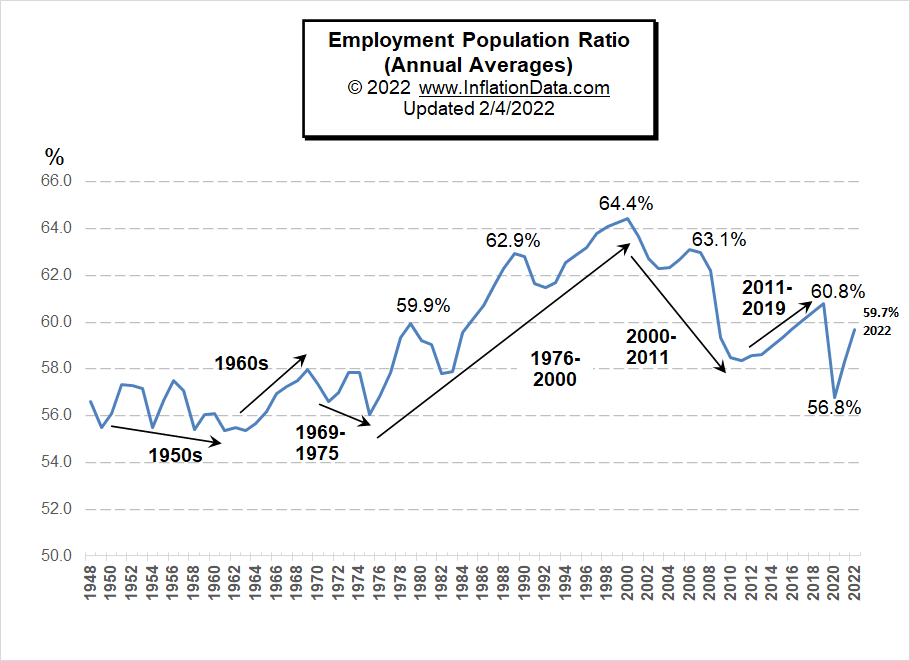
Employment-Population Ratio
This chart shows the actual percentage of the population that’s working, unlike the Labor Force Participation Rate, which shows the portion of the population working or looking for work. The Annual Average Employment-Population Ratio for 2021 was 58.3%. For January 2022 alone, it was up to 59.7%.
By looking at annual averages rather than monthly numbers, we can see the long-term trends in the percentage of the population that is working. For more information and the full commentary on these trends, see Employment-Population Ratio.
Seasonally Adjusted U1 through U6 Unemployment Rates
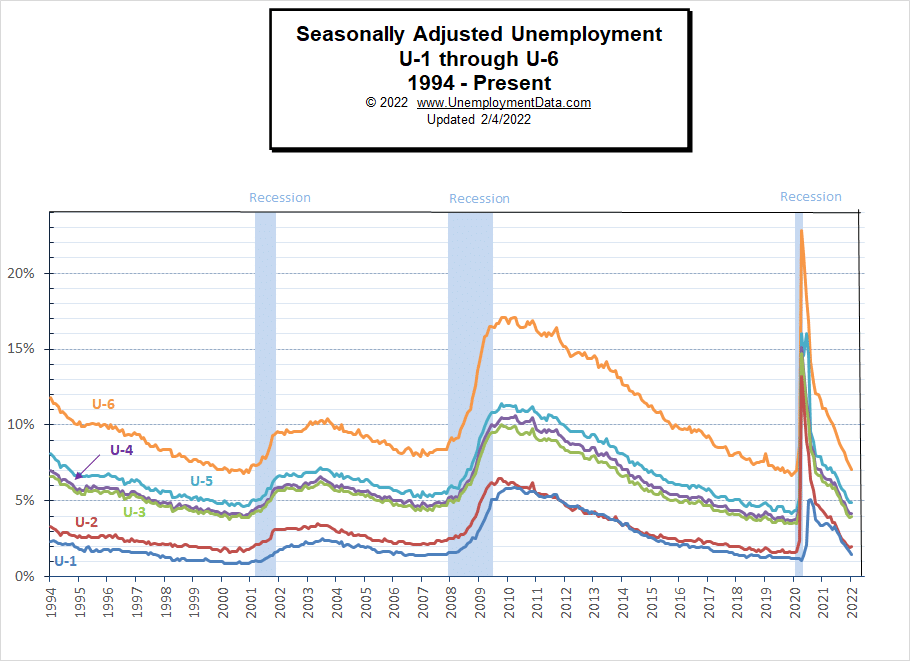
For more information about the various measurements of unemployment, see What Is U-6 Unemployment?
Current January 2022 Employment
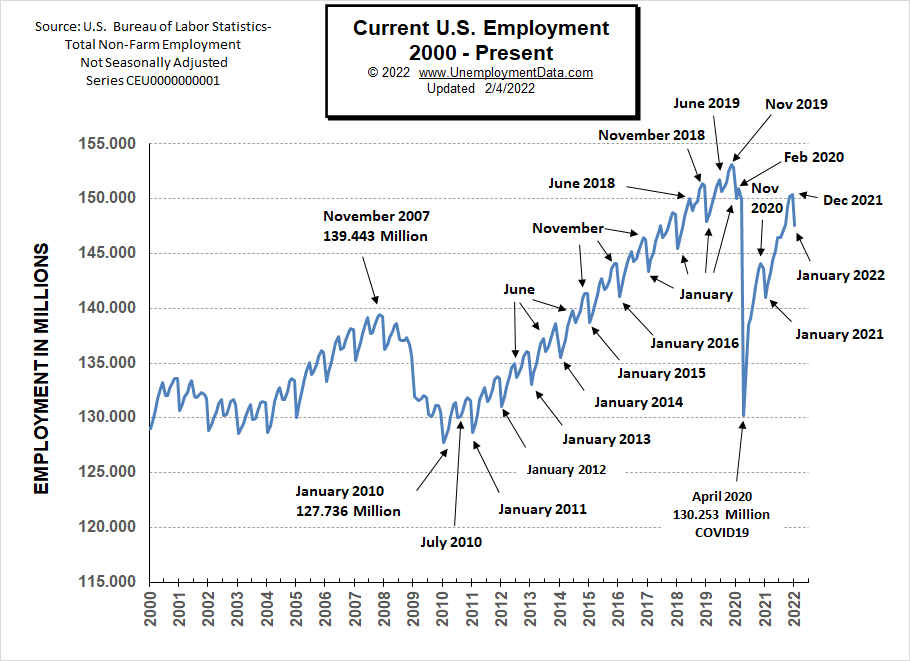
Actual January employment declined and is well below February 2020 and November 2019 levels, plus the Civilian Non-Institutional Population (not the total Census Bureau Population) has increased by 3,574,000 since then.
See Current Employment for more info.
January 2022 Unemployment Report (Seasonally Adjusted)
 Click for larger Image
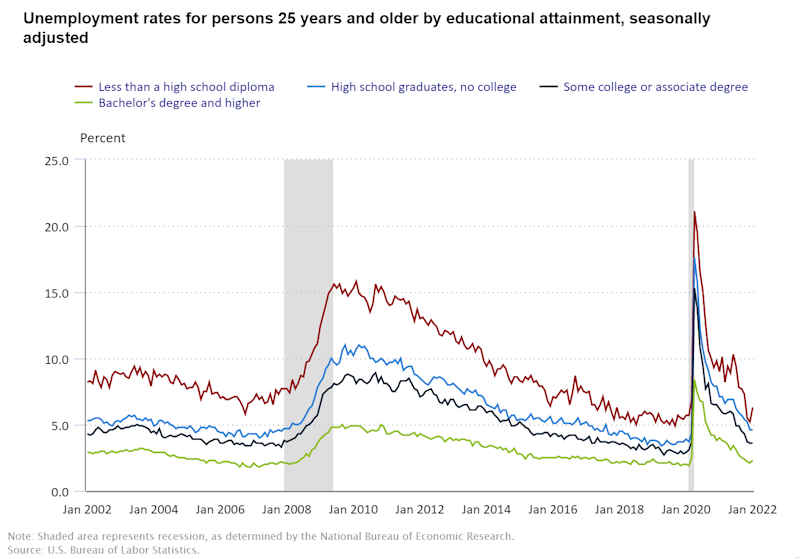
Unemployment by Education
Once again we can see that those with the least education were hit the hardest by lay-offs. Primarily because employers can easily replace them later. Those with specialized knowledge and/or skills are retained at all costs. The unemployment rate for Bachelor’s degree holders is typically between 2% and 3%, except when times are exceptionally bad.
Click for larger Image
Click here if you would like to receive this monthly report and other article updates. You can unsubscribe at any time.
Here are some articles you might enjoy if you missed them:
Read more on UnemploymentData.com.
- December Unemployment Rates by State
- Secure Careers That Don’t Require A Lot Of Education
- No Work Experience? Here Are Some Interesting Job Possibilities
- Exciting Marketing Careers You May Not Know About
From InflationData.com
- When Is Inflation Good for the Economy?
- December 2021 Inflation 5 Times as High as Last December
- Spoiler: The FED Guaranteed To Fight Inflation… Sooner Or Later
- Why Quantitative Easing is Inflationary
- Millennials Have Never Seen Inflation This High
- Is Bitcoin a Better Inflation Hedge Than Gold?
- How Nixon’s Revolutionary Move Influenced U.S. Inflation For 50 Years
From Financial Trend Forecaster
- Moore Inflation Predictor
- NYSE ROC
- NASDAQ ROC
- Technology And The Semiconductor Chip Shortage
- Alternative House Building Methods
- How Blockchain’s Unique Innovations Can Prevent Money Remittance Scams
- Are 3D Printed Houses the Trend of the Future?
- Metaverse vs. Multiverse- What are They? And Where are They Leading?
- Curing Cancer with T-Cells
- Warning: Mergers And Acquisitions Can Vaporize The Stock Market
- Is the Correction Over?
- Euro: Look at This Head & Shoulders Chart Formation
- Has Crypto-Mania Finally Run Its Course?
- Are Disease Outbreaks Market Indicators?
From OptioMoney.com
- Buying A Home When You Are Already In Debt
- Top 10 Tasks Businesses Should Outsource in 2022
- 7 Unexpected Costs Of Moving To A New Home
- 4 Simple Growth Management Tips for Small Business Owners
- Portfolio Diversification: The Key to Financial Stability
From Your Family Finances