
![]() The U.S. Bureau of Labor Statistics (BLS) released its employment / unemployment report for January on February 7th.
The U.S. Bureau of Labor Statistics (BLS) released its employment / unemployment report for January on February 7th.
Last month we told you that the employment report was not as bad as the media tried to paint it. This month The New York Times is saying “Job Growth Gives the Economy an Upbeat Start to the Year” while Marketwatch calls the Labor Market “Astounding” and once again we have a slightly different opinion.
Yes, we are still in record low territory and that won’t change overnight. Seasonally adjusted Unemployment only notched up 1/10th of a percent and the Labor Force Participation Rate (LFPR) has entered territory that it hasn’t seen in years… BUT the unadjusted numbers jumped up significantly (as they do every year) and the BLS adjusted the Population numbers DOWN significantly. This adjustment is what the pundits are not seeing and what makes me think the numbers may not be quite as good as they appear i.e. lower population means a higher percentage appears to be working (even though the actual unadjusted employment fell). This could have given the LFPR the apparent boost and made the Adjusted U-3 increase by less than it would have without the population adjustment. This is still not a bad employment report just perhaps not as rosy as the media made it sound.
Key January Employment and Unemployment Numbers
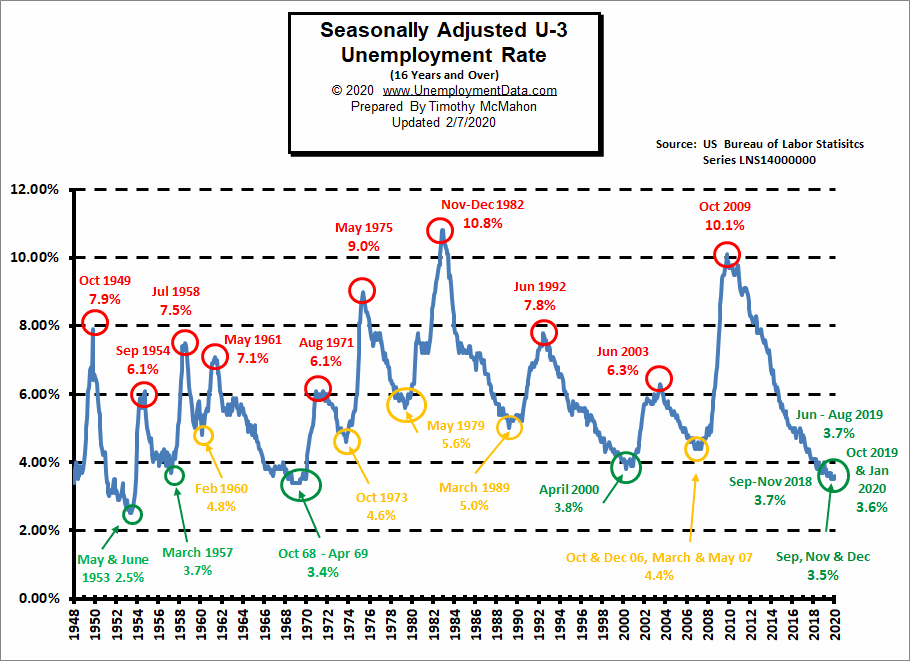
- Unadjusted U-3 Unemployment- 4.0% Up from December’s 3.5%… Typically up in January, it was 4.4% in January 2019.
- Adjusted U-3 Unemployment- 3.6% Up from 3.5% in December.
- Unadjusted U-6 Unemployment- 7.7% Up from 6.7% in December… was 8.8% in January 2019.
- Unadjusted Employment (Establishment Survey)- 150.102 million down from 152,934 in December.
- Labor Force Participation Rate- 63.4% Up from 63.2%.
According to the Commissioner of the U.S. Bureau of Labor Statistics:
Nonfarm payroll employment rose by 225,000 in January, and the unemployment rate was little changed at 3.6 percent.
Notable employment gains occurred in construction, in health care, and in transportation and warehousing.
In 2019, job growth averaged 175,000 per month.Of course, he is talking about “Seasonally Adjusted Jobs” from the “Current Population Survey (CPS)”
rather than looking at the results reported by actual companies in their “Current Employment Statistics survey (CES)” which showed a non-adjusted drop of 2.8 million jobs.For more info see our Current Unemployment Chart and Current U.S. Employment Chart commentary.
Employment by Sector
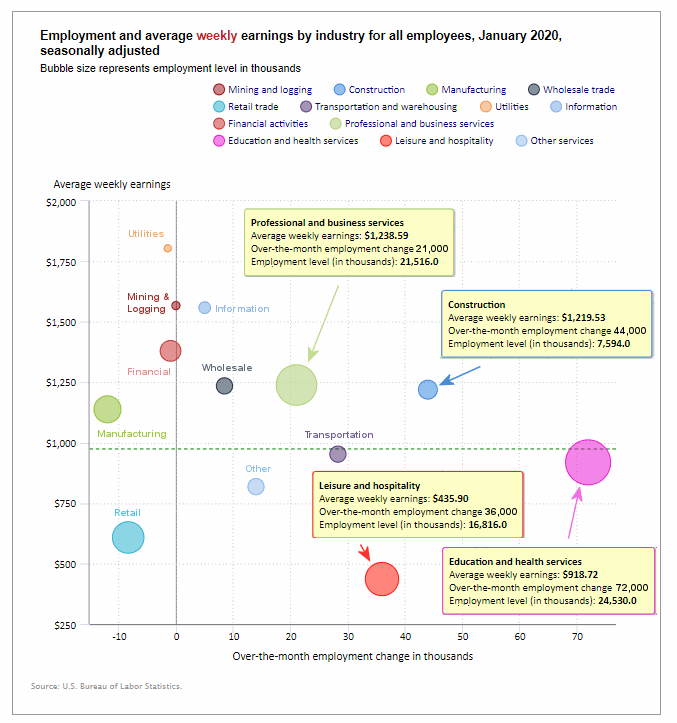
The employment “bubble chart” gives us a good representation of how each sector of the economy is doing (employment wise on a seasonally adjusted basis). Last month, the biggest gainer (furthest to the right on the chart) was Retail with an increase of 41.2 thousand jobs. This month it moved almost furthest to the left with a loss of 8,300 jobs which of course were seasonal workers. A bigger surprise was the furthest to the left and that was the manufacturing sector with the loss of 12,000 jobs. Those were the two biggest losers with utilities losing 1,400, Financial activities losing 1,000 and Mining & Logging unchanged.
Gainers were: Information adding 5,000 jobs, Wholesale added 8,400 jobs, Other Services added 14,000 jobs, Professional and Business Services added 21,000 jobs, Transportation and Warehousing added 28,300 jobs, Leisure and Hospitality added 36,000 jobs, Construction added 44,000 jobs, and the big gainer of the month was Education and Health Services added 72,000 jobs.
Average weekly wages rose slightly in January from December’s $971.38 to $975.49 above the $973.18 in November up from $969.39 in October and $959.76 in June.
(See the table below for details.)
How to read this chart:
Bubbles location on the chart tell us two things:
- Change in Employment Levels over the most recent month.
- Average Weekly earnings.
- The further to the right the bubble the larger the increase in the number of jobs.
- The higher up on the chart the larger the average salary.
Bubble Size tells us:
- Total Employment for the sector.
- Larger bubbles mean more people are employed in that sector.
Employment and Average Weekly Earnings by Industry
January 2020, Seasonally Adjusted
| Industry | Monthly Increase | Average Weekly Earnings | Employment Level |
| Total Private Employment | 206,000 | $975.49 | 129,503,000 |
| Mining and Logging | 0 | $1,567.27 | 713,000 |
| Construction | 44,000 | $1,219.53 | 7,594,000 |
| Manufacturing | -12,000 | $1,138.07 | 12,851,000 |
| Wholesale trade | 8,400 | $1,235.08 | 5,944,200 |
| Retail trade | -8,300 | $607.93 | 15,667,400 |
| Transportation and Warehousing | 28,300 | $952.71 | 5,690,200 |
| Utilities | -1,400 | $1,804.45 | 546,500 |
| Information | 5,000 | $1,558.77 | 2,887,000 |
| Financial Activities | -1,000 | $1,379.92 | 8,808,000 |
| Professional and Business Services | 21,000 | $1,238.59 | 21,516,000 |
| Education and Health Services | 72,000 | $918.72 | 24,530,000 |
| Leisure and Hospitality | 36,000 | $435.90 | 16,816,000 |
| Other Services | 14,000 | $818.24 | 5,940,000 |
U1 through U6 Unemployment Rates
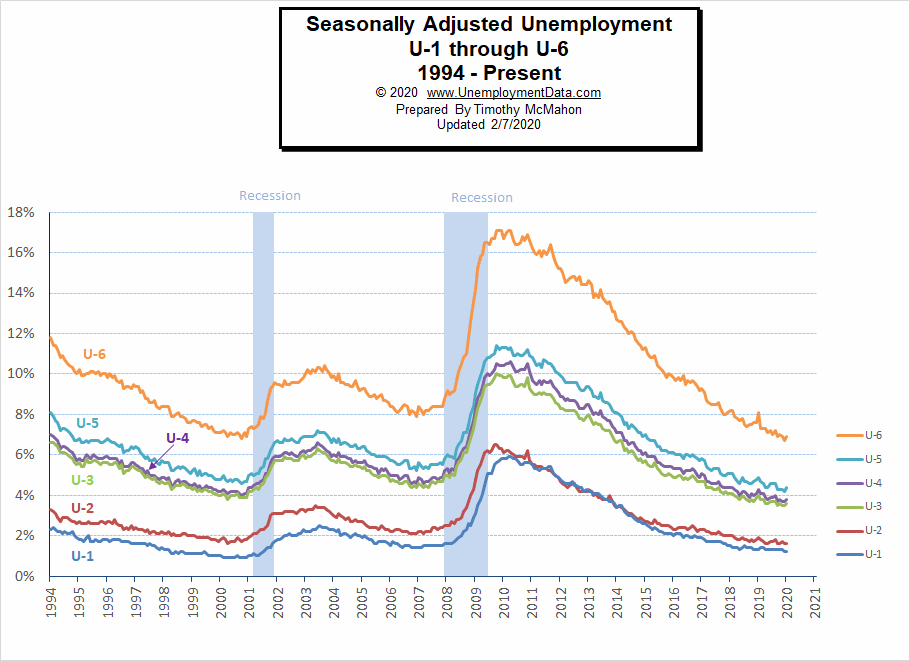
As we can see from the above chart all the various measurements of Seasonally Adjusted Unemployment from U-1 through U-6 are near or below record lows. U-3 through U-6 ticked up for the month while U1 and U-2 actually fell. For more information about the various measurements of unemployment see What Is U-6 Unemployment?
Duration of Unemployment
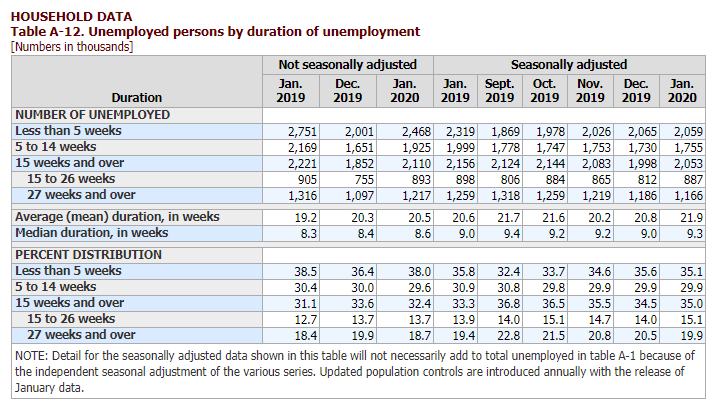
Obviously, the worse the economy is, the longer it takes for the average person to find a job. But not everyone can find a job in 5 weeks or less no matter how good the economy is. Generally, those are the people who already have a job when they leave their old job. But the falling number of people taking over 27 weeks to find a new job is a good indicator of a healthy economy.
On a seasonally adjusted basis we can see that those unemployed for 27 weeks or more decreased from 20.5% to 19.9% meaning that the ranks of the long term unemployed decreasing which is a very good thing.
Source: Bureau of Labor Statistics
Labor Productivity
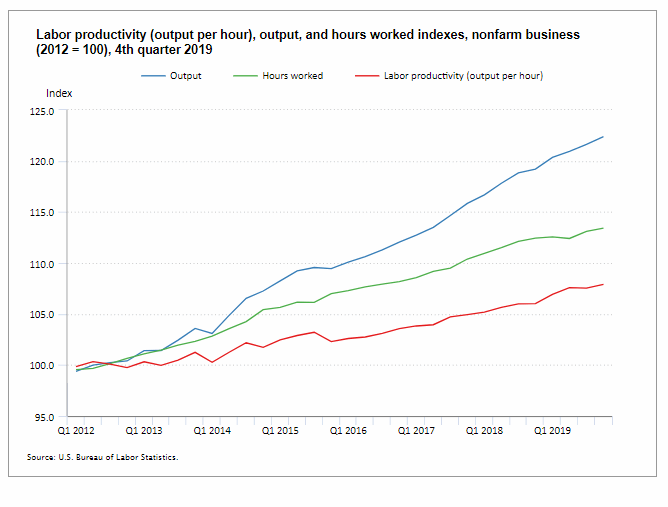 Output, Hours worked and Labor Productivity are all on health upward trends.
Data Source: BLS Labor Productivity
Previous Record Low Unemployment (Seasonally Adjusted U-3)
If we consider anything 4% or below as “low” we have had a few “low” stretches as we can see in the table below.
(4% or below in Green)
| Jan | Feb | Mar | Apr | May | Jun | Jul | Aug | Sep | Oct | Nov | Dec | |
| 1950 | 6.5% | 6.4% | 6.3% | 5.8% | 5.5% | 5.4% | 5.0% | 4.5% | 4.4% | 4.2% | 4.2% | 4.3% |
| 1951 | 3.7% | 3.4% | 3.4% | 3.1% | 3.0% | 3.2% | 3.1% | 3.1% | 3.3% | 3.5% | 3.5% | 3.1% |
| 1952 | 3.2% | 3.1% | 2.9% | 2.9% | 3.0% | 3.0% | 3.2% | 3.4% | 3.1% | 3.0% | 2.8% | 2.7% |
| 1953 | 2.9% | 2.6% | 2.6% | 2.7% | 2.5% | 2.5% | 2.6% | 2.7% | 2.9% | 3.1% | 3.5% | 4.5% |
| 1954 | 4.9% | 5.2% | 5.7% | 5.9% | 5.9% | 5.6% | 5.8% | 6.0% | 6.1% | 5.7% | 5.3% | 5.0% |
| 1955 | 4.9% | 4.7% | 4.6% | 4.7% | 4.3% | 4.2% | 4.0% | 4.2% | 4.1% | 4.3% | 4.2% | 4.2% |
| 1956 | 4.0% | 3.9% | 4.2% | 4.0% | 4.3% | 4.3% | 4.4% | 4.1% | 3.9% | 3.9% | 4.3% | 4.2% |
| 1957 | 4.2% | 3.9% | 3.7% | 3.9% | 4.1% | 4.3% | 4.2% | 4.1% | 4.4% | 4.5% | 5.1% | 5.2% |
| 1958 | 5.8% | 6.4% | 6.7% | 7.4% | 7.4% | 7.3% | 7.5% | 7.4% | 7.1% | 6.7% | 6.2% | 6.2% |
| … | … | … | … | … | … | … | … | … | … | … | … | … |
| 1965 | 4.9% | 5.1% | 4.7% | 4.8% | 4.6% | 4.6% | 4.4% | 4.4% | 4.3% | 4.2% | 4.1% | 4.0% |
| 1966 | 4.0% | 3.8% | 3.8% | 3.8% | 3.9% | 3.8% | 3.8% | 3.8% | 3.7% | 3.7% | 3.6% | 3.8% |
| 1967 | 3.9% | 3.8% | 3.8% | 3.8% | 3.8% | 3.9% | 3.8% | 3.8% | 3.8% | 4.0% | 3.9% | 3.8% |
| 1968 | 3.7% | 3.8% | 3.7% | 3.5% | 3.5% | 3.7% | 3.7% | 3.5% | 3.4% | 3.4% | 3.4% | 3.4% |
| 1969 | 3.4% | 3.4% | 3.4% | 3.4% | 3.4% | 3.5% | 3.5% | 3.5% | 3.7% | 3.7% | 3.5% | 3.5% |
| 1970 | 3.9% | 4.2% | 4.4% | 4.6% | 4.8% | 4.9% | 5.0% | 5.1% | 5.4% | 5.5% | 5.9% | 6.1% |
| … | … | … | … | … | … | … | … | … | … | … | … | … |
| 1999 | 4.3% | 4.4% | 4.2% | 4.3% | 4.2% | 4.3% | 4.3% | 4.2% | 4.2% | 4.1% | 4.1% | 4.0% |
| 2000 | 4.0% | 4.1% | 4.0% | 3.8% | 4.0% | 4.0% | 4.0% | 4.1% | 3.9% | 3.9% | 3.9% | 3.9% |
| 2001 | 4.2% | 4.2% | 4.3% | 4.4% | 4.3% | 4.5% | 4.6% | 4.9% | 5.0% | 5.3% | 5.5% | 5.7% |
| … | … | … | … | … | … | … | … | … | … | … | … | … |
| 2018 | 4.1% | 4.1% | 4.1% | 3.9% | 3.8% | 4.0% | 3.9% | 3.9% | 3.7% | 3.7% | 3.7% | 3.9% |
| 2019 | 4.0% | 3.8% | 3.8% | 3.6% | 3.6% | 3.7% | 3.7% | 3.7% | 3.5% | 3.6% | 3.5% | 3.5% |
| 2020 | 3.6% |
Employment
Historically employment is closely tied to recessions and that is no accident. One of the primary factors in calculating whether the economy is officially in a recession is an increase in the unemployment rate. The chart below provides the Historical Employment Data overlaid on blue bars showing periods of official recessions.
In January actual employment fell from the originally reported 153.342 million in December to 150.102 million in January on an unadjusted basis.
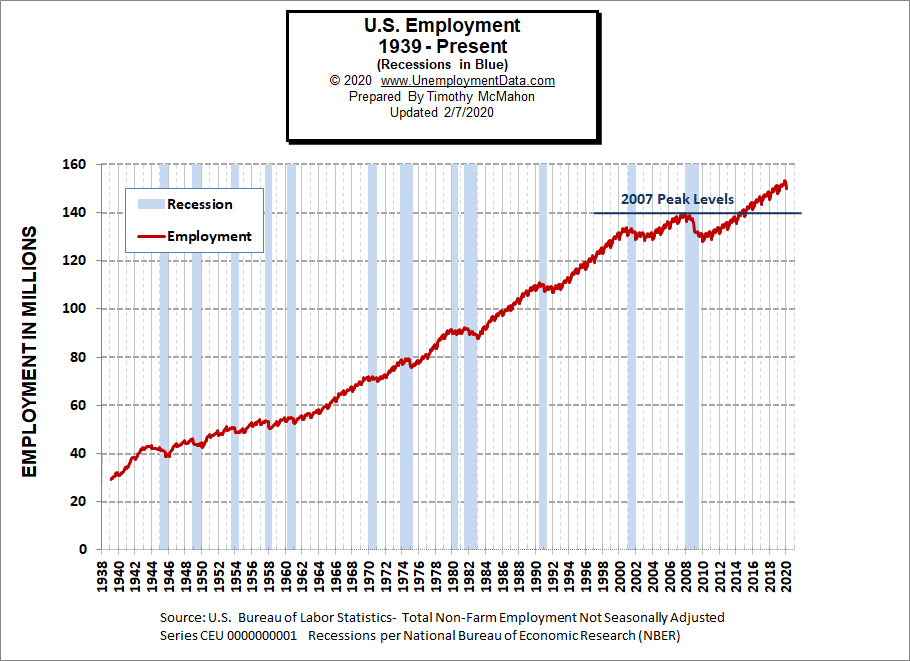
See Historical Employment Data for more info.
Current Employment
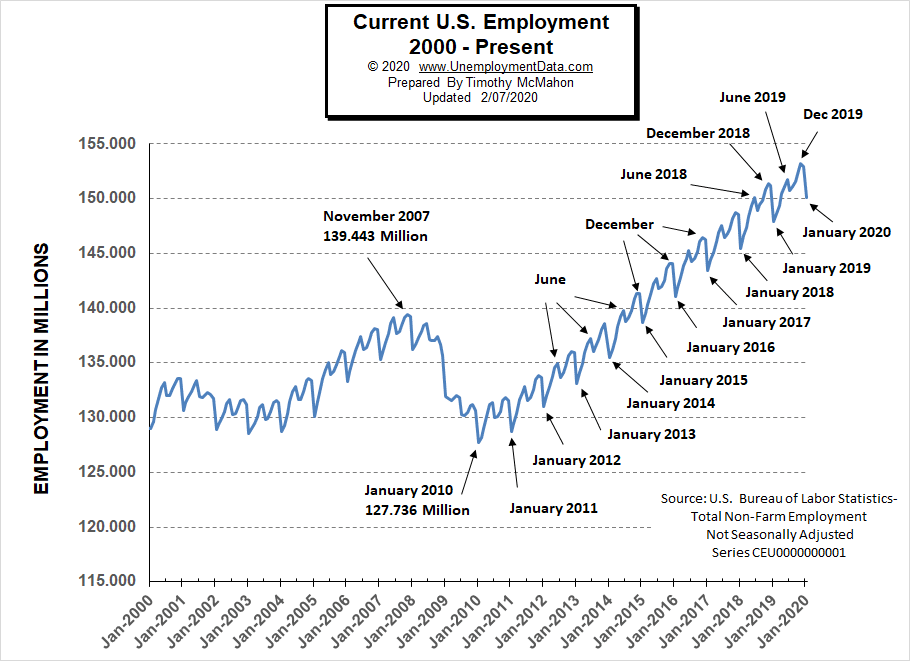
From the above current employment chart, we can see that the low point for each year occurs in January and then a small peak occurs around June with a slight drop around July and then the highest peak in employment happens in November/December. So the drop in January was expected.
See Current Employment for more info.
Labor Force Participation Rate
The Current Labor Force Participation Rate for December 2019 was unchanged from November at 63.2% down slightly from 63.3% in October.
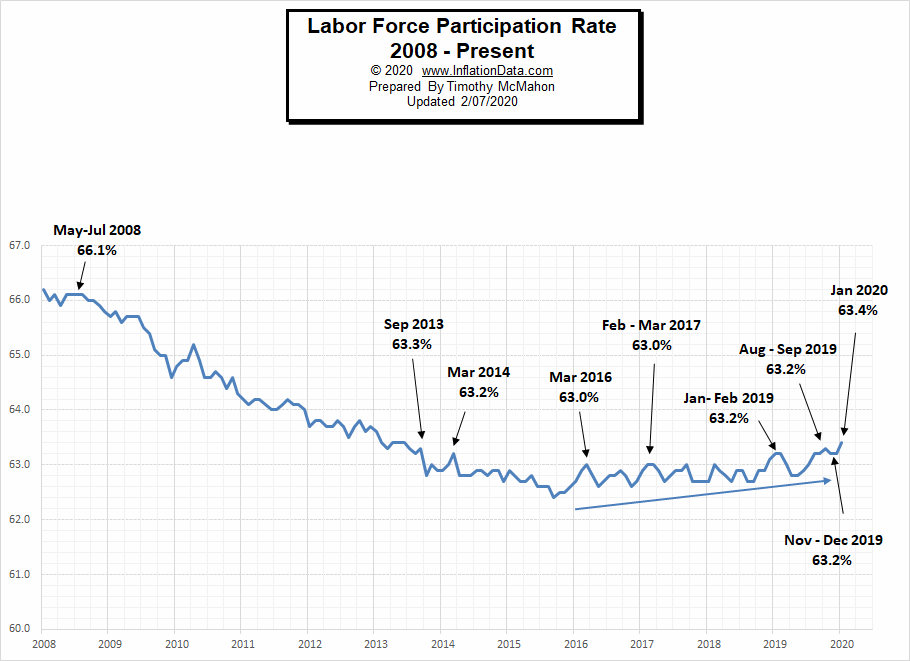
See Labor Force Participation Rate for more information.
If you would like to receive this monthly report and other article updates click here you can unsubscribe at any time.
Here are some articles you might enjoy in case you missed them:
Read more on UnemploymentData.com.
- Intrapersonal Intelligence
- Give Your Resume a Boost by Increasing Your Skill Set
- How to Get Recruiters on Linkedin (And Land That Dream Job!)
- How to Fund a Personal Injury Lawsuit to Get the Settlement You Need
- The 10 Highest Paying Jobs in the Oil & Gas Industry
From InflationData.com
- December Inflation is Up
- November Annual Inflation Jumps Up But…
- October Inflation has Slight Increase
- Modern Monetary Theory
- Investing to Fight Inflation
- Cumulative Inflation By Category 1996-2016
- If Everything Big is Increasing in Cost at Some Rate Faster than Inflation Why Hasn’t Inflation Risen to Match?
From Financial Trend Forecaster
- Financial Real Estate Trends Investors Should Understand for 2020
- Gold is Still King of the Investing Market
- The Markets in Perspective: What Goes up Must Come down?
- Is Bill Gates Right On Energy Investing?
- The Oil Crisis Saudi Arabia Can’t Solve
- 5 Ways Automation Has Changed the Financial World
- Asteroid Mining: Science Fiction or Science?
- Repeating Patterns in Human Behavior
- The Beginning of a Long-Term “Secular” Bull Market?
- What Does this Rare & Rapid Drop in Manufacturing Mean?
- Bullish Signal Has Only Happened 10 Times in the Last 94 Years.
- Spotting a 178-Year-Old Firm’s Collapse… 2 Years in Advance
- Trade, Impeachment, and the Conviction of Buyers and Sellers
From OptioMoney.com
- Learning to Trade from Video Tutorials
- How Saxo Bank Democratizes Trading and Investment
- Five Business Tips to Help Your Company Thrive
- Have Minimal Car Insurance? What to Do in Case of an Accident
- How to Choose a Residential Roofing Contractor
- Avoid a Money Pit: 4 Vital Inspection Items before Buying an Older Home
- 3 Benefits of Finding a Reliable Family Lawyer
- 4 Hidden Car Costs
From Your Family Finances