
The U.S. Bureau of Labor Statistics (BLS) released its employment / unemployment report for February on March 8th, 2024.
Employment / Unemployment
![]()
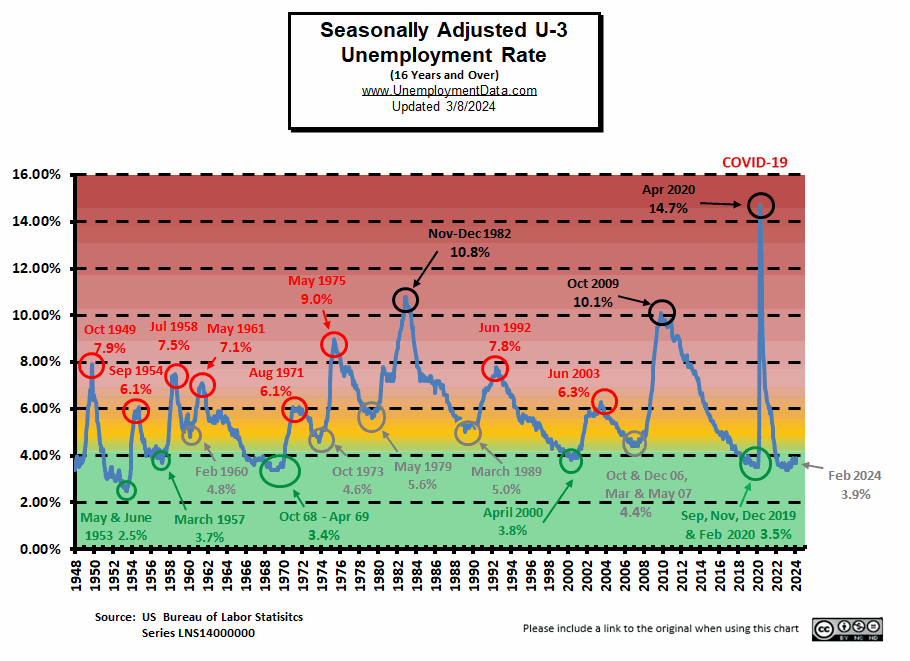
- Seasonally Adjusted U3- 3.9% up from 3.7% in January
- Unadjusted U3- 4.2% up from 4.1% in January
- Unadjusted U6- 7.8% down from 8.0% in January
- Labor Force Participation Rate 62.5% -unchanged
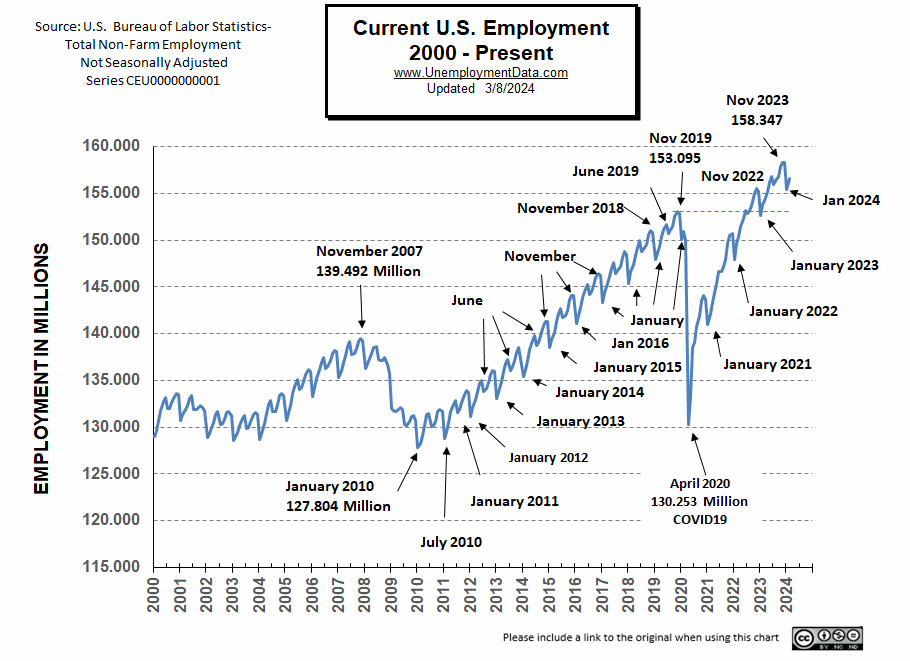
- Employment 156.555 million up from 155.414 million
Summary:
Although employment rose, U3 Unemployment also rose in February in both adjusted and unadjusted rates. Unadjusted U6 fell, but adjusted U6 rose from 7.2% to 7.3%. Labor Force Participation was unchanged.
According to the Commissioner of the U.S. Bureau of Labor Statistics:
“Total nonfarm payroll employment rose by 275,000 in February, and the unemployment rate increased to 3.9 percent, the U.S. Bureau of Labor Statistics reported today. Job gains occurred in health care, in government, in food services and drinking places, in social assistance, and in transportation and warehousing…”
“Among the major worker groups, the unemployment rates for adult women (3.5 percent) and teenagers (12.5 percent) increased over the month…”
“Among the unemployed, the number of permanent job losers increased by 174,000 to 1.7 million in February.”
You can read the full BLS report here.
As usual, they are talking about “Seasonally Adjusted Jobs”.
Looking at the Unadjusted Establishment Survey report we see…
Originally the BLS reported employment of 155.626 million for January which they adjusted to 155.414 million (for a loss of 212,000 jobs). They are currently reporting 156.555 million jobs for February which is actually a gain of 929,000 jobs compared to their original numbers. But many of these jobs came from government, and social assistance plus food services and drinking places. These are not the type of jobs that build a robust economy. And permanent job losers are increasing.
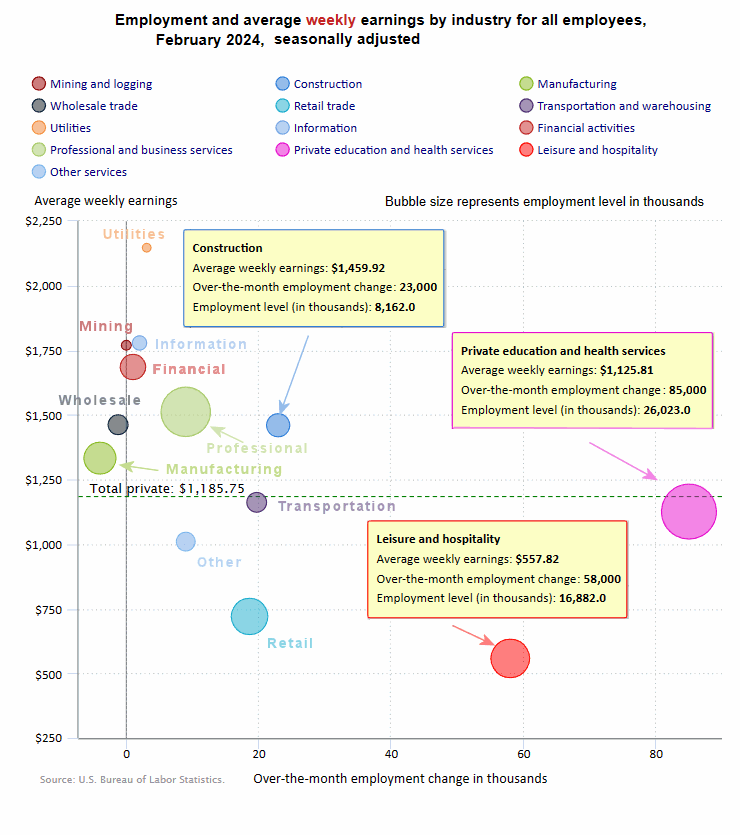
Current Unemployment Rate Chart
Seasonally Adjusted U3 Unemployment is above the pre-COVID 2019 cyclical lows of 3.5% as well as above the lows made early in 2023. Current levels are nearing the beginning of the “Yellow Zone”.
Current Employment Rate
At 156.555 million, February Employment is up from the originally reported 155.626 million and the adjusted 155.414 in January.
Typically, the low point for each year occurs in January and then employment moves almost straight up to a small peak around June with a slight drop around July, and then the highest peak in employment happens in November with a slight decline in December.
Employment is 1.11 million Above Year-Ago Levels
and 5.587 million above February 2020 (prior to the Covid Crash)
However, the Civilian Population has increased by about 8.083 million since February 2020.
 2023 Summary
In January 2023, we had the typical drop taking employment slightly below the 2019 peak. In June, employment at 156.905 million was above the November 2022 peak. And in July we got the typical slight drop to 156.126 million. August and September followed the typical pattern with September very slightly higher than June.
See Current Employment for more information.
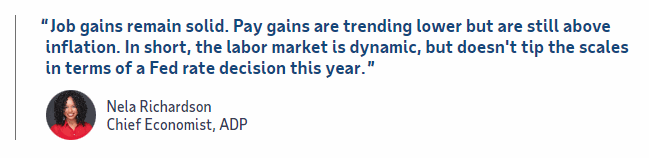
ADP® National Employment Report
ADP provides an independent (non-government) estimate of private-sector employment and pay, based on data derived from ADP client payrolls. According to ADP®, In collaboration with Stanford Digital Economy Lab.
ADP: Private employers added 140,000 jobs in February
- While employment growth remained steady, pay gains for job-changers accelerated for the first time in more than a year, rising to 7.6 percent from 7.2 percent.
Source: ADP® Pay Insights
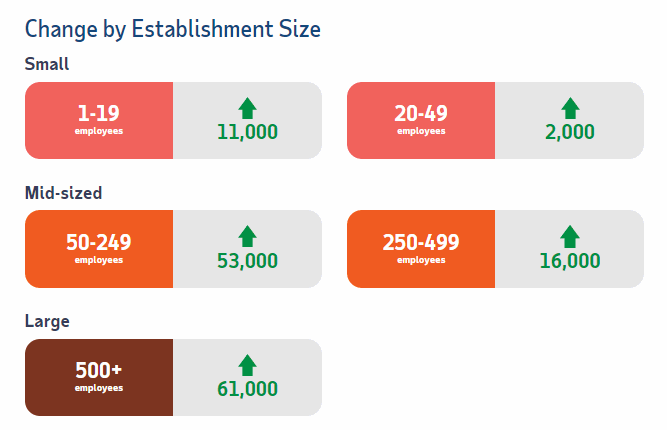
ADP Private Employment by Firm Size
ADP also lists increases by “firm size”.
February ADP Changes:
ADP Job Gainers
ADP provides an entirely different picture of the job situation compared to the BLS perspective showing gains in almost all sectors.
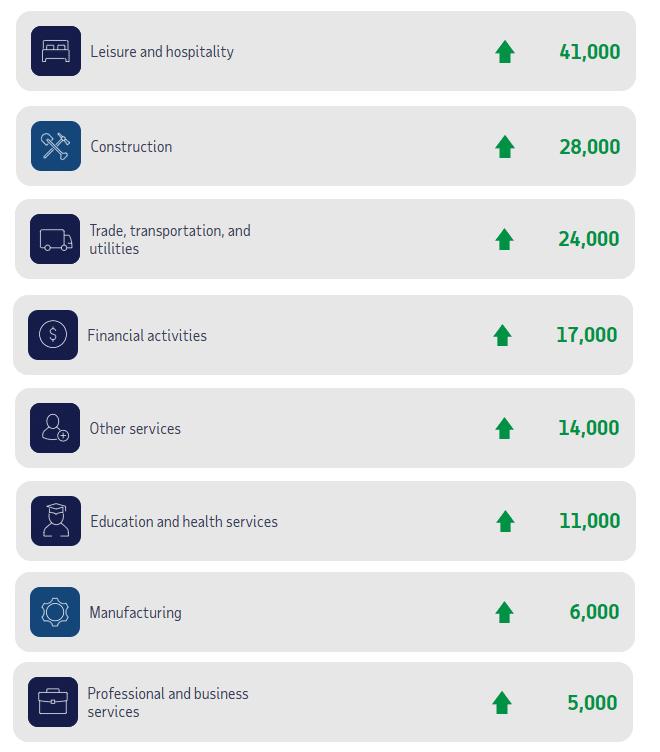
ADP Job Losers
Only two sectors showed fewer employees in February, i.e., Mining and Information.
BLS: February 2024 Employment by Sector
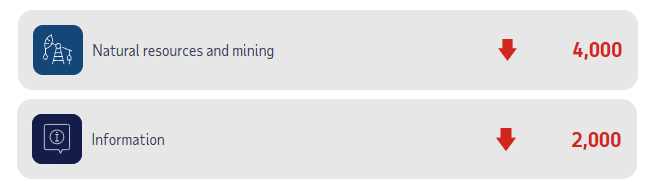
The BLS employment “bubble chart” based on the Establishment Survey Data gives us a comparable picture to the ADP data using Seasonally adjusted numbers but the various sector gains and losses don’t always agree.
The Bubble’s Size tells us the total Employment for that industry (i.e., larger bubbles mean more people are employed in that sector).
The bubble’s location on the chart tells us that there has been a change in Employment Levels over the most recent month… A bubble further to the right indicates larger job growth. A bubble’s vertical location on the chart shows the average industry salary.
Remember, these are Seasonally Adjusted Numbers, so they aren’t cumulative!
According to the BLS Education and Health added 85,000 jobs and Leisure and Hospitality Services added 58,000 jobs. However, we need to remember that these are “seasonally adjusted jobs”. According to the BLS Non-Adjusted data, they are currently reporting 156.555 million jobs for February which is actually a gain of 929,000 jobs compared to their original numbers. But many of these jobs came from government, and social assistance plus food services and drinking places. These are not the type of jobs that build a robust economy. And permanent job losers are increasing.
 BLS Average Weekly Wages
| Date | Average Weekly Wage |
| February 2024 | $1,185.75 |
| January 2024 | $1,178.16 |
| December 2023 | $1,175.46 |
| November 2023 | $1,173.04 |
| October 2023 | $1,166.20 |
| September 2023 | $1,165.47 |
| August 2023 | $1,163.41 |
| July 2023 | $1,157.28 |
| June 2023 | $1,155.15 |
| May 2023 | $1,146.99 |
| April 2023 | $1,147.58 |
| March 2023 | $1,141.34 |
| February 2023 | $1,141.61 |
| January 2023 | $1,146.14 |
| December 2022 | $1,125.73 |
| November 2022 | $1,129.01 |
| October 2022 | $1,124.01 |
| September 2022 | $1,119.87 |
| August 2022 | $1,116.42 |
| July 2022 | $1,116.54 |
| June 2022 | $1,106.76 |
| May 2022 | $1,105.47 |
| April 2022 | $1,102.01 |
| December 2021 | $1,086.46 |
BLS Employment and Average Weekly Earnings by Industry
February 2024, Seasonally Adjusted Employment
We’ve added a column to the table below showing the employment levels the BLS reported the previous month. Note that due to “seasonal adjusting,” although they may claim that there was a “monthly increase” (or decrease), there isn’t always an actual increase; you can’t just subtract last month’s “employment level” from this month’s level. For instance, Mining employment was supposed to have stayed steady in February. But January had 635,000 and February had 640,000 which looks more like an 5,000 increase. And Manufacturing went from 12,979,000 to 12,964,000 but on an adjusted basis had a -4,000 decrease instead of a -15,000 decrease.
| Industry | Monthly Increase | Feb. Ave. Weekly Earnings | Feb. Employment Level | Jan. Employment Level |
| Total Private Employment | 223,000 | $1,185.75 | 134,628,000 | 134,609,000 |
| Mining and Logging | 0 | $1,769.40 | 640,000 | 635,000 |
| Construction | 23,000 | $1,459.92 | 8,162,000 | 8,137,000 |
| Manufacturing | -4,000 | $1,332.66 | 12,964,000 | 12,979,000 |
| Wholesale trade | -1,200 | $1,461.95 | 6,155,000 | 6,164,900 |
| Retail trade | 18,700 | $720.27 | 15,636,600 | 15,658,800 |
| Transportation and Warehousing | 19,700 | $1,161.66 | 6,511,400 | 6,556,000 |
| Utilities | 3,200 | $2,146.73 | 588,900 | 585,500 |
| Information | 2,000 | $1,778.14 | 3,020,000 | 3,032,000 |
| Financial Activities | 1,000 | $1,685.24 | 9,233,000 | 9,248,000 |
| Professional and Business Services | 9,000 | $1,511.69 | 22,931,000 | 22,978,000 |
| Private Education and Health Services | 85,000 | $1,125.81 | 26,023,000 | 25,943,000 |
| Leisure and Hospitality | 58,000 | $557.82 | 16,882,000 | 16,824,000 |
| Other Services | 9,000 | $1,009.70 | 5,881,000 | 5,868,000 |
Source: BLS
Unemployment
February’s Seasonally Adjusted Unemployment is up from 3.7% to 3.9%.
 February’s Labor Force Participation Rate
The LFPR is unchanged at 62.5%.
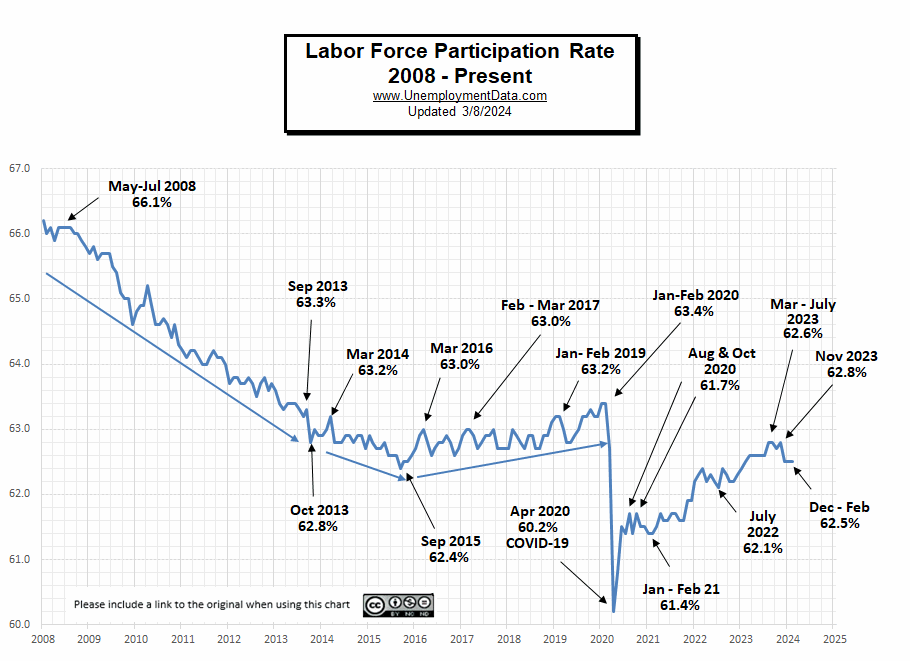 See Labor Force Participation Rate for more information.
Receding from Full Employment
This chart compares employment levels with the (inverted) unemployment rate.
Full Employment is when everyone who wants a job has one. It is generally considered to be around 3%. After the unemployment rate almost touched the magic full employment line in April, it began moving away (i.e., higher unemployment). And in January it retreated further from full employment.
Note: The Unemployment rate is inverted to track the employment rate. Neither is Seasonally Adjusted. For more information see Employment vs. Unemployment.
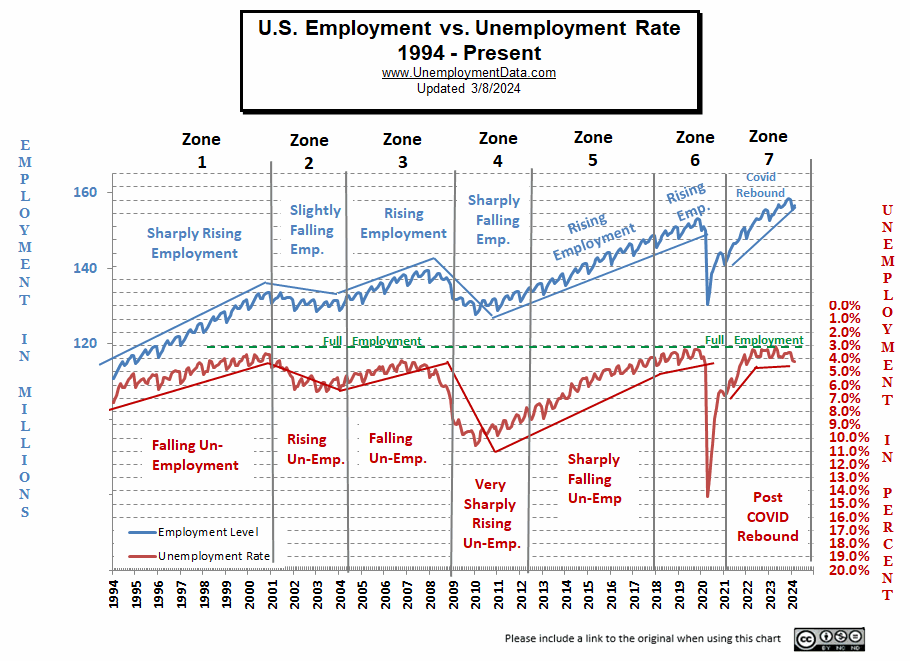
Note: Full employment is not considered to be at zero percent because even when employers are having difficulty finding employees, some people are still unemployed due to either structural unemployment (mismatch between worker skills and job requirements, i.e., not enough training) or simply because they quit their job knowing it would be easy to find another (hopefully better) job. Often referred to as frictional unemployment (there will always be people who have quit or have lost a seasonal job and are in the process of getting a new job).
Seasonally Adjusted U1 through U6 Unemployment Rates
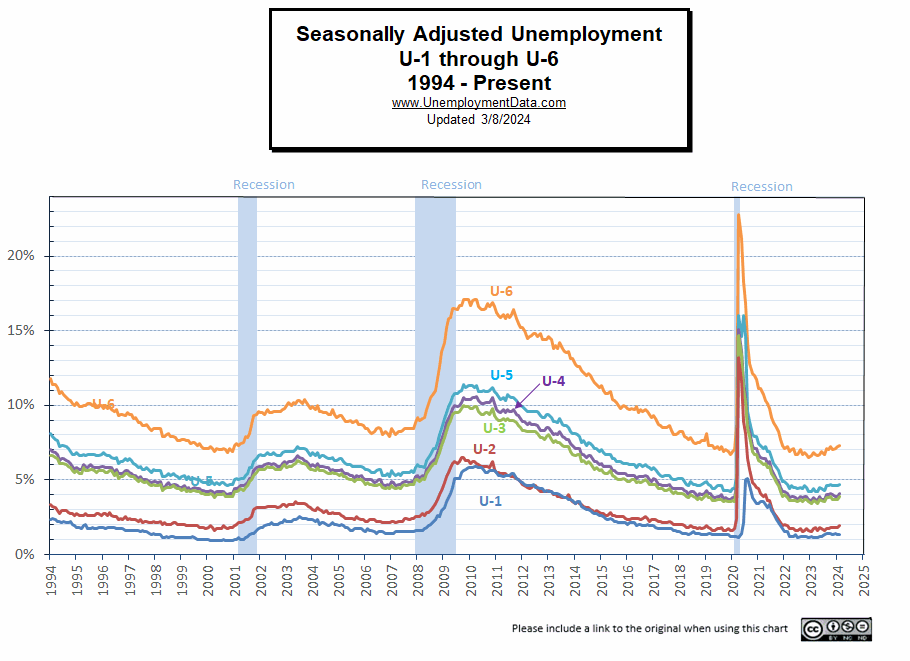 For more information about the various measurements of unemployment, see What Is U-6 Unemployment?
Seasonally Adjusted Unemployment by Education
Although Adjusted U6 fell from 8.0% to 7.8% in February, unemployment by the less educated rose from 6.0% to 6.1%.
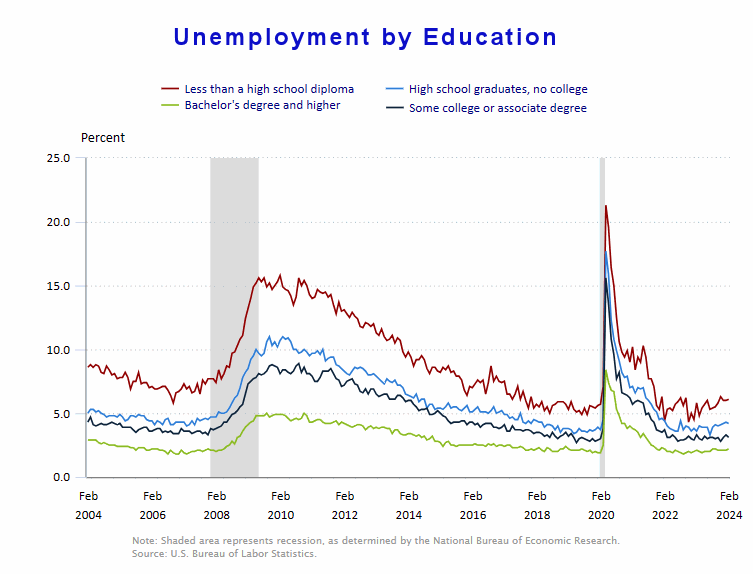 Source: BLS
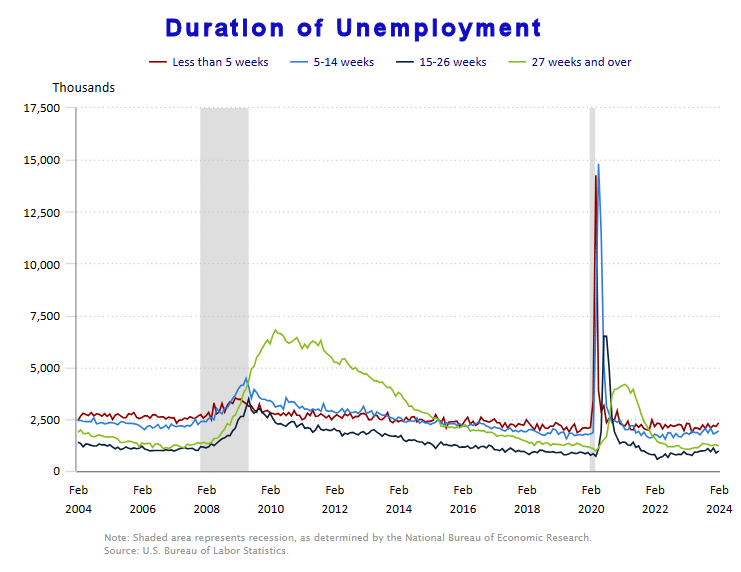
Duration of Unemployment
Early signs of weakness are when people stay unemployed for longer, i.e., when the 5-14 week line (blue) crosses above the 5 week (red) line. Fortunately, the red line is still on top. Final confirmation of a full-blown recession happens when the 27 week line (green) crosses to the top. This often remains, long after the official recession ends.
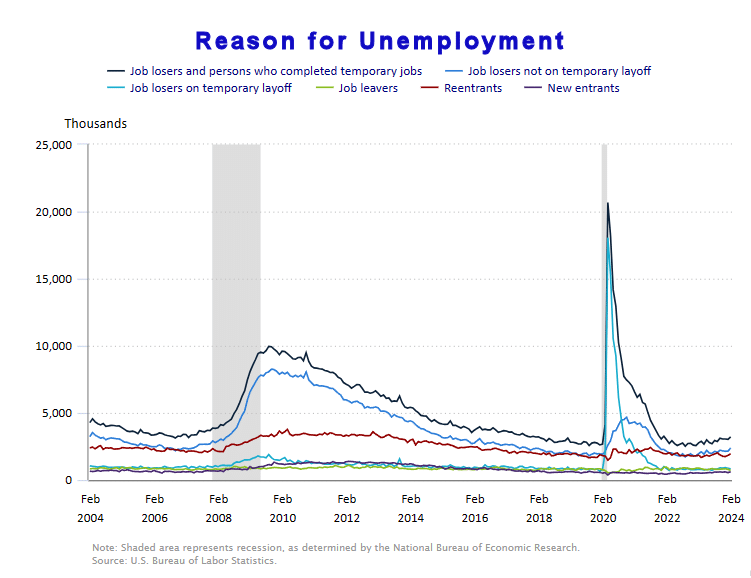
Reason for Unemployment
The majority of the unemployed are still temporary workers but their numbers seem to be rising slightly over the last year.
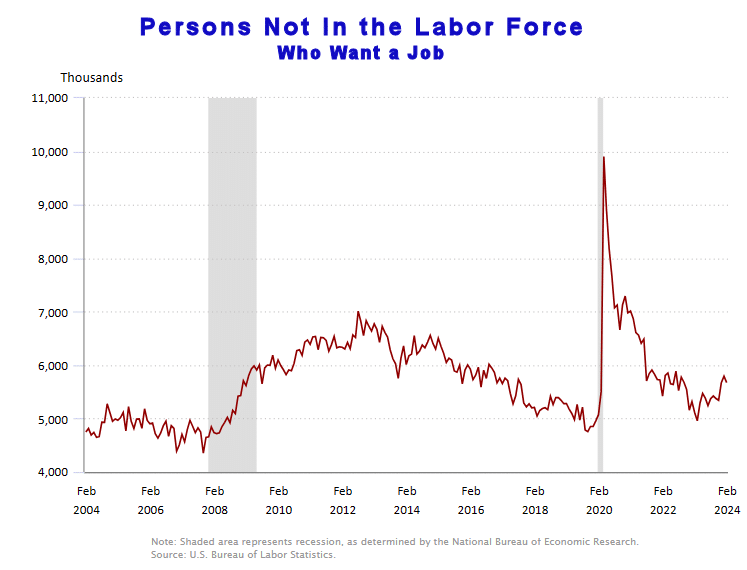
Persons Not in the Labor Force
This is an interesting category. According to the BLS “Persons not in the Labor Force” are those who haven’t looked for a job lately. But the BLS somehow tracks those who claim to want a job but just haven’t bothered to look for one, ostensibly because they believe none are available. Over the last year, this number has been increasing (although it declined in February). An increase would indicate a deteriorating social mood as more people believe jobs aren’t available.
Employment-Population Ratio
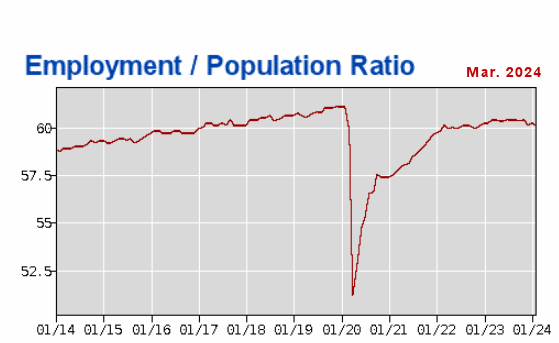
The Employment / Population ratio was 60.5% in November, December was 60.1%, 60.2% in January, and 60.1% in February.
See Employment Population Ratio for more information.
Read more on UnemploymentData.com.
- Introducing the Career Of Freight Broker
- What To Know Before Applying to Colleges for Military Preparation
- Why Strategic Brand Marketing Is Crucial for Small Business Success
- Want to Go Into Trucking? 5 Things to Know Beforehand
From Inflationdata.com
- Inflation, High Inflation, and Hyperinflation
- January 2024 Annual Inflation Down Despite High Monthly Inflation
- Industries Most Affected by Inflation: Insights from the Global Supply Chain
- Have Wages Kept Up with Inflation in 2023?
- Not All Prices Have Inflated Since 1964
- Worldwide Inflation by Country in 2023
From Financial Trend Forecaster
- Moore Inflation Predictor
- NYSE ROC
- NASDAQ ROC
- Argentina Sees First Monthly Budget Surplus in 12 Years
- Federal Student Loans Drive Up College Tuition Levels
- America’s Fiat Money Gestapo: The Untold History of the Secret Service
- Argentina Mulls Dollarization- What is it?
- U.S. Real Estate: A 24% Problem
- Update on China’s Big Housing Bust
- Mini-Manias: Beware Short-Term Trading Frenzies – Like This One
- Why You Should Expect a Once-in-a-Lifetime Debt Crisis
- Why Do Traders Really Lose Money?
From Optio Money
- Navigating Currency Exchange: Maximizing Your Money When Moving Abroad
- The True Cost of Neglect: How Deferred Home Maintenance Creates Money Pits
- Financial Factors to Consider When Relocating Your Business
- Nomad Living: Managing Finances for a Mobile Lifestyle
- Financial Resilience in Uncertain Times
From Your Family Finances