
![]() The U.S. Bureau of Labor Statistics (BLS) released its employment / unemployment report for February on March 6th.
The U.S. Bureau of Labor Statistics (BLS) released its employment / unemployment report for February on March 6th.
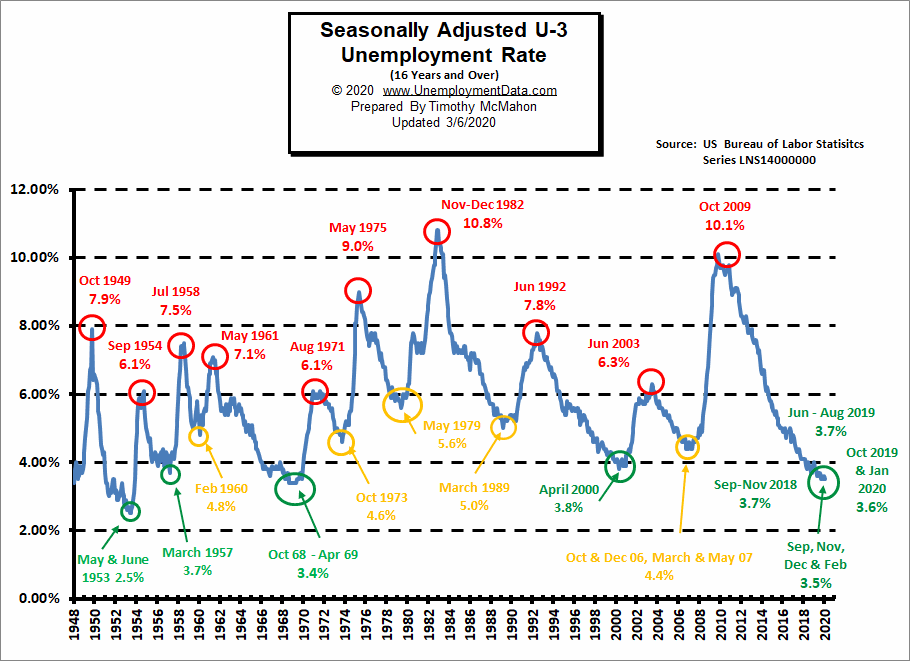
Unemployment returns to 50-year lows. The “Seasonally Adjusted” Unemployment Rate fell from 3.6% in January to 3.5% in February. Thus returning to the previous low levels of September, November, and December after increasing slightly in January.
We are still in record low territory and that won’t change overnight. Seasonally adjusted U-3 Unemployment notched up 1/10th of a percent in January and fell back the same amount in February. The Labor Force Participation Rate (LFPR) remains in territory that it hasn’t seen in years…
This is better than expected results and according to @AP News it shows that “the economy was in strong shape before the coronavirus began to sweep
through the U.S. “
The average monthly wage is up almost $130 over year-ago levels so two-income families are bringing in an average of at least $250 a month more. (See employment by Sector for more info).
This month we will also look at unemployment by Education level, and reasons for unemployment.
February Jobs Report Smashes Expectations
- Unadjusted U-3 was down from 4.0% to 3.8%!
- Adjusted U-3 was down slightly from 3.6% to 3.5%!
- Unadjusted U-6 was down from 7.7% to 7.4%!
- Labor Force Participation remains at the highest level since 2013.
- Unadjusted Employment Up by approx. 880,000 jobs.
According to the Commissioner of the U.S. Bureau of Labor Statistics:
“Nonfarm payroll employment rose by 273,000 in February, and the unemployment rate was little changed at 3.5 percent.
Notable employment gains occurred in health care and social assistance, food services and drinking places, government, construction, professional and technical services, and financial activities.”But, he is talking about “Seasonally Adjusted Jobs” from the “Current Population Survey (CPS)” rather than looking at the results reported by actual companies in their “Current Employment Statistics survey (CES)”
Looking at the CES report we see…
Originally the BLS reported 150.102 million jobs for January and then they added 15,000 jobs to that estimate.
So currently they are saying 150.117 million jobs for January and 150.997 million jobs for February
which is actually an increase of 895,000 jobs over what they originally reported last month and 880,000 more than current estimates for last month.Of course, the Corona Virus scare is affecting the Stock Market as the AP news was quick to point out. So March numbers may be affected by that.
For more info see our Current Unemployment Chart and Current U.S. Employment Chart commentary.
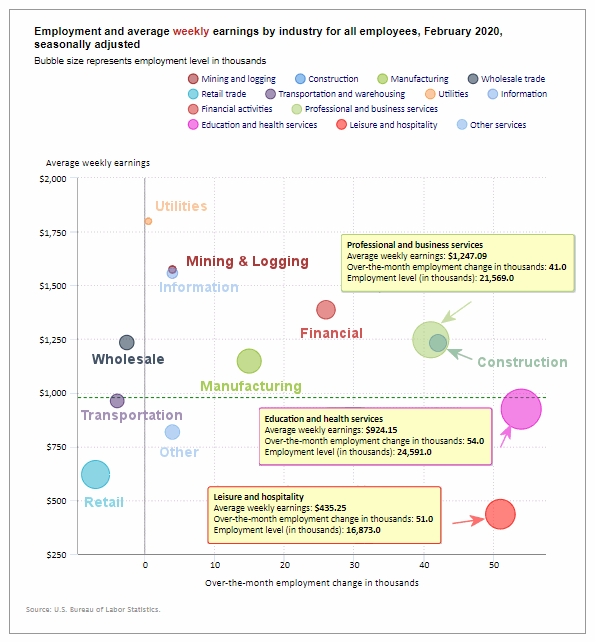
Employment by Sector
The employment “bubble chart” gives us a good representation of how each sector of the economy is doing (employment wise on a seasonally adjusted basis). In February, the biggest gainer (furthest to the right on the chart) was Education and Health Services which added 54,000 jobs. Second was Leisure and Hospitality which added 51,000 jobs. Professional and Business Services and Construction added 41,000 and 42,000 jobs respectively.
The three losers were Wholesale, Transportation and Retail losing 2,600, 4,000 and 7,200 respectively.
Average weekly wages rose sharply from January’s $975.49 to $$981.09 in February. This is up from $969.39 in October and $959.76 in June and $951.50 in February 2019.
(See the table below for details.)
How to read this chart:
Bubbles location on the chart tell us two things:
- Change in Employment Levels over the most recent month.
- Average Weekly earnings.
- The further to the right the bubble the larger the increase in the number of jobs.
- The higher up on the chart the larger the average salary.
Bubble Size tells us:
- Total Employment for the sector.
- Larger bubbles mean more people are employed in that sector.
Employment and Average Weekly Earnings by Industry
February 2020, Seasonally Adjusted
| Industry | Monthly Increase | Average Weekly Earnings | Employment Level |
| Total Private Employment | 228,000 | $981.09 | 129,769,000 |
| Mining and Logging | 4,000 | $1,574.11 | 717,000 |
| Construction | 42,000 | $1,232.06 | 7,646,000 |
| Manufacturing | 15,000 | $1,147.74 | 12,861,000 |
| Wholesale trade | -2,600 | $1,234.23 | 5,936,200 |
| Retail trade | -7,000 | $620.00 | 15,659,400 |
| Transportation and Warehousing | -4,000 | $962.48 | 5,681,400 |
| Utilities | 500 | $1,798.57 | 547,400 |
| Information | 4,000 | $1,557.32 | 2,898,000 |
| Financial Activities | 26,000 | $1,386.69 | 8,850,000 |
| Professional and Business Services | 41,000 | $1,247.09 | 21,569,000 |
| Education and Health Services | 54,000 | $924.15 | 24,591,000 |
| Leisure and Hospitality | 51,000 | $435.25 | 16,873,000 |
| Other Services | 4,000 | $817.60 | 5,939,000 |
U1 through U6 Unemployment Rates
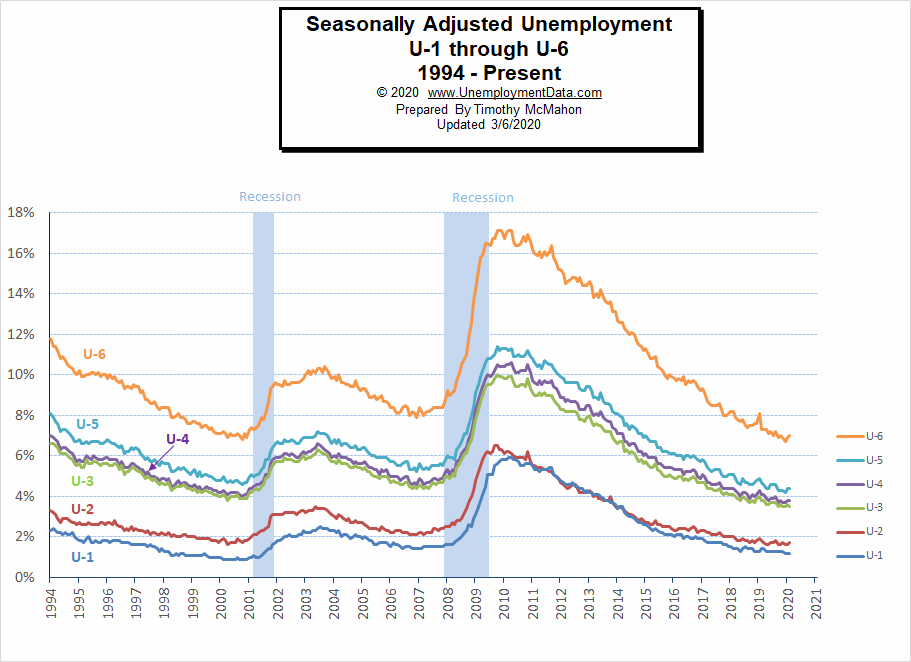
As we can see from the above chart all the various measurements of Seasonally Adjusted Unemployment from U-1 through U-6 are near or below record lows. Seasonally adjusted U-6 and U-2 ticked up for the month while U-3 fell and the others remained steady. For more information about the various measurements of unemployment see What Is U-6 Unemployment?
Unemployment by Education (for those 25 and over)
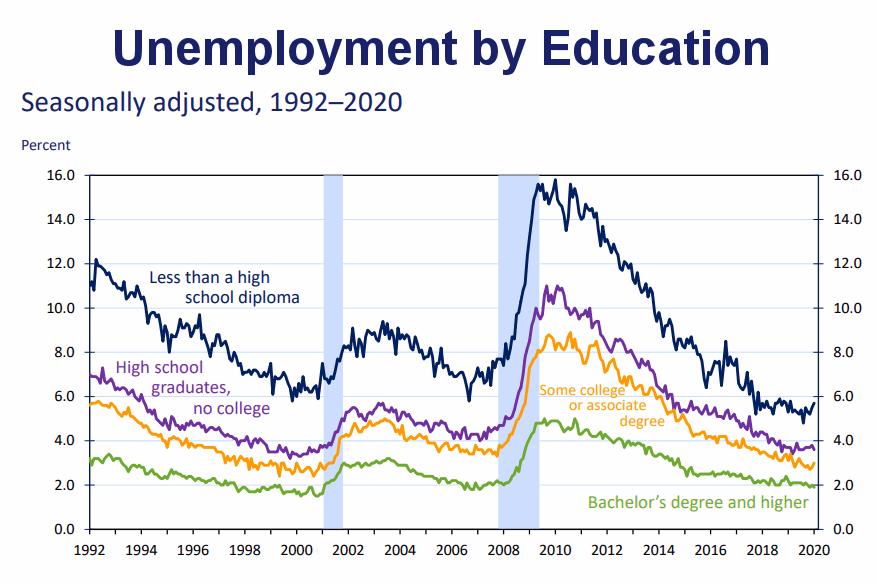
The unemployment rate for those who dropped out of High School is just under 6% while those who stuck it out have an unemployment rate of roughly 2% lower at just under 4%. An Associate’s degree dropped the unemployment rate by another 1% and a Bachelors’s degree brings the unemployment rate down to 2%. Even at the peak of the recession those with a Bachelor’s degree only had a 4% unemployment rate while those with only a High School degree had an 11% unemployment rate.
Source: Bureau of Labor Statistics
Reasons for Unemployment
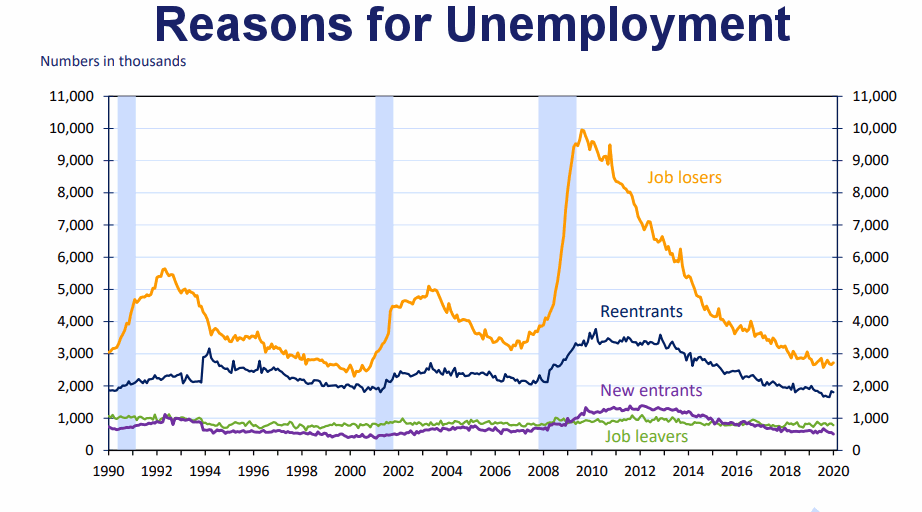
As we can see from the above chart “Job Leavers” i.e. those who voluntarily decided to change jobs holds pretty steady over the years. Obviously, “Job losers” spiked during the recession. What might be a bit more surprising was the increase in “Reentrants” trying to find a job during the recession. This could be due to financial hardships due to a fall in the value of assets like stocks which retirees were counting on for living expenses. Around 2018 the number “New entrants” fell below “Job leavers” meaning that College and High School grads were finding it easier to get a job upon graduation.
Labor Productivity
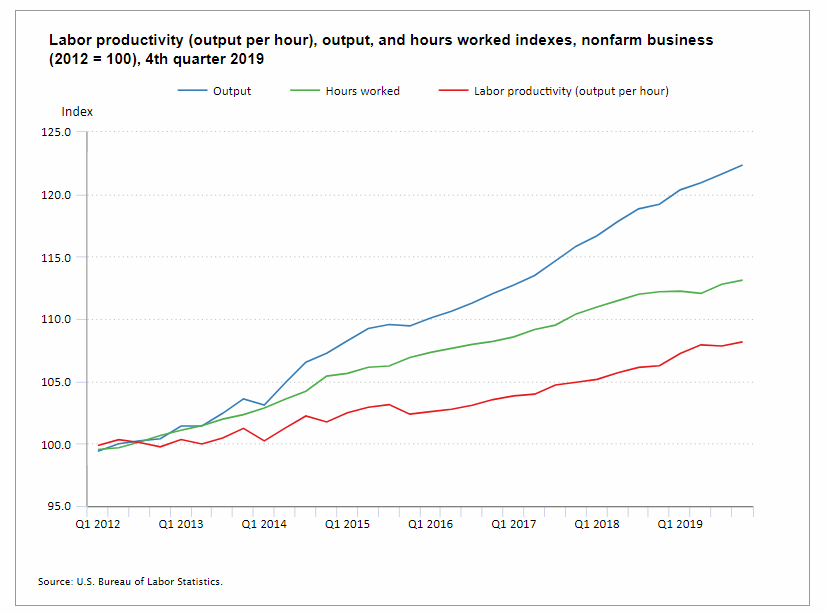 Output, Hours worked and Labor Productivity are all on healthy upward trends.
Data Source: BLS Labor Productivity
Previous Record Low Unemployment (Seasonally Adjusted U-3)
If we consider anything 4% or below as “low” we have had a few “low” stretches as we can see in the table below.
(4% or below in Green)
| Jan | Feb | Mar | Apr | May | Jun | Jul | Aug | Sep | Oct | Nov | Dec | |
| 1950 | 6.5% | 6.4% | 6.3% | 5.8% | 5.5% | 5.4% | 5.0% | 4.5% | 4.4% | 4.2% | 4.2% | 4.3% |
| 1951 | 3.7% | 3.4% | 3.4% | 3.1% | 3.0% | 3.2% | 3.1% | 3.1% | 3.3% | 3.5% | 3.5% | 3.1% |
| 1952 | 3.2% | 3.1% | 2.9% | 2.9% | 3.0% | 3.0% | 3.2% | 3.4% | 3.1% | 3.0% | 2.8% | 2.7% |
| 1953 | 2.9% | 2.6% | 2.6% | 2.7% | 2.5% | 2.5% | 2.6% | 2.7% | 2.9% | 3.1% | 3.5% | 4.5% |
| 1954 | 4.9% | 5.2% | 5.7% | 5.9% | 5.9% | 5.6% | 5.8% | 6.0% | 6.1% | 5.7% | 5.3% | 5.0% |
| 1955 | 4.9% | 4.7% | 4.6% | 4.7% | 4.3% | 4.2% | 4.0% | 4.2% | 4.1% | 4.3% | 4.2% | 4.2% |
| 1956 | 4.0% | 3.9% | 4.2% | 4.0% | 4.3% | 4.3% | 4.4% | 4.1% | 3.9% | 3.9% | 4.3% | 4.2% |
| 1957 | 4.2% | 3.9% | 3.7% | 3.9% | 4.1% | 4.3% | 4.2% | 4.1% | 4.4% | 4.5% | 5.1% | 5.2% |
| 1958 | 5.8% | 6.4% | 6.7% | 7.4% | 7.4% | 7.3% | 7.5% | 7.4% | 7.1% | 6.7% | 6.2% | 6.2% |
| … | … | … | … | … | … | … | … | … | … | … | … | … |
| 1965 | 4.9% | 5.1% | 4.7% | 4.8% | 4.6% | 4.6% | 4.4% | 4.4% | 4.3% | 4.2% | 4.1% | 4.0% |
| 1966 | 4.0% | 3.8% | 3.8% | 3.8% | 3.9% | 3.8% | 3.8% | 3.8% | 3.7% | 3.7% | 3.6% | 3.8% |
| 1967 | 3.9% | 3.8% | 3.8% | 3.8% | 3.8% | 3.9% | 3.8% | 3.8% | 3.8% | 4.0% | 3.9% | 3.8% |
| 1968 | 3.7% | 3.8% | 3.7% | 3.5% | 3.5% | 3.7% | 3.7% | 3.5% | 3.4% | 3.4% | 3.4% | 3.4% |
| 1969 | 3.4% | 3.4% | 3.4% | 3.4% | 3.4% | 3.5% | 3.5% | 3.5% | 3.7% | 3.7% | 3.5% | 3.5% |
| 1970 | 3.9% | 4.2% | 4.4% | 4.6% | 4.8% | 4.9% | 5.0% | 5.1% | 5.4% | 5.5% | 5.9% | 6.1% |
| … | … | … | … | … | … | … | … | … | … | … | … | … |
| 1999 | 4.3% | 4.4% | 4.2% | 4.3% | 4.2% | 4.3% | 4.3% | 4.2% | 4.2% | 4.1% | 4.1% | 4.0% |
| 2000 | 4.0% | 4.1% | 4.0% | 3.8% | 4.0% | 4.0% | 4.0% | 4.1% | 3.9% | 3.9% | 3.9% | 3.9% |
| 2001 | 4.2% | 4.2% | 4.3% | 4.4% | 4.3% | 4.5% | 4.6% | 4.9% | 5.0% | 5.3% | 5.5% | 5.7% |
| … | … | … | … | … | … | … | … | … | … | … | … | … |
| 2018 | 4.1% | 4.1% | 4.1% | 3.9% | 3.8% | 4.0% | 3.9% | 3.9% | 3.7% | 3.7% | 3.7% | 3.9% |
| 2019 | 4.0% | 3.8% | 3.8% | 3.6% | 3.6% | 3.7% | 3.7% | 3.7% | 3.5% | 3.6% | 3.5% | 3.5% |
| 2020 | 3.6% | 3.5% |
Employment
Historically employment is closely tied to recessions and that is no accident. One of the primary factors in calculating whether the economy is officially in a recession is an increase in the unemployment rate. The chart below provides the Historical Employment Data overlaid on blue bars showing periods of official recessions.
Originally the BLS reported 150.102 million jobs for January and then they added 15,000 jobs to that estimate. So currently they are saying 150.117 million jobs for January and 150.997 million jobs for February which is actually an increase of 895,000 jobs over what they originally reported last month and 880,000 more than current estimates.
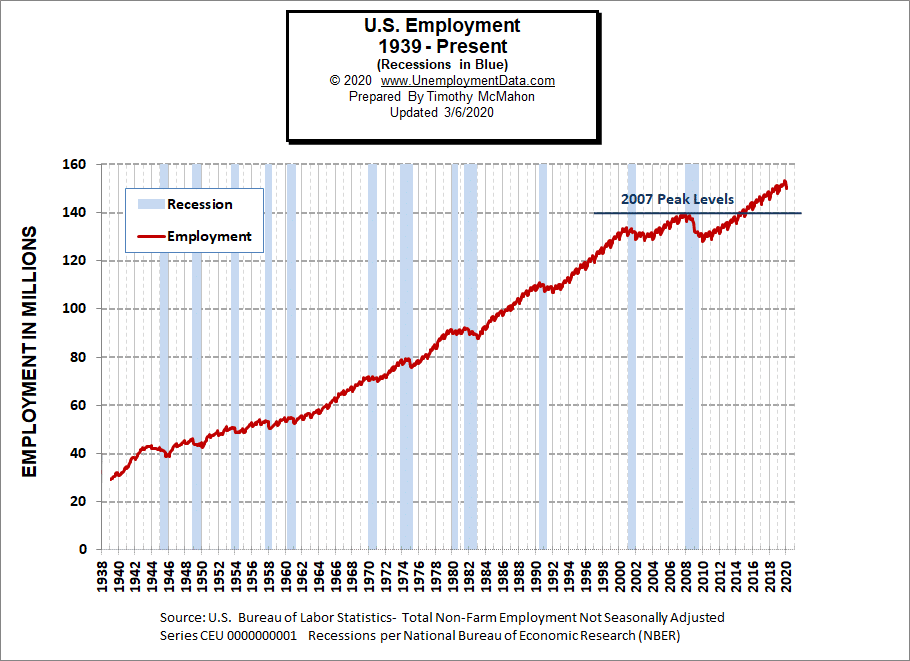
See Historical Employment Data for more info.
Current Employment
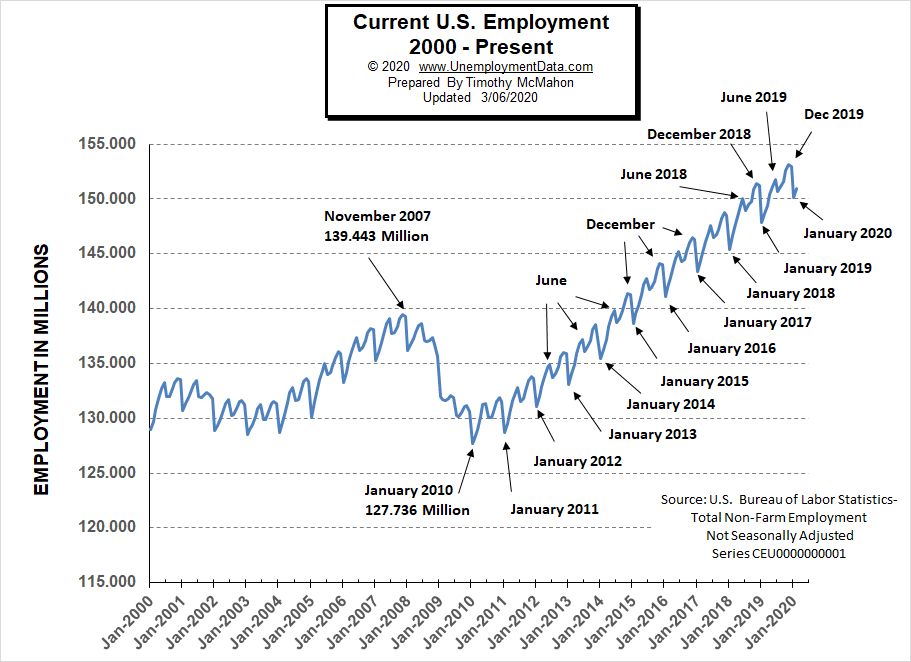
From the above current employment chart, we can see that the low point for each year occurs in January and then a small peak occurs around June with a slight drop around July and then the highest peak in employment happens in November/December. So the drop in January was expected.
See Current Employment for more info.
Labor Force Participation Rate
The Current Labor Force Participation Rate for February 2020 was unchanged from January at 63.4% up slightly from 63.3% in October.
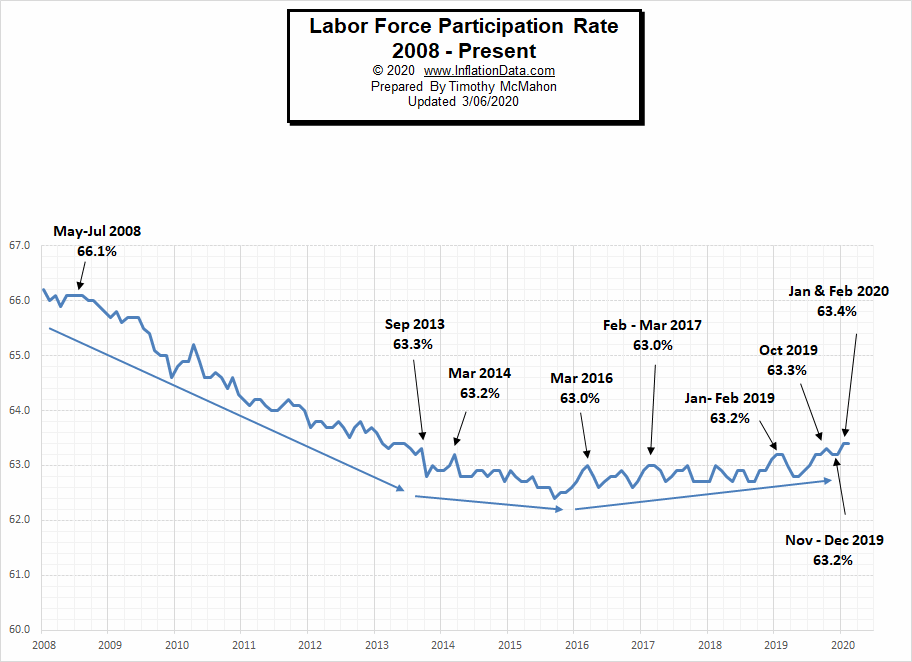
See Labor Force Participation Rate for more information.
If you would like to receive this monthly report and other article updates click here you can unsubscribe at any time.
Here are some articles you might enjoy in case you missed them:
Read more on UnemploymentData.com.
- Developing an Employee Reward Program
- What are the Top Paying Positions for MBA Graduates?
- How to Improve Morale in the Workplace
- Learn a Skill in 2 Years: The Top 3 Trade Careers
- Labor of Love: 5 Tips for Finding a Career You’re Passionate About
From InflationData.com
- Inflation: The Hidden Tax
- How the FED Controls the Money Supply
- January Inflation Spikes to 2.49%
- Modern Monetary Theory
- Investing to Fight Inflation
From Financial Trend Forecaster
- Oil Is Now More Volatile Than Bitcoin
- Financial Real Estate Trends Investors Should Understand for 2020
- Gold is Still King of the Investing Market
- The Markets in Perspective: What Goes up Must Come down?
- Repeating Patterns = Profit Potential
- The Beginning of a Long-Term “Secular” Bull Market?
- What Does this Rare & Rapid Drop in Manufacturing Mean?
- Bullish Signal Has Only Happened 10 Times in the Last 94 Years.
From OptioMoney.com
- Learning to Trade from Video Tutorials
- How Saxo Bank Democratizes Trading and Investment
- Five Business Tips to Help Your Company Thrive
- Have Minimal Car Insurance? What to Do in Case of an Accident
- How to Choose a Residential Roofing Contractor
From Your Family Finances