
February 2022 Unemployment report from the Bureau of Labor Statistics (BLS)
![]()
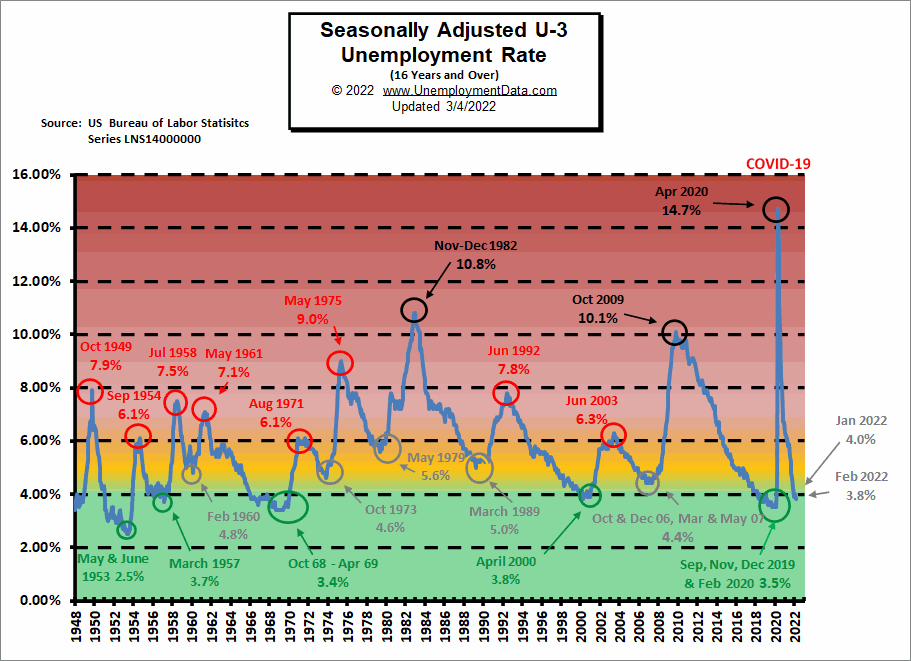
- Adjusted U-3 was Down from 4.0% to 3.8%
- Unadjusted U-3 was Down from 4.4% to 4.1%
- Unadjusted U-6 was Down from 7.9% to 7.6%
- Labor Force Participation Up from 62.2% 62.3%
- Unadjusted Employment rose from 147. 510 million to 148. 964 million
February 2022 Unemployment report:
AP says: Strong Job Growth Points to COVID’s Fading Grip on Economy “Employers added a robust 678,000 jobs in February, the largest monthly total since July, the Labor Department reported Friday.”
CNBC says: U.S. unemployment rate falls in February, but ticks up for Black women “The unemployment rate for Black women ticked up to 6.1% in February from 5.8% in the previous month.”
According to the Commissioner of the U.S. Bureau of Labor Statistics:
“Nonfarm payroll employment rose by 678,000 in February, and the unemployment rate edged down to 3.8 percent. Employment growth was widespread, led by gains in leisure and hospitality, professional and business services, health care, and construction. Employment is down by 2.1 million, or 1.4 percent, from its level before the onset of the coronavirus (COVID-19) pandemic in February 2020.
In February, employment growth continued in leisure and hospitality (+179,000) with job gains in food services and drinking places (+124,000) and accommodation (+28,000). “
As usual, they are talking about “Seasonally Adjusted Jobs” from the “Current Population Survey (CPS)” rather than looking at the results reported by actual companies in their “Current Employment Statistics survey (CES)”
But looking at the CES report we see…
Originally the BLS reported employment of 147.525 million for January which they adjusted to 147.510 million. So 15,000 jobs disappeared for January. But they are reporting 148.964 million jobs for February which is actually an increase of 1,439,000 jobs based on their original estimates or an increase of 1,454,000 based on their updated numbers.
ADP National Employment Report
In addition to the BLS, we can look at the Jobs Report generated by private companies like ADP Research Institute.
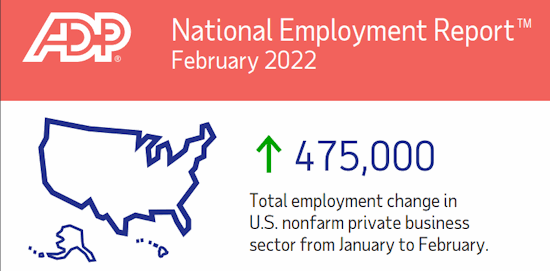
The interesting thing about ADP data is that they also provide breakdowns based on company size. Small businesses with 1-49 employees lost -96,000 jobs, midsized businesses with 50-499 Employees gained 18,000 jobs and large companies with 500 or more employees gained 552,000 jobs. So the big winners were large companies.
Unemployment Historically Low
In signs of an overheated economy, companies are finding it increasingly difficult to find qualified workers and unemployment is nearing historical lows.
 Click for larger Image
February 2022 Labor Force Participation Rate
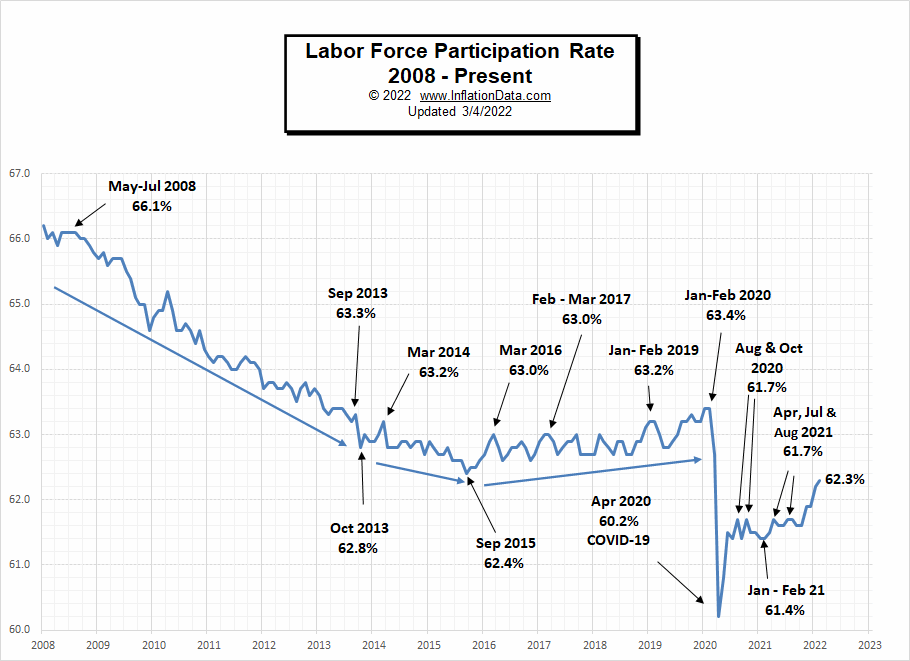 LFPR breaks out of its recent channel but is still well below Jan-Feb 2020 levels.
As we explain in the page on the Labor Force Participation Rate, the BLS has a strange definition of Labor Force Participation, and so if you “want a job” but don’t look, you aren’t in the Labor Force.
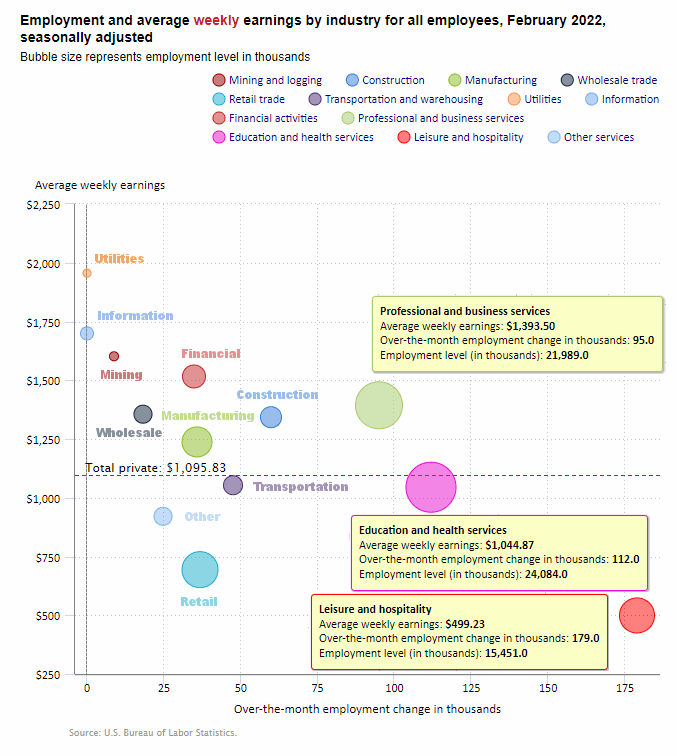
February 2022 Employment by Sector
The employment “bubble chart” is a quick and easy way to see how each sector performs on a seasonally adjusted basis. The Bubble’s Size tells us total Employment for that industry (i.e., larger bubbles mean more people are employed in that sector).
The bubble’s location on the chart tells us that there is a change in Employment Levels over the most recent month… The further to the right the bubble, the larger the number of jobs, and the higher up on the chart, the larger the average salary.
Average weekly wages up from $1,086.46 in December to $1,095.83 in February.
 Click for larger Image
Remember these are Seasonally Adjusted Numbers! Once again, Leisure and Hospitality was the largest gainer with 179,000 new jobs. Education and Health gained 112,000 jobs and Professional and Business Services gained 95,000 jobs.
Employment and Average Weekly Earnings by Industry
February 2022, Seasonally Adjusted Employment
Average Weekly Earnings up from $1,091.24 in January.
| Industry | Monthly Increase | Average Weekly Earnings | Employment Level |
| Total Private Employment | 654,000 | $1,095.83 | 128,201,000 |
| Mining and Logging | 9,000 | $1,602.00 | 600,000 |
| Construction | 60,000 | $1,342.84 | 7,613,000 |
| Manufacturing | 36,000 | $1,237.69 | 12,607,000 |
| Wholesale trade | 18,300 | $1,355.54 | 5,780,300 |
| Retail trade | 36,900 | $694.03 | 15,701,200 |
| Transportation and Warehousing | 47,600 | $1,053.36 | 6,378,400 |
| Utilities | 0 | $1,955.91 | 539,100 |
| Information | 0 | $1,699.41 | 2,923,000 |
| Financial Activities | 35,000 | $1,516.03 | 8,901,000 |
| Professional and Business Services | 65,000 | $1,393.50 | 21,989,000 |
| Education and Health Services | 112,000 | $1,044.87 | 24,084,000 |
| Leisure and Hospitality | 179,000 | $499.23 | 15,451,000 |
| Other Services | 25,000 | $921.13 | 5,634,000 |
But looking at Employment Change by Industry over the last 12 months, we can see that Government gained 356,000 jobs over the year.
Source: BLS
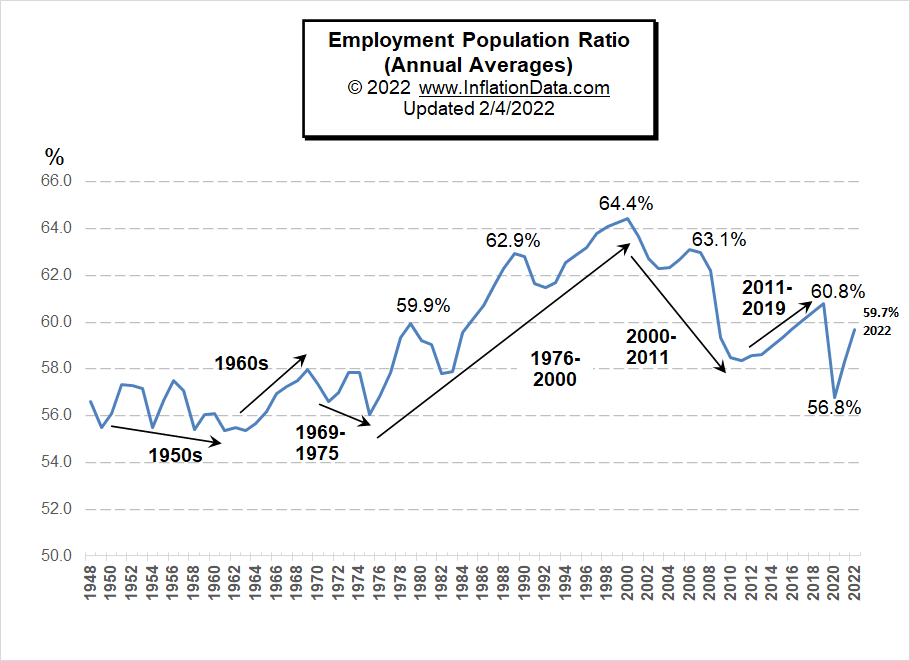
Employment-Population Ratio
This chart shows the actual percentage of the population that’s working, unlike the Labor Force Participation Rate, which shows the portion of the population working or looking for work. The Annual Average Employment-Population Ratio for 2021 was 58.3%.
By looking at annual averages rather than monthly numbers, we can see the long-term trends in the percentage of the population that is working. For more information and the full commentary on these trends, see Employment-Population Ratio.
Seasonally Adjusted U1 through U6 Unemployment Rates
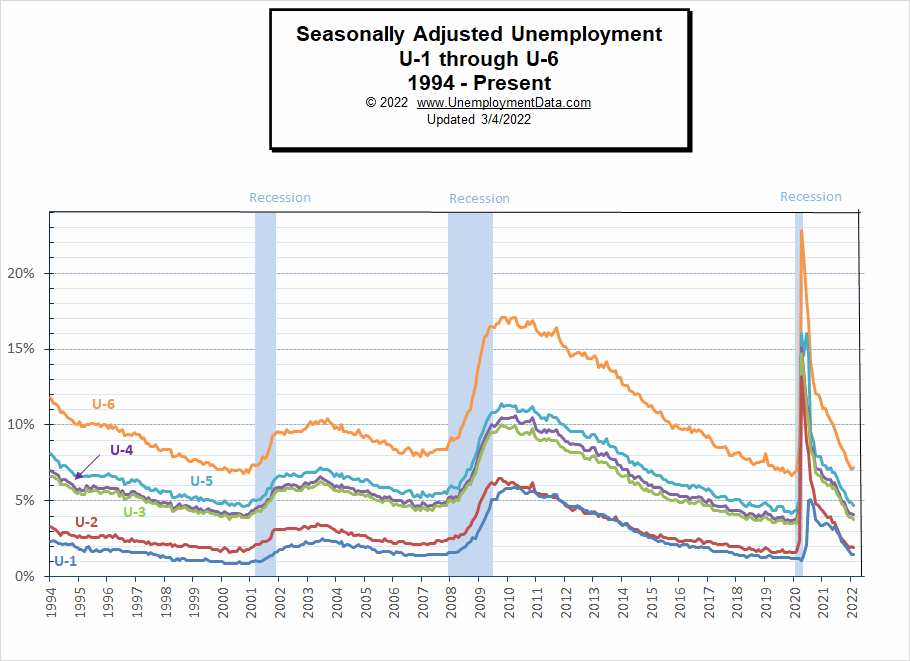
For more information about the various measurements of unemployment, see What Is U-6 Unemployment?
Current February 2022 Employment
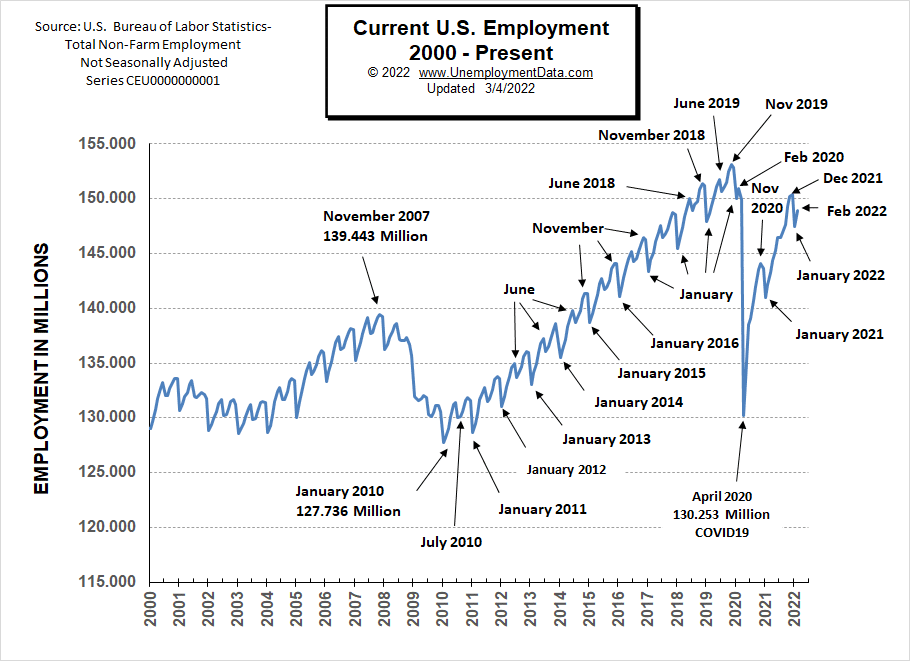
February employment increased but is still well below February 2020 and November 2019 levels, plus the Civilian Non-Institutional Population (not the total Census Bureau Population) has increased since then.
See Current Employment for more info.
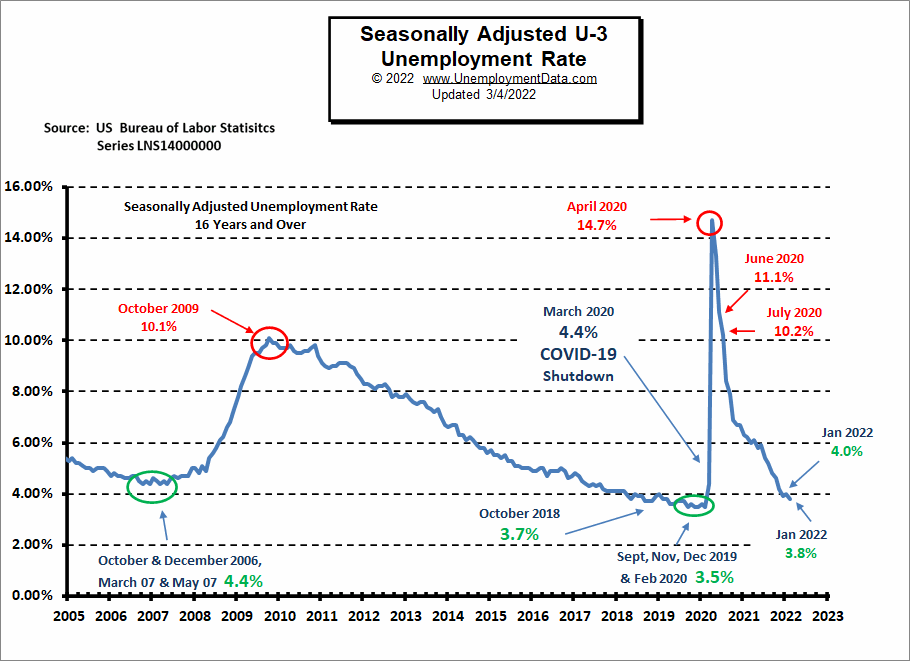
February 2022 Unemployment Report (Seasonally Adjusted)
 Click for larger Image
Click here if you would like to receive this monthly report and other article updates. You can unsubscribe at any time.
Here are some articles you might enjoy if you missed them:
Read more on UnemploymentData.com.
- Make Your Future With A Medical Assistant Career
- Excellent Six-Figure Careers To Consider
- Create A Great Construction Job Resume For Better Responses
- January 2022 Unemployment Up not DOWN as Reported
- December Unemployment Rates by State
From InflationData.com
- How Should You Invest to Benefit From Inflation?
- Hyperinflation in Turkey and Argentina Today?
- January Inflation Nears 40 Year High
- Former Treasury Secretary Larry Summers on the Current Inflation Situation
- How Quickly Can The FED Get Inflation Under Control?
From Financial Trend Forecaster
- Moore Inflation Predictor
- NYSE ROC
- NASDAQ ROC
- Economic Warfare Deployed Against Russia
- The Surprising Implications Of Declining Global Birth Rates
- What is Entity Extraction and Why Should You Care?
- Technology And The Semiconductor Chip Shortage
- Remarkably Quick And Easy Alternative House Building Methods
- How Blockchain’s Unique Innovations Can Prevent Money Remittance Scams
- Are 3D Printed Houses the Trend of the Future?
- Historically Investors Become “Long-term Buyers” at Precisely the Wrong Time
- Why the “60 / 40 Balance” May Be Hazardous to Your Portfolio
- Warning: Mergers And Acquisitions Can Vaporize The Stock Market
- Is the Correction Over?
- Euro: Look at This Head & Shoulders Chart Formation
From OptioMoney.com
- Unlock The Benefits Of A Good Credit Score
- Buying A Home When You Are Already In Debt
- Top 10 Tasks Businesses Should Outsource in 2022
- 7 Unexpected Costs Of Moving To A New Home
From Your Family Finances