
![]() On Friday January 5th the U.S. Bureau of Labor Statistics (BLS) released their monthly employment survey results for the month of December. Many of the numbers remained unchanged from November which was also unchanged from October.
On Friday January 5th the U.S. Bureau of Labor Statistics (BLS) released their monthly employment survey results for the month of December. Many of the numbers remained unchanged from November which was also unchanged from October.
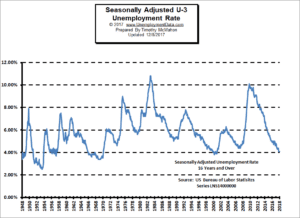
Unemployment
According to the BLS Seasonally Adjusted U-3 was 4.1% since October while Unadjusted U-3 was 3.9% for three months. Unadjusted U-6 unemployment which is a broader measure of Unemployment rose from 7.6% in October to 7.7% in November to 8.0% in December. This is still significantly better than a year ago when in November 2016 Unadjusted U-6 was 9% and December was 9.1%.
 Typically January sees an uptick in unemployment as all the seasonal employees get laid-off. So we would expect some sort of uptick next month.
According to the BLS Commissioner’s report for this month:
“Among the major worker groups, the unemployment rate for teenagers declined to 13.6 percent in December, offsetting an increase in November. In December, the unemployment rates for adult men (3.8 percent), adult women (3.7 percent), Whites (3.7 percent), Blacks (6.8 percent), Asians (2.5 percent), and Hispanics (4.9 percent) showed little or no change.”
See: Current Unemployment Rate Chart for more info.
Employment
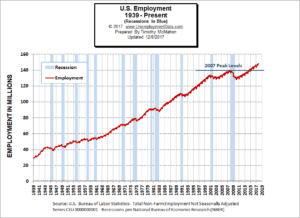 Back in October, employment was 147,952,000 in November it rose to 148,526,000 but then it fell slightly in December to 148,346,000 for a net loss from November to December of 180,000 jobs. The BLS Commissioner’s report however said, “Total nonfarm payroll employment rose by 148,000 in December…” That is because he is talking about “Seasonally Adjusted” jobs. Meaning that although actual jobs are down, they are down by 148,000 less than average for this time of year.
See Current Employment Commentary and Historical Employment Commentary
Labor Force Participation Rate
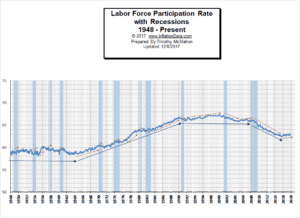 You might be wondering if recessions have any effect on the LFPR. It might make sense that the LFPR would fall during a recession. In the chart to the left we can see both LFPR vs. Recessions. And the results were a bit surprising. The red arrows indicate short term trends and the blue arrows indicate longer term trends.
See Labor Force Participation Rate for more information.
Employment by Sector
When looking at this chart we have to remember that the numbers are “Seasonally Adjusted” so we see that Construction had +30,000 more jobs created that usual at an average salary of $1,149.13 per week. Manufacturing had an increase of 25,000 jobs at $1,090.99, Professional and Business Services saw 19,000 more jobs than usual, Education and Health got 28,000 more jobs than usual, and Leisure and Health increased by 16,050 more jobs than usual. Total average weekly wages (called “private” on the chart) were $915.98 in November and have increased to $918.74 in December.
The only major loser was Retail which usually increased dramatically during the November-December time-frame but increased by -20,300 less than usual. At first glance it might appear that this is the result of more people purchasing gifts online rather than in retail stores resulting in less need for retail employees in local stores during the Holidays. But retail employment increased 18,700 more than average in November so perhaps stores simply hired earlier than usual this year. But by looking at last month’s (November’s) Bubble Chart here- Manufacturing Jobs Soar Under Trump we see that Retail Trade supplied 15,845,000 jobs in November and in December there were 15,814,500 so in real non-seasonally adjusted numbers we can see that employment did actually decrease in December by 30,500 jobs which could indicate that the increase online purchasing is a factor.
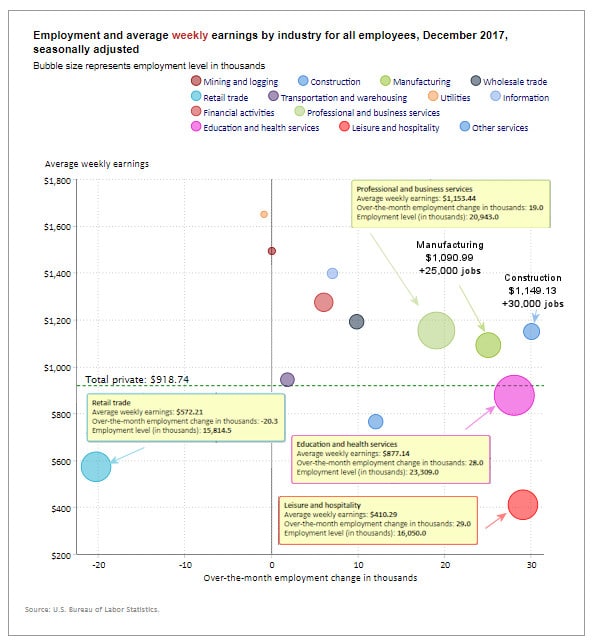
How to read this chart:
Bubble vertical location on the chart tell us:
- The higher the bubble the greater the average weekly earnings.
Bubble Horizontal Location tells us:
- The further to the right the bubble the larger the increase in the number of jobs.
Bubble Size tells us:
- Total number of U.S. Jobs in that industry
The same information is available in table form below.
Employment and Average Weekly Earnings by Industry for All Employees
December 2017, Seasonally Adjusted
| Industry | Monthly Increase | Average Weekly Earnings | Employment Level |
| Total Private Employment | 146,000 | $918.74 | 125,039,000 |
| Mining and Logging | 0 | $1,492.62 | 727,000 |
| Construction | 30,000 | $1,149.13 | 6,993,000 |
| Manufacturing | 25,000 | $1,090.99 | 12,539,000 |
| Wholesale trade | 9,800 | $1,190.79 | 5,959,100 |
| Retail trade | -20,300 | $572.21 | 15,814,500 |
| Transportation and Warehousing | 1,800 | $943.71 | 5,122,300 |
| Utilities | -900 | $1,649.18 | 552,300 |
| Information | 7000 | $1,396.96 | 2,722,000 |
| Financial Activities | 6000 | $1,273.89 | 8,498,000 |
| Professional and Business Services | 19,000 | $1,153.44 | 20,943,000 |
| Education and Health Services | 28,000 | $877.14 | 23,309,000 |
| Leisure and Hospitality | 29,000 | $410.29 | 16,050,000 |
| Other Services | 12,000 | $764.47 | 5,810,000 |
For more information See:
- Article: Employment vs. Unemployment how do they compare?
- Historical Employment Data Chart
- Current Unemployment Rate Chart
- Current Employment vs Unemployment Chart Are they really “two sides of the same coin”?
- What is U-6 Unemployment?
- The Misery index measures inflation plus unemployment and is a good measure of the discomfort of the country’s population.
- More Unemployment and Employment Charts