
The U.S. Bureau of Labor Statistics (BLS) released its employment / unemployment report for December on January 10th, 2025.
Employment / Unemployment
![]()
- Seasonally Adjusted U3- 4.1% Down from November
- Unadjusted U3- 3.8% Down from November
- Unadjusted U6- 7.4% Unchanged
- Labor Force Participation Rate 62.5% Unchanged
- Employment 160.458 million Down from 160.539 million
- Next data release February 7th, 2025
Summary:
Total Employed Decreased in December, Unadjusted Unemployment was unchanged, but Seasonally adjusted Unemployment decreased.
According to the Commissioner of the U.S. Bureau of Labor Statistics:
“Total nonfarm payroll employment increased by 256,000 in December, and the unemployment rate changed little at 4.1 percent, the U.S. Bureau of Labor Statistics reported today. Employment trended up in health care, government, and social assistance. Retail trade added jobs in December, following a job loss in November.
The unemployment rate changed little at 4.1 percent in December. After increasing earlier in the year, the unemployment rate has been either 4.1 percent or 4.2 percent for the past 7 months. The number of unemployed people, at 6.9 million, also changed little in December.”
You can read the full BLS report here.
As usual, they are talking about “Seasonally Adjusted Jobs”.
Looking at the Unadjusted Establishment Survey report we see…
Originally the BLS reported employment of 160.560 million for November
which they adjusted to 160.539 million this month.
They are currently reporting 160.458 million jobs for December which is actually a decrease of -102,000 jobs based on their original numbers. Or -81,000 jobs based on their revised numbers.
The LFPR was unchanged at 62.5%.
Bad News or Good News?
Once again, the perverse nature of the stock market showed its ugly head. The market took the BLS report as good enough to generate fear that the FED won’t cut rates again soon. So, the NYSE lost 547.73 points or 2.8%. This brought the market back down to the lows of December 19, 2024.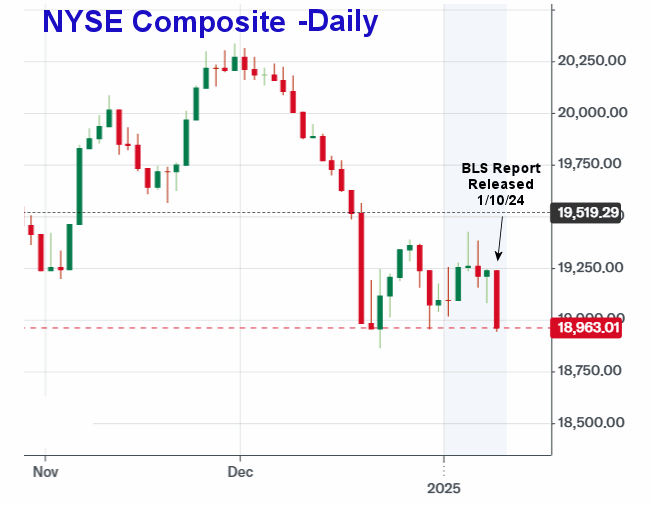
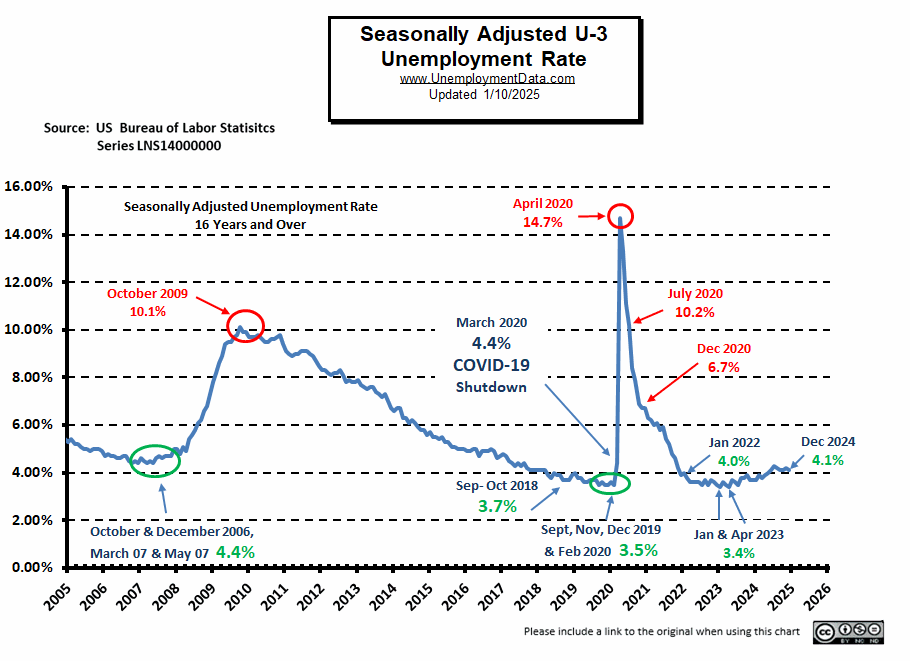
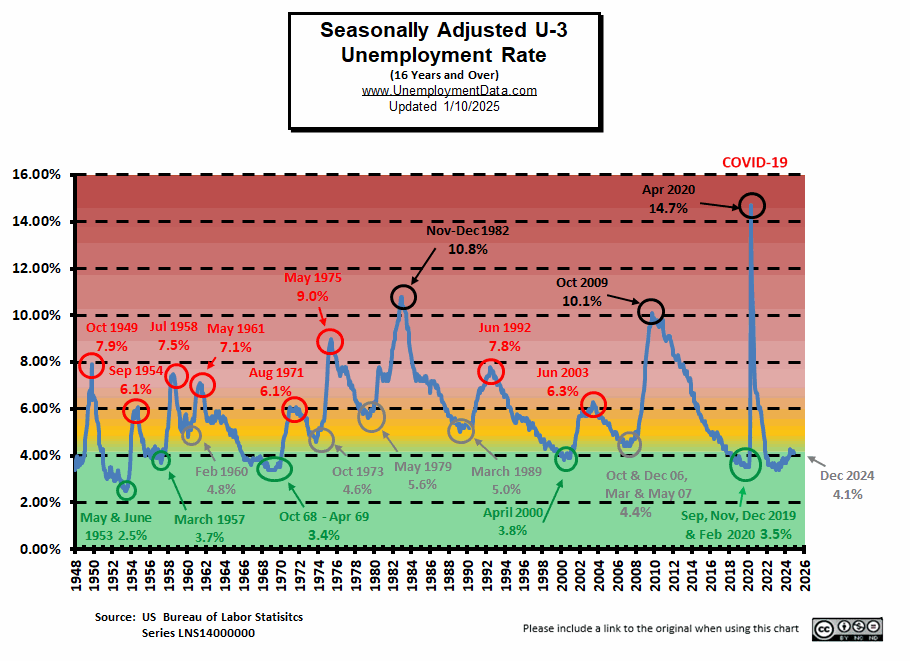
Current Unemployment Rate Chart
As we can see from the chart below, although still low, unemployment has risen 0.7 percentage points since the lows of 2023. At 4.1%, unemployment is no longer in the “Excellent” range but still in the “Very Good” range.
Current Employment Rate
At 160.458 million in December, employment is down slightly from the originally reported 160.560 million in November.
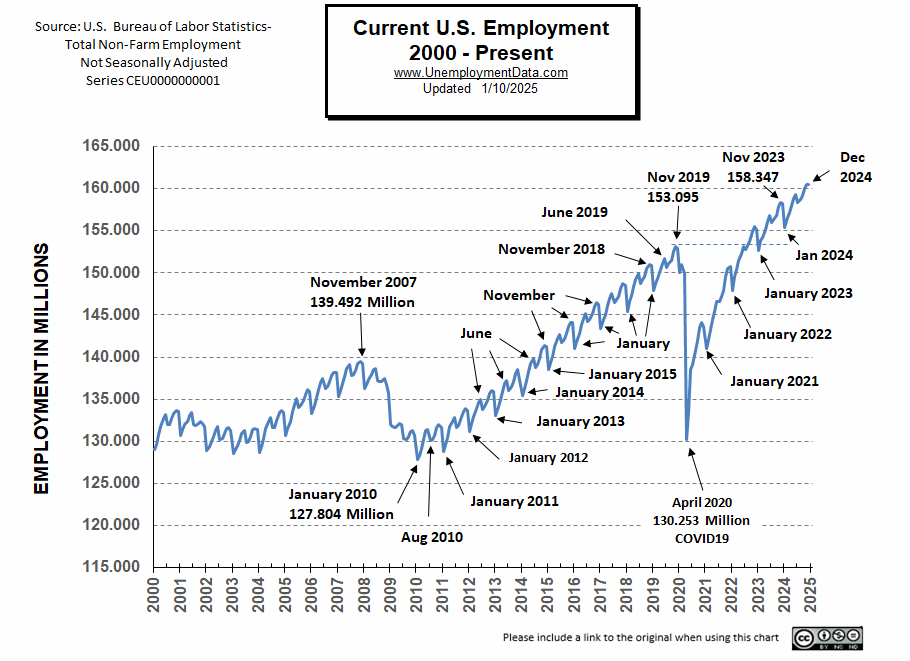
See Current Employment for more information.
BLS: December 2024 Employment by Sector
The BLS employment “bubble chart” based on the Establishment Survey Data gives us a good picture of the Seasonally adjusted employment numbers.
The Bubble’s Size tells us the total Employment for that industry (i.e., larger bubbles mean more people are employed in that sector).
The bubble’s location on the chart tells us that there has been a change in Employment Levels over the most recent month… A bubble further to the right indicates larger job growth. A bubble’s vertical location on the chart shows the average industry salary.
Remember, these are Seasonally Adjusted Numbers, so they aren’t cumulative!
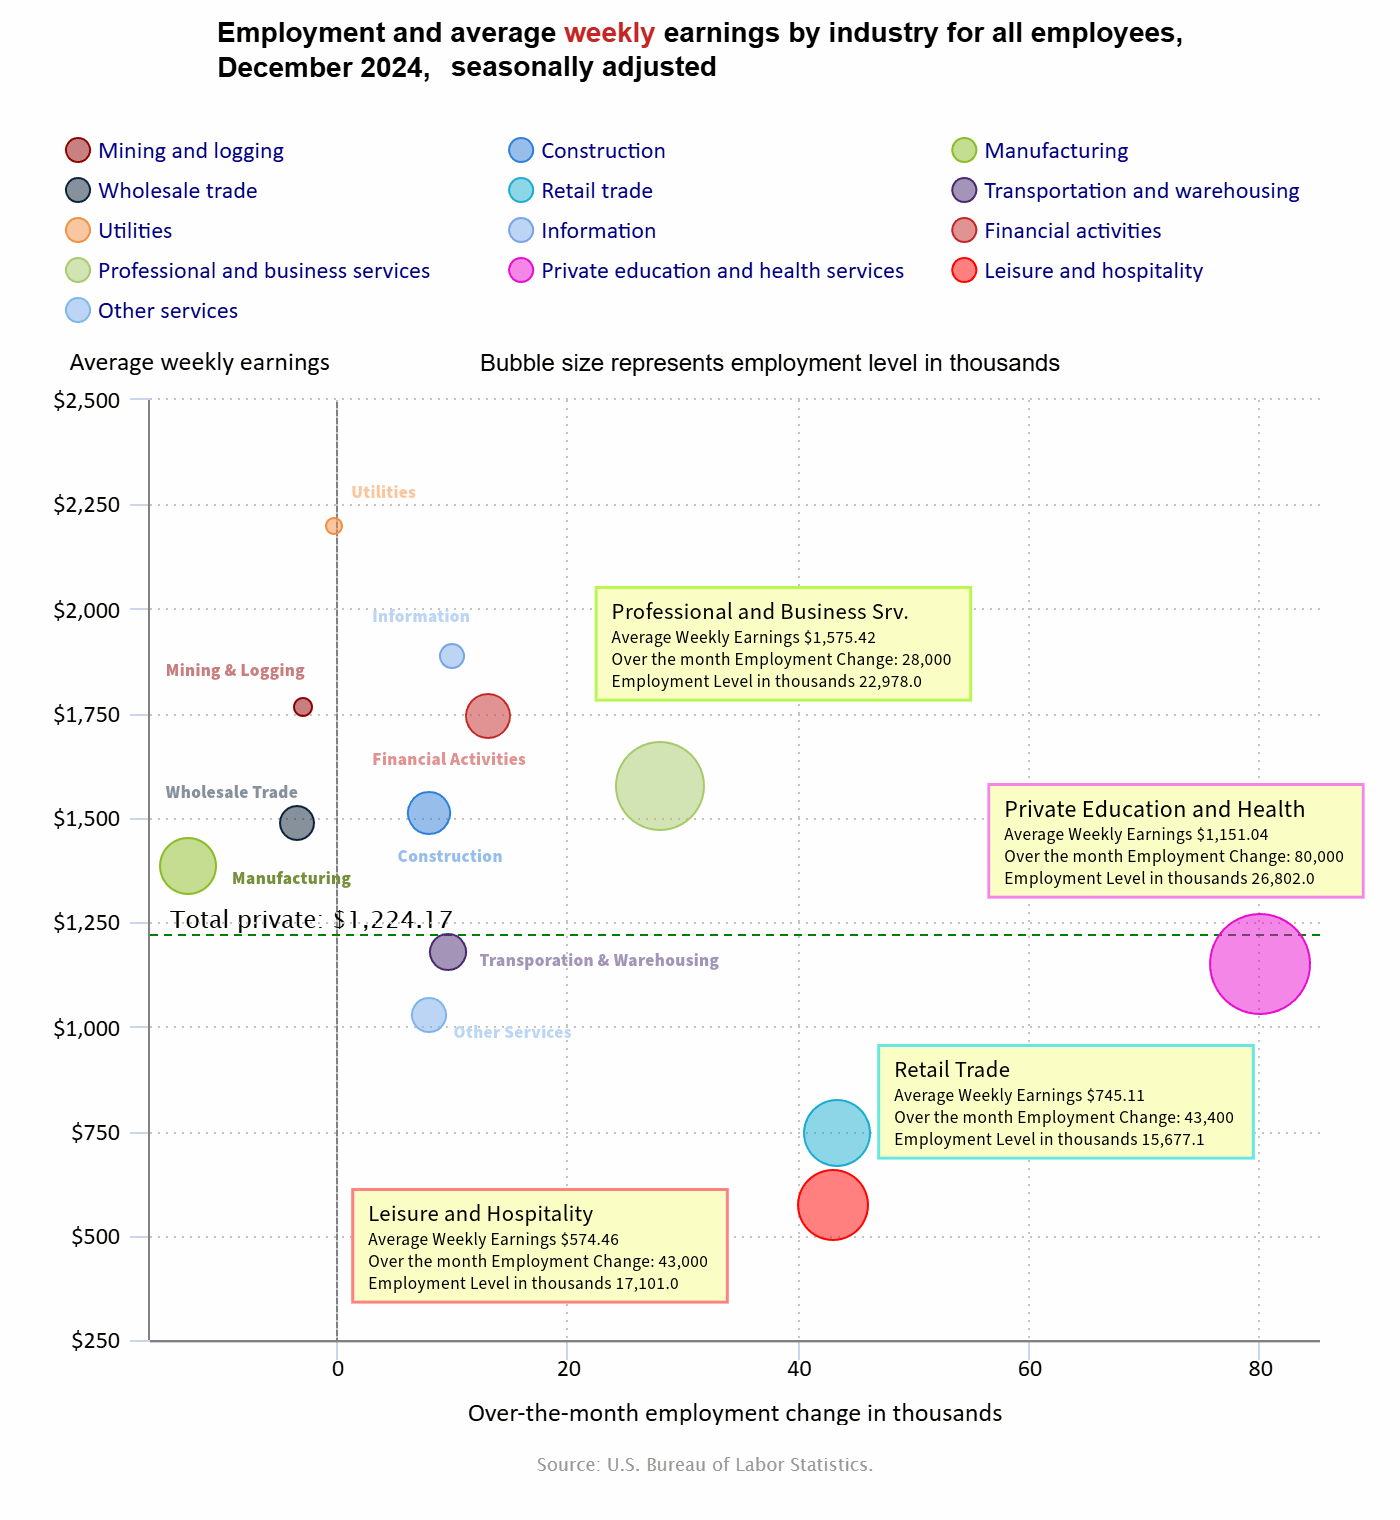 Looking at the above chart we can see that three sectors were below zero (i.e., left of the zero line -lost workers). Several others were very close to zero.
BLS Average Weekly Wages
| Date | Average Weekly Wage |
| December 2024 | $1,224.17 |
| November 2024 | $1,221.42 |
| October 2024 | $1,216.28 |
| September 2024 | $1,209.31 |
| August 2024 | $1,207.70 |
| July 2024 | $1,199.39 |
| June 2024 | $1,200.50 |
| May 2024 | $1,197.41 |
| April 2024 | $1,191.93 |
| March 2024 | $1,193.34 |
| February 2024 | $1,185.75 |
| January 2024 | $1,178.16 |
| December 2023 | $1,175.46 |
| November 2023 | $1,173.04 |
| October 2023 | $1,166.20 |
| September 2023 | $1,165.47 |
| August 2023 | $1,163.41 |
| July 2023 | $1,157.28 |
| June 2023 | $1,155.15 |
| May 2023 | $1,146.99 |
| April 2023 | $1,147.58 |
| March 2023 | $1,141.34 |
| February 2023 | $1,141.61 |
| January 2023 | $1,146.14 |
| December 2022 | $1,125.73 |
| November 2022 | $1,129.01 |
| October 2022 | $1,124.01 |
| September 2022 | $1,119.87 |
| August 2022 | $1,116.42 |
| July 2022 | $1,116.54 |
| June 2022 | $1,106.76 |
| May 2022 | $1,105.47 |
| April 2022 | $1,102.01 |
| December 2021 | $1,086.46 |
Have Wages Kept Up With Inflation?
As you can see from the table above average weekly wages are trending up but are they up enough to keep up with inflation?
BLS Employment and Average Weekly Earnings by Industry
December 2024, Seasonally Adjusted Employment
Note that due to “seasonal adjusting,” although they may claim that there was a “monthly increase” (or decrease), there isn’t always an actual increase; you can’t just subtract last month’s “employment level” from this month’s level. For instance, Construction was supposed to be up by 8,000 in December. But November was 8,313,000 and November was 8,316,000 which looks like a 3,000 job increase not 8,000. And Financial Activities looks more like a 6,000 increase than the reported 13,000 increase.
| Industry | Monthly Increase | December Ave. Weekly Earnings | December Employment Level | November Employment Level |
| Total Private Employment | 223,000 | $1,224.17 | 136,020,000 | 135,798,000 |
| Mining and Logging | -3,000 | $1,767.10 | 634,000 | 640,000 |
| Construction | 8,000 | $1,511.26 | 8,316,000 | 8,313,000 |
| Manufacturing | -13,000 | $1,384.00 | 12,873,000 | 12,887,000 |
| Wholesale trade | -3,500 | $1,488.93 | 6,191,800 | 6,190,200 |
| Retail trade | 43,400 | $745.11 | 15,677,100 | 15,622,400 |
| Transportation and Warehousing | 9,600 | $1,180.38 | 6,630,200 | 6,627,200 |
| Utilities | -300 | $2,198.46 | 591,600 | 591,900 |
| Information | 10,000 | $1,888.21 | 3,004,000 | 2,986,000 |
| Financial Activities | 13,000 | $1,742.76 | 9,286,000 | 9,280,000 |
| Professional and Business Services | 28,000 | $1,575.42 | 22,978,000 | 22,954,000 |
| Private Education and Health Services | 80,000 | $1,151.04 | 26,802,000 | 26,707,000 |
| Leisure and Hospitality | 43,000 | $574.46 | 17,101,000 | 17,069,000 |
| Other Services | 8,000 | $1,029.43 | 5,935,000 | 5,930,000 |
Source: BLS
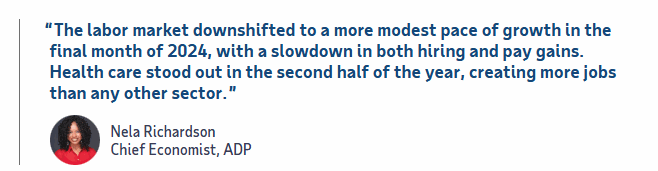
ADP’s increase was lower than the BLS but they tried to put a positive spin on it by saying “Strong hiring at large employers led this month’s growth.”
ADP® National Employment Report
ADP provides an independent (non-government) estimate of private-sector employment and pay, based on data derived from ADP client payrolls. According to ADP®, In collaboration with Stanford Digital Economy Lab.
Compared to the Seasonally adjusted 223,000 reported by the Bubble Chart or our calculated decrease of -102,000 jobs, ADP says there were 122,000 new jobs. Of course, this could be because people were taking on an additional part-time job.
ADP: Private employers added 122,000 jobs in December
Source: ADP®
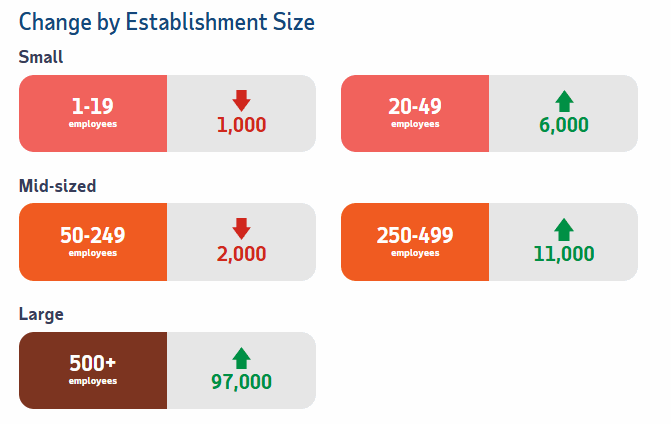
ADP Private Employment by Establishment Size
December ADP Changes:
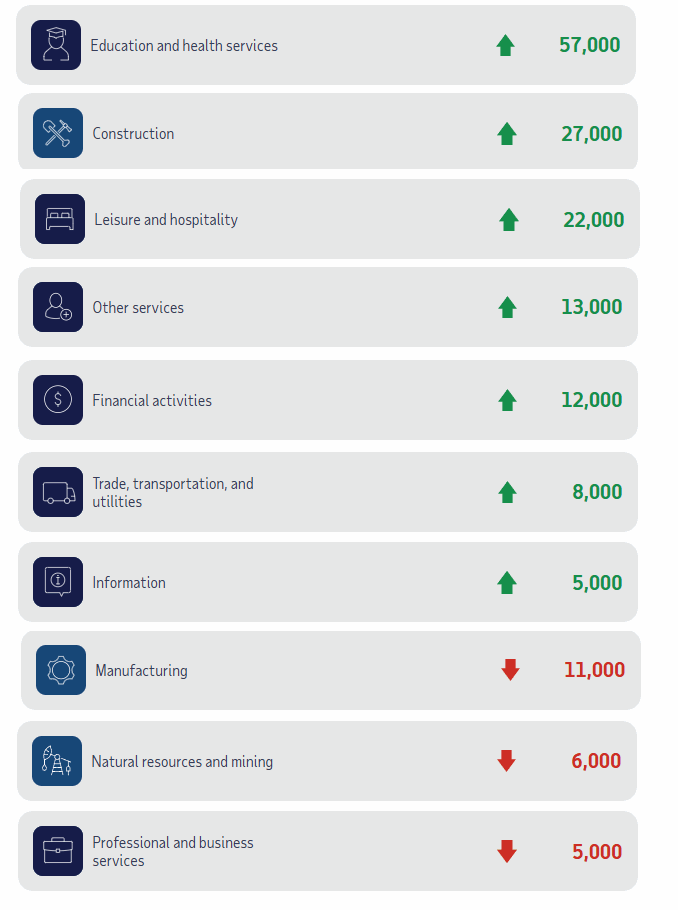
ADP Job Gainers / Losers
ADP provides an different picture of the job situation compared to the BLS perspective.
Unemployment
Seasonally Adjusted Unemployment is down 0.1% at 4.1% which is typical for December.
Labor Force Participation Rate
The LFPR is unchanged at 62.5%.
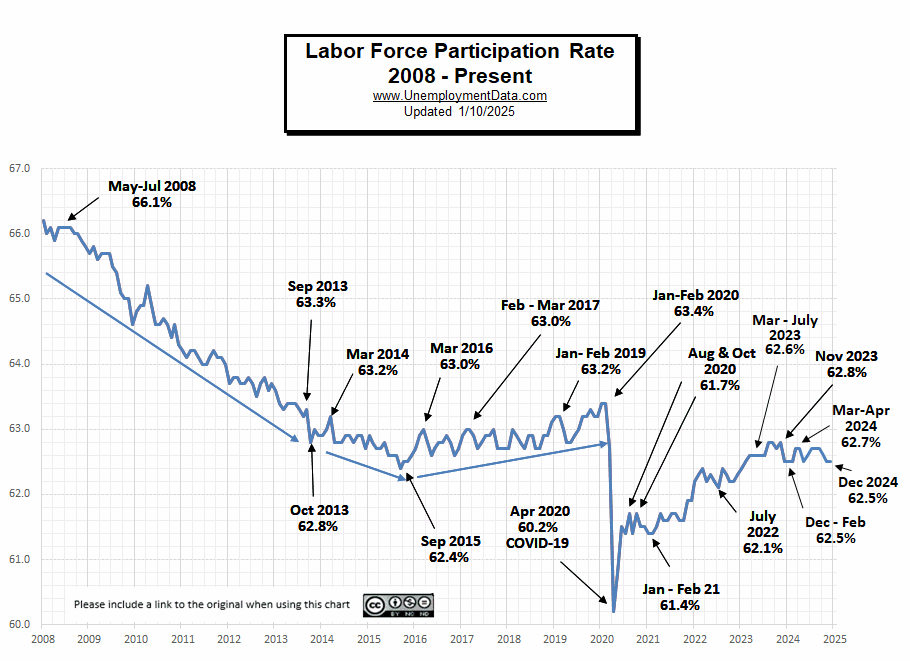 See Labor Force Participation Rate for more information.
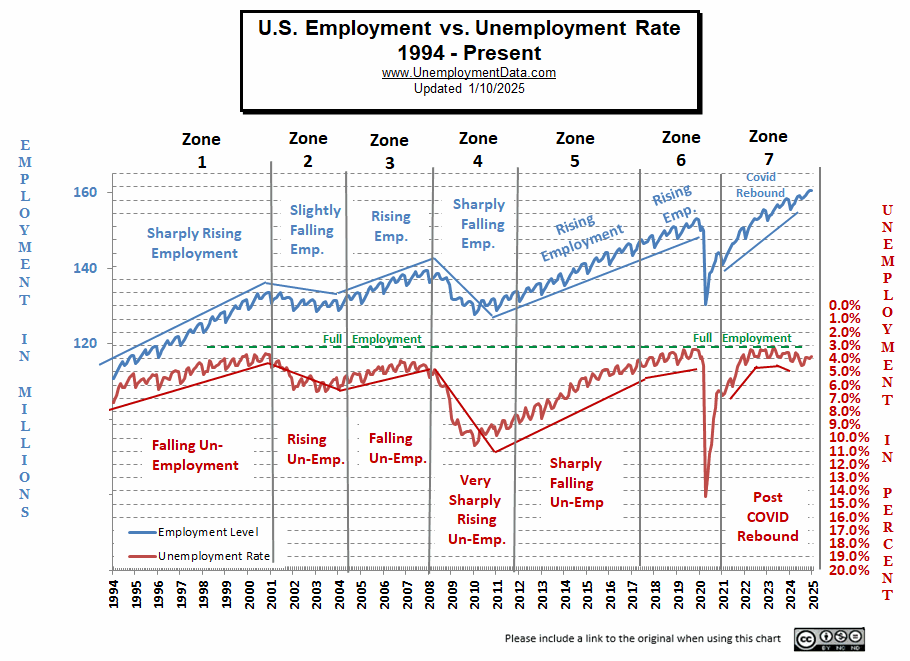
Less Than Full Employment
This chart compares employment levels with the (inverted) unemployment rate.
Full Employment is when everyone who wants a job has one. It is generally considered to be around 3%. After the unemployment rate almost touched the magic full employment line in April 2023, it began moving away (i.e., higher unemployment).
Note: The Unemployment rate is inverted to track the employment rate. Neither is Seasonally Adjusted. For more information see Employment vs. Unemployment.
Note: Full employment is not considered to be at zero percent because even when employers are having difficulty finding employees, some people are still unemployed due to either:
- structural unemployment (mismatch between worker skills and job requirements, i.e., not enough training) or
- frictional unemployment There will always be people who have quit or have lost a seasonal job and are in the process of getting a new job. Or
- Simply because they quit their job knowing it would be easy to find another (hopefully better) job.
Seasonally Adjusted U1 through U6 Unemployment Rates
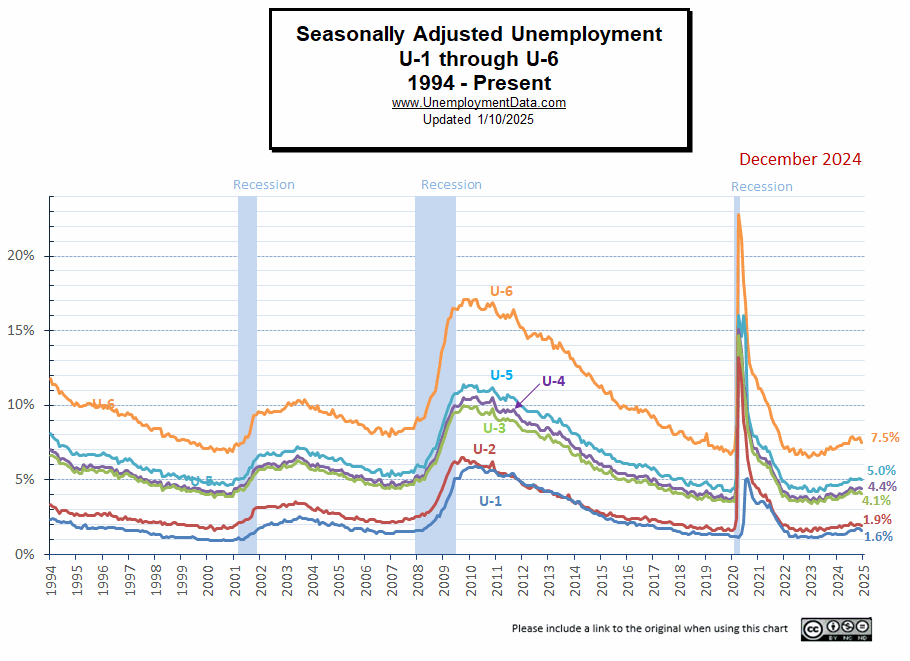 For more information about the various measurements of unemployment, see What Is U-6 Unemployment?
Seasonally Adjusted Unemployment by Education
This chart refutes the idea that getting a college education doesn’t help you find a job. Those with some college have half the unemployment level than someone without a High School diploma. But it doesn’t show whether they are “underemployed” i.e. working as a Barista at Starbucks or flipping burgers at McDonalds. And these numbers only apply to people over the age of 25 (so they have had some time to settle in).
One interesting note this month is the consistent decline in the unemployment rate for those with less than a high school diploma. In November the unemployment level for the less educated was 6.0% and in December it fell to 5.6%, down from 7% in August. All sectors were down for the month. 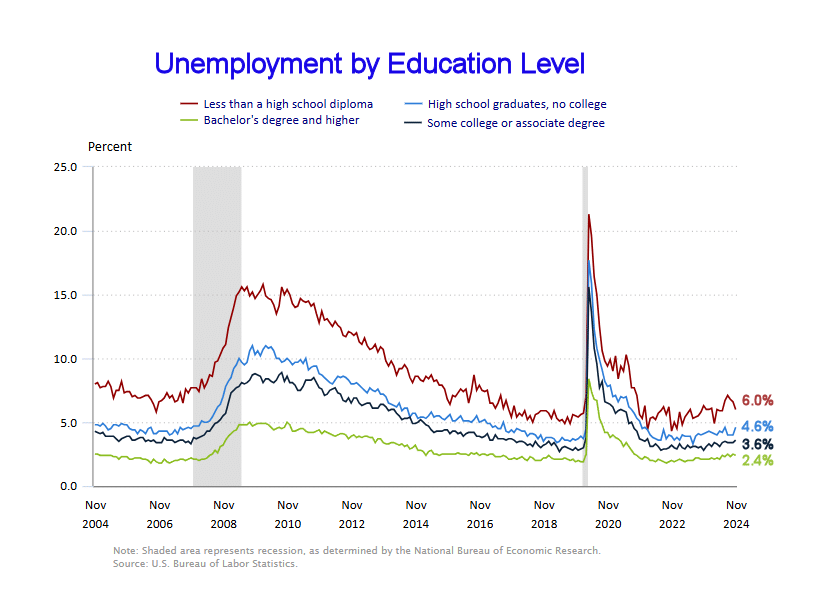 Source: BLS
Employment-Population Ratio
This chart shows the Employment-Population Ratio by Gender with a total of 60.0% of the population working. It also shows the breakdown by gender. Men make up a much larger portion of the workforce, i.e., 67.6% of men are employed and only 56.5% of women are employed. But…
As you can see 20 years ago, back in 2004, almost 72% of men were working and 56.6% of women were working. In 2008 the Great Recession caused a massive decline in employment for both men and women. By December of 2009, only 66.4% of men were working and 55.4% of women. Over the next decade, women workers rebounded to 57.5% but men only rebounded to 69.3%.
Now less than 68% of men are working and 56.5% of women are working, so it isn’t women who have left the workforce but men. Perhaps there are more stay-at-home Dads because their wives could earn more? Or more men decided to retire in 2009 and 2020, rather than returning to the workforce.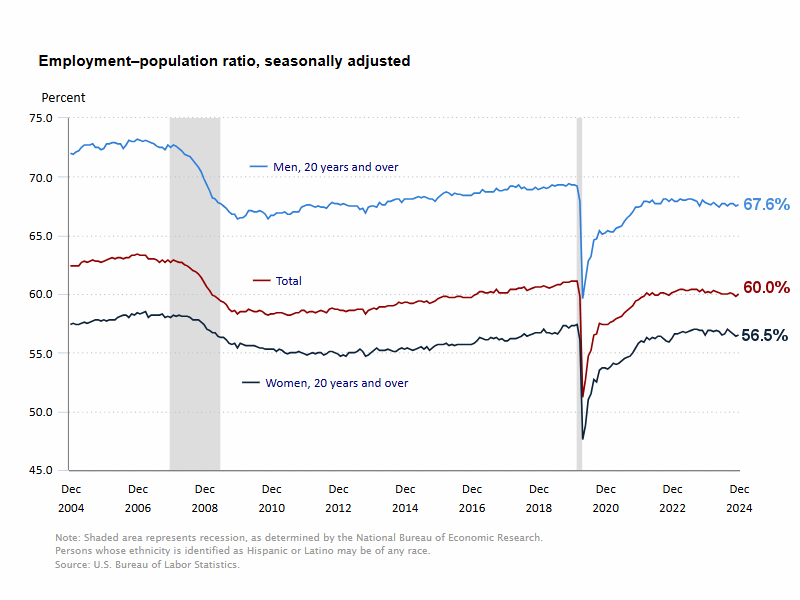
Read more on UnemploymentData.com.
- November Unemployment Report
- October 2024 Employment / Unemployment Report
- Can We Trust the September Unemployment Numbers?
- September Jobs Report
- Have Wages Kept Up With Inflation?
- BLS Erases 800,000 Jobs
From InflationData.com
- How Inflation Destroys Civilization
- November 2024 Inflation Up Slightly
- Inflation and Retirees
- 2025 Social Security COLA
- Inflation-Proofing Your Family Budget
From Financial Trend Forecaster
- NYSE ROC
- NASDAQ ROC
- Crypto ROC – BTC and ETH
- Ethereum Buy Signal
- Bitcoin ROC Buy Signal
- One American’s Experience with Socialized Medicine
- Bitcoin Breaks Out
- Is Trump Right About Tariffs?
- What Makes MicroStrategy Special
- China’s Monetary Bazooka
- How Much is the Money Supply Growing?
- Is Gold Overpriced?
- Are Some Forms of Taxation Worse Than Others for the Economy?
- Five Benefits of Using the Elliott Wave Principle to Make Decisions
- Invest Like Warren Buffet
- Gold Prices: The calm before a record run
- This Trend Will Likely Soon Rock the U.S. Financial System
- Elliott Wave Analysis of Bitcoin
From OptioMoney
- Tips for Mastering the Art of Bargaining and Negotiation After Moving to a New Country
- Consumer Culture Contrasting Spending Habits in the US and Europe
- Financial Considerations When Moving to Florida
- Splitting Your Golden Years:
- Home-Buying Guide for Newlyweds
From Your Family Finances