
Is Employment Up or Down?
![]()
- Unadjusted Employment fell from 155.015 million to 154.771
- Labor Force Participation rose from 62.2% to 62.3%
- Adjusted U-3 fell from 3.6% to 3.5%
- Unadjusted U-3 fell from 3.4% to 3.3%
- Unadjusted U-6 was unchanged at 6.4%
The U.S. Bureau of Labor Statistics (BLS) released its employment / unemployment report for December on January 6th2023.
According to the Commissioner of the U.S. Bureau of Labor Statistics:
“Total nonfarm payroll employment increased by 223,000 in December, and the unemployment rate edged down to 3.5 percent, the U.S. Bureau of Labor Statistics reported today. Notable job gains occurred in leisure and hospitality, health care, construction, and social assistance… The unemployment rate edged down to 3.5 percent in December and has remained in a narrow range of 3.5 percent to 3.7 percent since March.”
In addition, the BLS posted the following note:
“Seasonally adjusted household survey data have been revised using updated seasonal adjustment factors…”
They will also be making further annual adjustments next month.
You can read the full BLS report here.
As usual, they are talking about “Seasonally Adjusted Jobs” rather than looking at the unadjusted results.
Looking at the unadjusted Current Employment Statistics program (formerly called the Establishment Survey report), we see…
Originally, the BLS reported employment of 154.990 million for November, which they adjusted up to 155.015 million. So, 25,000 additional jobs appeared for November.
The current estimate for December is 154.771 million, which is down 219,000 from the original November number and down 244,000 from the revised numbers.
According to the BLS’ unadjusted Current Population Survey (CPS), the labor force was 164.224 million in December. Of those, 158.872 million were employed, and 5.352 million were unemployed. November CPS employment was 158.749 million, so according to the Current Population Survey, employment increased.
So one set of numbers shows an increase in employment while the other shows a decrease. ADP says mostly up.
ADP® National Employment Report
According to ADP, In collaboration with Stanford Digital Economy Lab, employment was up from November to December.
Private employers added 235,000 jobs in December
- Job resurgence was seen in the last two months of 2022, led by consumer-facing service industries. Hiring was strong across small and medium establishments, while large establishments saw a drop in employment of 151,000 jobs.
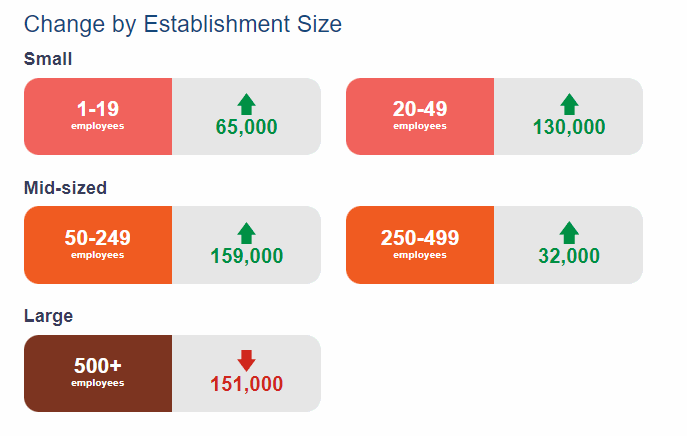
 ADP also lists increases by “firm size”.
As we can see, small and medium-sized companies are still hiring, while large corporations are downsizing.
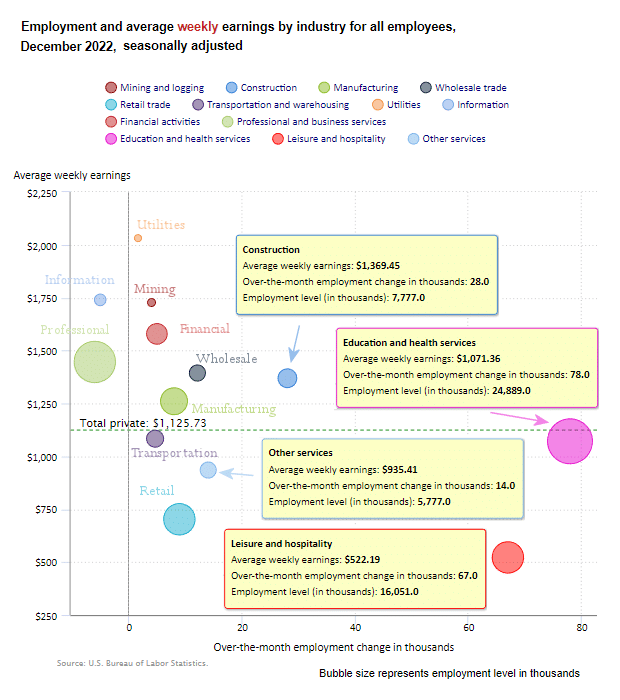
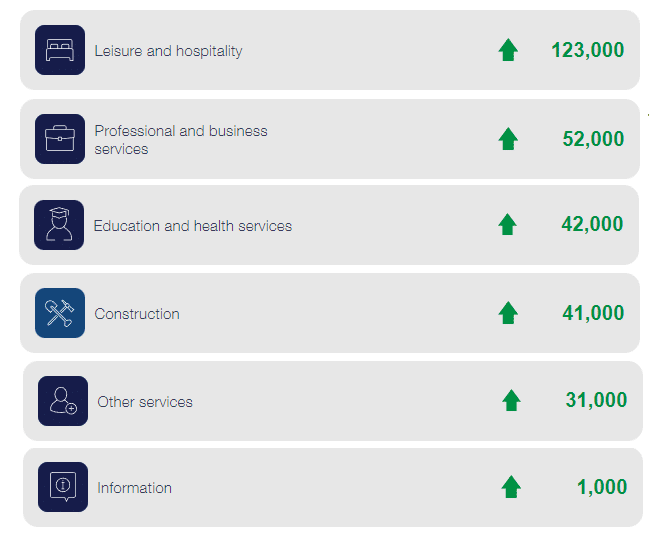
December 2022 Employment by Sector
The employment “bubble chart” is a quick and easy way to see how each sector performs on a seasonally adjusted basis. The Bubble’s Size tells us the total Employment for that industry (i.e., larger bubbles mean more people are employed in that sector).
The bubble’s location on the chart tells us that there has been a change in Employment Levels over the most recent month… A bubble further to the right indicates larger job growth. A bubble’s vertical location on the chart shows the average industry salary.
In November, Leisure and Hospitality, Education, Construction, Manufacturing, and “Other” were the big gainers, while Retail was the big loser.
Average Weekly Wages Fell in December
$1,125.73 in December, $1,129.01 in November, $1,124.01 in October , $1,119.87 in September, $1116.42 in August, $1,116.54 in July, $1,106.76, in June, $1,105.47 in May and $1,102.01 in April, and $1,086.46 in December 2021.
 Click for a larger image.
Remember, these are Seasonally Adjusted Numbers, so they aren’t cumulative!
BLS Employment and Average Weekly Earnings by Industry
December 2022, Seasonally Adjusted Employment
We’ve added another column to the table below that shows the employment levels that the BLS reported the previous month. Note that due to “seasonal adjusting” although they may claim that there was a “monthly increase” (or decrease), there isn’t always a real increase; you can’t just subtract last month’s “employment level” from this month’s level.
| Industry | December Monthly Increase | Dec. Ave. Weekly Earnings | Employment Level November | Employment Level December |
| Total Private Employment | 220,000 | $1,125.73 | 131,130,000 | 131,302,000 |
| Mining and Logging | 4,000 | $1,727.45 | 639,000 | 644,000 |
| Construction | 28,000 | $1,369.45 | 7,750,000 | 7,777,000 |
| Manufacturing | 8,000 | $1,260.74 | 12,934,000 | 12,934,000 |
| Wholesale trade | 12,100 | $1,394.08 | 5,909,300 | 5,925,400 |
| Retail trade | 9,000 | $702.60 | 15,767,100 | 15,789,500 |
| Transportation and Warehousing | 4,700 | $1,083.73 | 6,492,900 | 6,486,900 |
| Utilities | 1,600 | $2,031.67 | 543,100 | 544,400 |
| Information | -5,000 | $1,739.92 | 3,065,000 | 3,061,000 |
| Financial Activities | 5,000 | $1,579.14 | 8,997,000 | 8,997,000 |
| Professional and Business Services | -6,000 | $1,446.43 | 22,459,000 | 22,426,000 |
| Education and Health Services | 78,000 | $1,071.36 | 24,806,000 | 24,889,000 |
| Leisure and Hospitality | 67,000 | $522.19 | 16,003,000 | 16,051,000 |
| Other Services | 14,000 | $935.41 | 5,765,000 | 5,777,000 |
Source: BLS
Note: As usual, ADP has an entirely different picture with manufacturing, Financial, Mining, and Transportation losing jobs instead of gaining them
ADP Job Losers
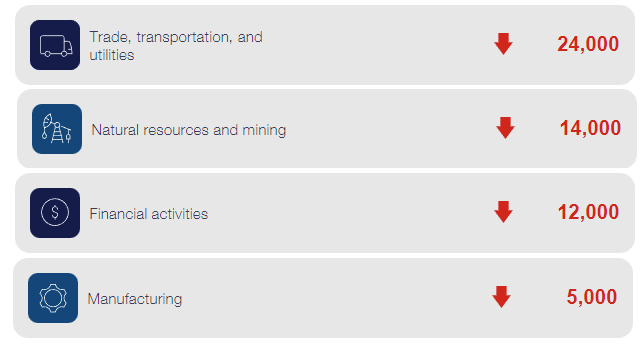
ADP does break up the categories slightly differently regarding their category Trade, Transportation, and Utilities.
ADP Job Gainers
Unemployment
December’s Seasonally Adjusted Unemployment is 3.5%, down from November.
Originally, the BLS reported November’s adjusted U-3 unemployment rate as 3.7%, but they have since revised it to 3.6%, and December’s rate is lower than either of those.
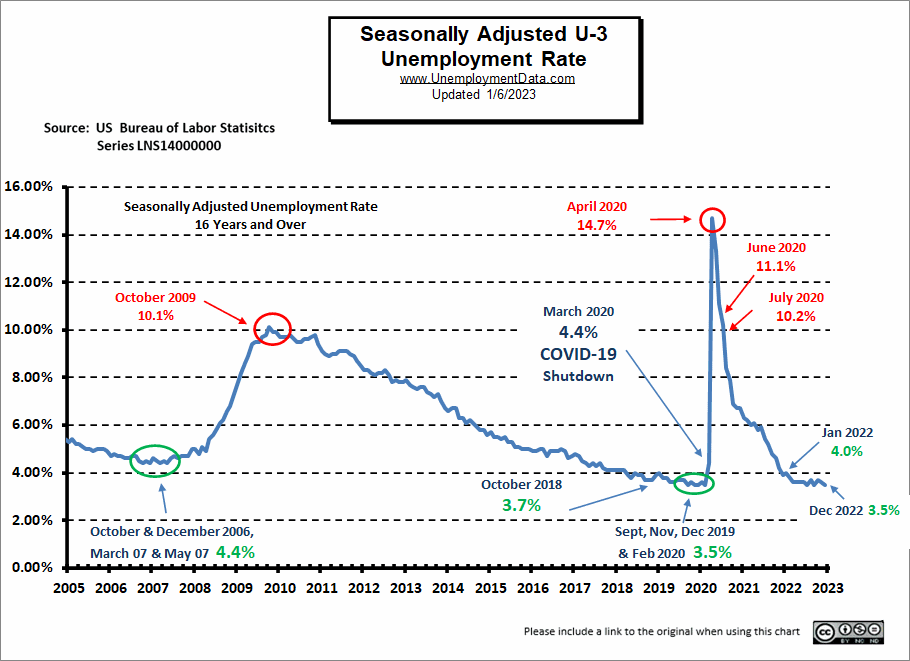 See Unemployment Rate Chart for more information.
Current Employment Rate Chart
Typically the low point for each year occurs in January. Then employment moves almost straight up to a small peak around June with a slight drop around July, and then the highest peak in employment happens in November with a slight decline in December. In 2021, rather than a decline in December, we saw a slight increase, followed by the typical January decline and a rebound in February through June. Employment peaked at 155.015 million in December, beating the November 2019 peak by roughly 2 million (although the U.S. population has increased by over 4.8 million since then as well).
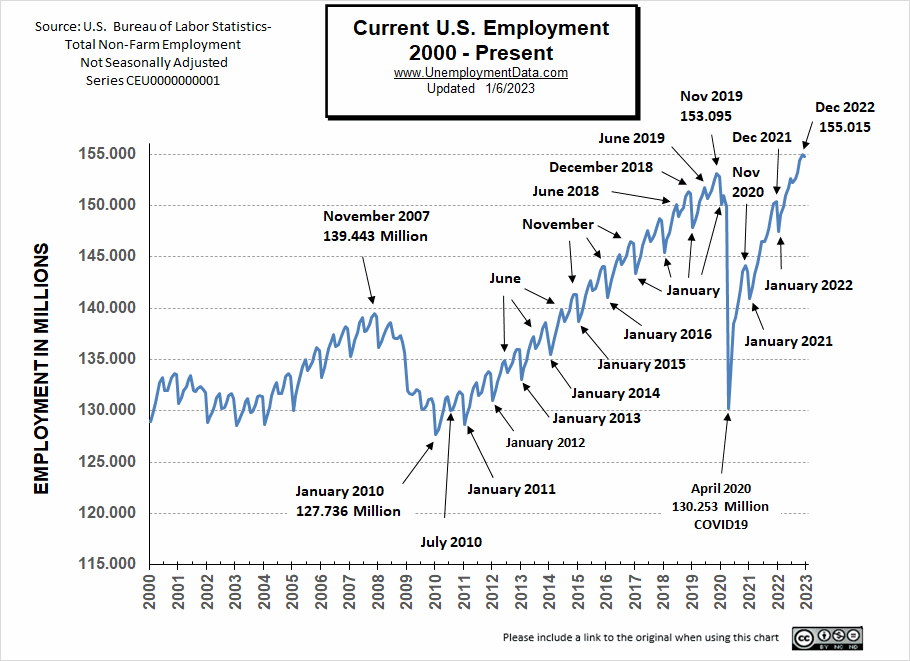
See Current Employment for more info.
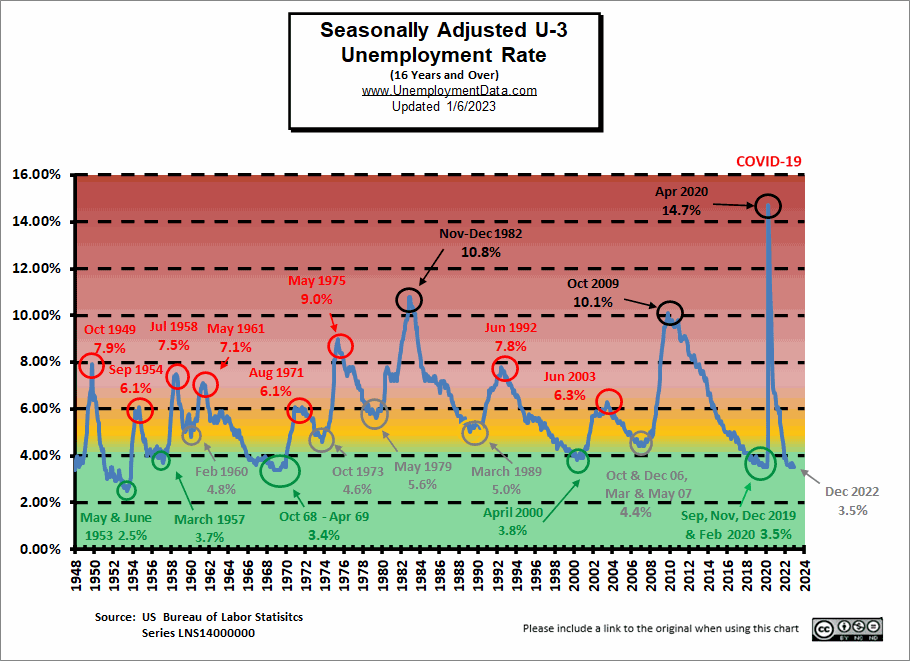
Unemployment Still Historically Low
Unemployment levels are still in the historically low territory. After all, the FED did pump unprecedented TRILLIONS into the economy to get us to this place.
See: FED Actions for more info.
But we can see that Seasonally Adjusted U-3 is definitely in the “Green” territory.
 Click for a larger Image
December 2022 Labor Force Participation Rate
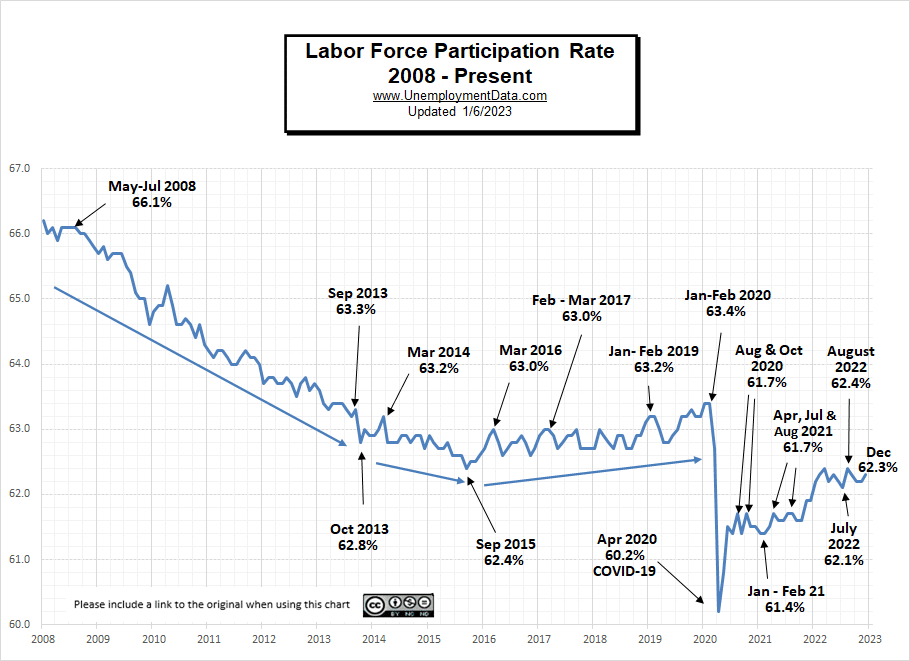 See Labor Force Participation Rate for more information.
Seasonally Adjusted U1 through U6 Unemployment Rates
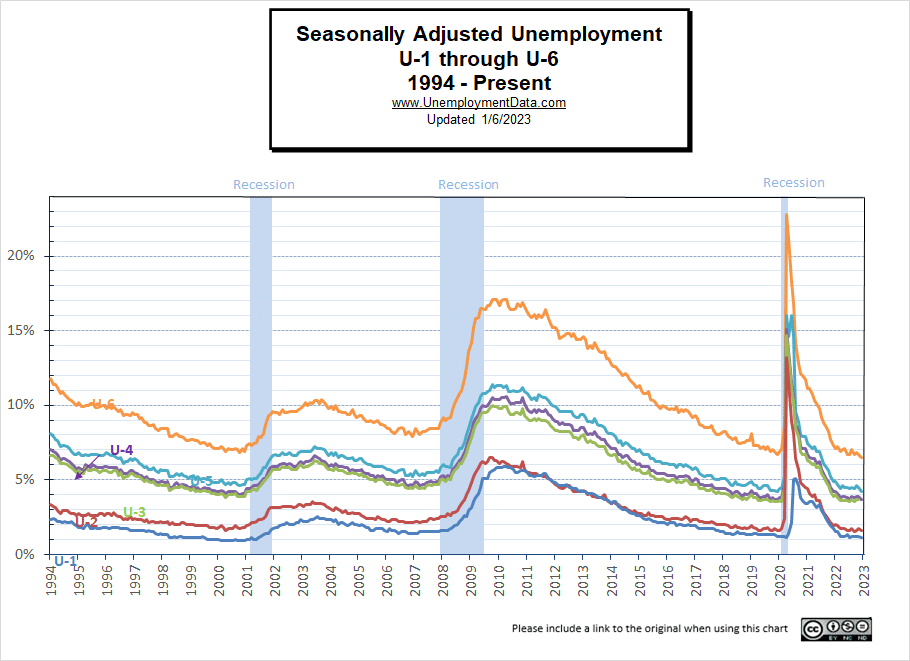 For more information about the various measurements of unemployment, see What Is U-6 Unemployment?
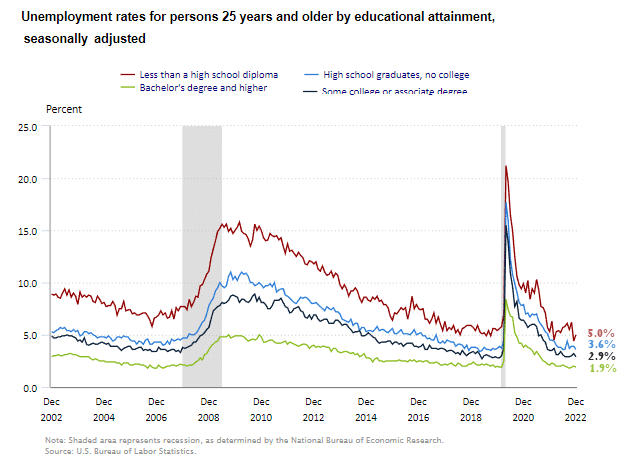
Seasonally Adjusted Unemployment by Education
 Employment-Population Ratio
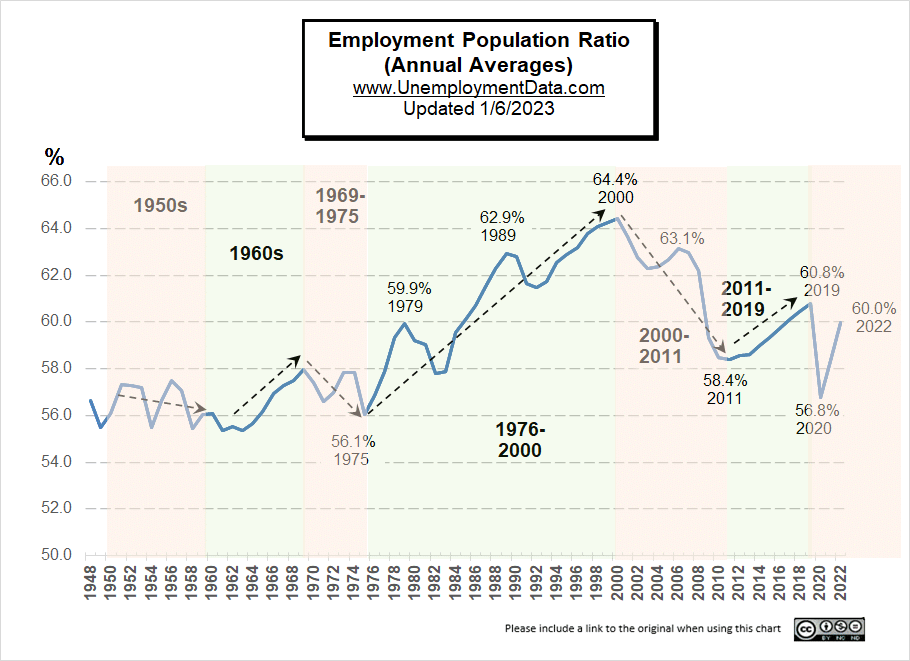
See Employment Population Ratio for more information
Read more on UnemploymentData.com.
- 5 Career Opportunities for Disabled Individuals
- 4 Careers that Don’t Require a 4 Year Degree
- Unbelievably Easy Ways To Find Employment Opportunities Near You
- Love to Drive? These 6 Jobs Are For You
From InflationData.com
- Inflation Down in November
- November Producer Price Index Declines from 2021 to 2022
- Gasoline Prices vs. Wages Over Time
- Can Businesses Really Set Any Price They Want?
- What is the Reverse Wealth Effect and Why Does the FED Want It?
From Financial Trend Forecaster
- Moore Inflation Predictor
- NYSE ROC
- NASDAQ ROC
- Are Countries Getting Smaller?
- Is the U.S. Dollar Hegemony Ending?
- Latest Recession Alarm
- Housing Is Getting Less Affordable
- Are Housing Prices Set to Crash?
From Elliott Wave University
- 60% stocks, 40% bonds? Ha!
- U.S. Dollar: Has the Mainstream Been Way Too Confident?
- Banks Are Becoming More Cautious About Lending
- Are You Prepared for Widespread Bank Failures?
- Will Another “Great Depression” Start in Europe?
From OptioMoney.com
- Simple Ways to Save Money When Shopping Online
- How to Start Saving for Your Education
- 6 Tips for Moving Out of Your Parent’s Home with No Money
- 5 Tips for Paying Off Your Debt
- Warning Signs You’re On the Road to Financial Catastrophe
From Your Family Finances