The U.S. Bureau of Labor Statistics (BLS) released their employment / unemployment report for August.
- Unadjusted U-3 was Down from 5.7% to 5.3%
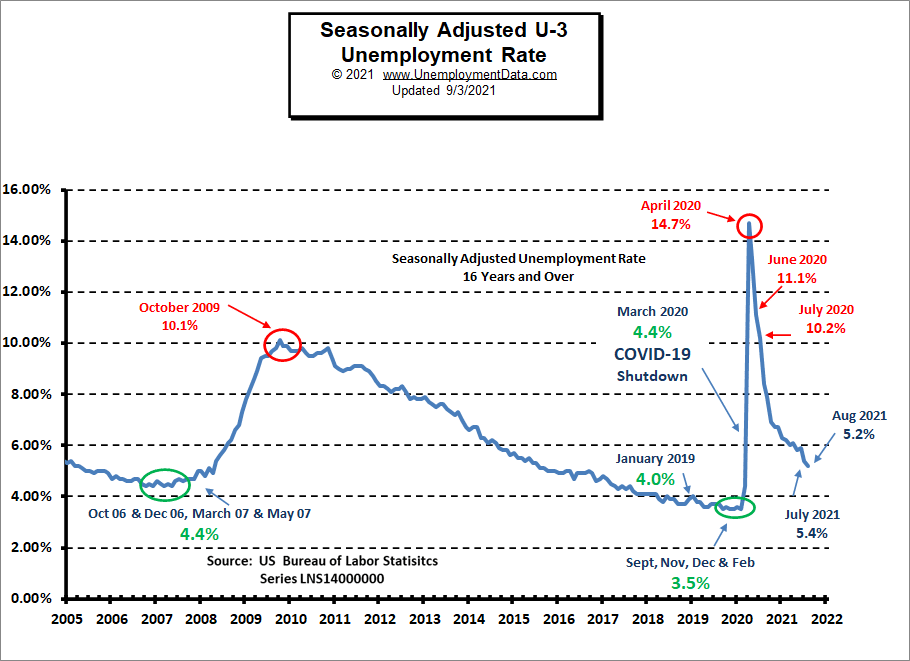
- Adjusted U-3 was Down from 5.4% to 5.2%
- Unadjusted U-6 was Down from 9.6% to 8.9%
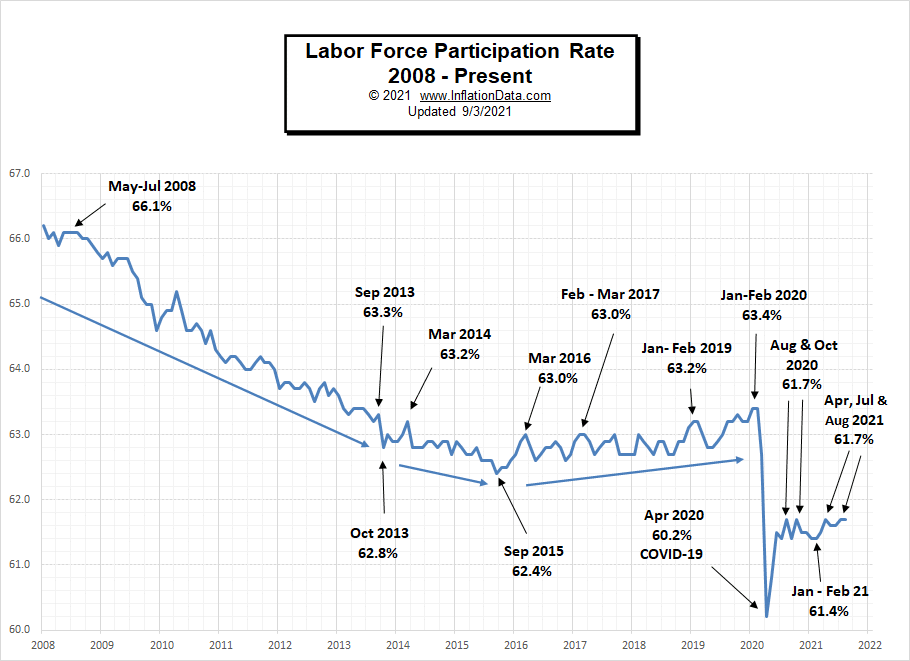
- Labor Force Participation unchanged at 61.7%
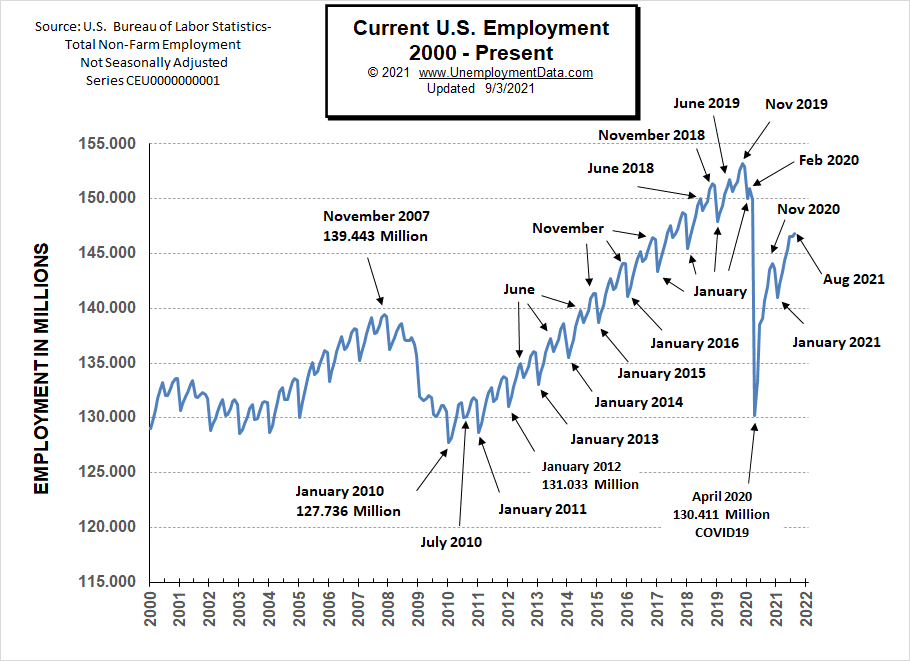
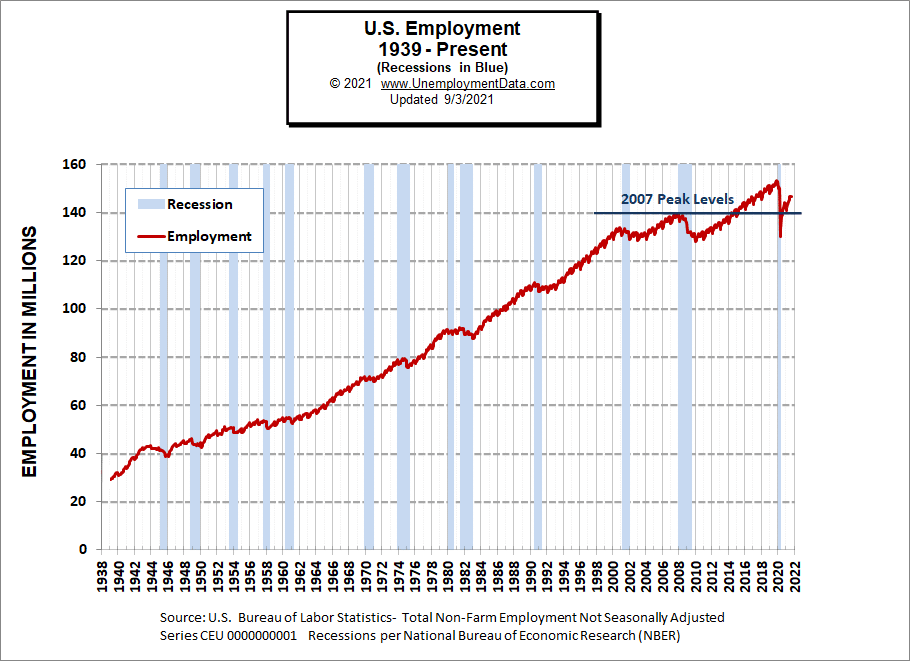
- Unadjusted Employment rose from 146.544 million to 146.856 million
The Pandemic Emergency Unemployment Compensation program, which extends unemployment benefits by up to 24 weeks for those who have exhausted regular unemployment aid, and the $300 weekly supplement to state unemployment benefits, are due to expire on September 6. This may be the motivation some unemployed individuals needed to get back to work. Many have complained that the government assistance was paying certain people at the lower end of the payscale more to stay home than they could earn by going to work.
According to the Commissioner of the U.S. Bureau of Labor Statistics:
Total nonfarm payroll employment rose by 235,000 in August, and the unemployment rate declined by 0.2 percentage point to 5.2 percent, the U.S. Bureau of Labor Statistics reported today. So far this year, monthly job growth has averaged 586,000. In August, notable job gains occurred in professional and business services, transportation and warehousing, private education, manufacturing, and other services. Employment in retail trade declined over the month.
As usual, they are talking about “Seasonally Adjusted Jobs” from the “Current Population Survey (CPS)” rather than looking at the results reported by actual companies in their “Current Employment Statistics survey (CES)”
But looking at the CES report we see…
Originally the BLS reported 146.470 for July which they adjusted to 146.544 million. For August they are currently saying employment is 146.856 million which is actually an increase of 386,000 jobs based on their original estimates or an increase of 312,000 based on their updated numbers.
Employment by Sector
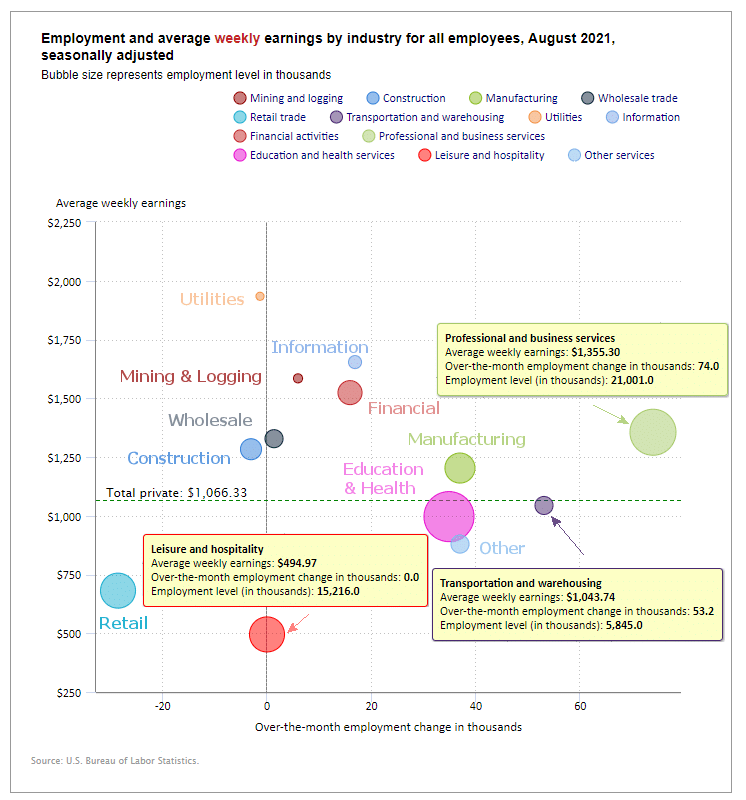
Employment gains and losses are not “monolithic” i.e. some sectors gain while others lose during any given month. The employment “bubble chart” shows how each sector is doing separately (on a seasonally adjusted basis).
Typically the leisure and hospitality (L&H) sector does well during the summer months. In August this year, L&H neither gained or lost meaning that on a seasonally adjusted basis it was 100% typical. Retail on the other hand performed especially badly with a seasonally adjusted loss of -28,500 jobs. Most other sectors performed better than average with the exception of Construction and Utilities which each had slight losses. The largest gainer was Professional and Business Services with a whopping 74,000 job gain. Transportation and Warehousing gained 53,200, Manufacturing and “Other” each gained 37,000, and Education and Health gained 35,000.
Although these incremental gains look good, overall employment is still below peak levels of November 2019 and the population has increased by roughly 1.6 million.
Average weekly wages rose from $1,062.79 in July to $1,066.33 in August.
(See the table below for details.)
How to read this chart:
The bubbles location on the chart tell us two things:
- Change in Employment Levels over the most recent month.
- Average Weekly earnings.
- The further to the right the bubble the larger the increase in the number of jobs.
- The higher up on the chart the larger the average salary.
Bubble Size tells us:
- Total Employment for the sector.
- Larger bubbles mean more people are employed in that sector.
Employment and Average Weekly Earnings by Industry
August 2021, Seasonally Adjusted
| Industry | Monthly Increase | Average Weekly Earnings | Employment Level |
| Total Private Employment | 243,000 | $1,066.33 | 125,145,000 |
| Mining and Logging | 6,000 | $1,584.64 | 644,000 |
| Construction | -3,000 | $1,283.12 | 7,416,000 |
| Manufacturing | 37,000 | $1,202.96 | 12,421,000 |
| Wholesale trade | 1,400 | $1,327.95 | 5,722,100 |
| Retail trade | -28,500 | $681.30 | 15,324,900 |
| Transportation and Warehousing | 53,200 | $1,043.74 | 5,845,000 |
| Utilities | -1,300 | $1,933.93 | 537,300 |
| Information | 17,000 | $1,653.91 | 2,764,000 |
| Financial Activities | 16,000 | $1,523.93 | 8,846,000 |
| Professional and Business Services | 74,000 | $1,355.30 | 21,001,000 |
| Education and Health Services | 35,000 | $996.34 | 23,660,000 |
| Leisure and Hospitality | 0 | $494.97 | 15,216,000 |
| Other Services | 37,000 | $879.36 | 5,748,000 |
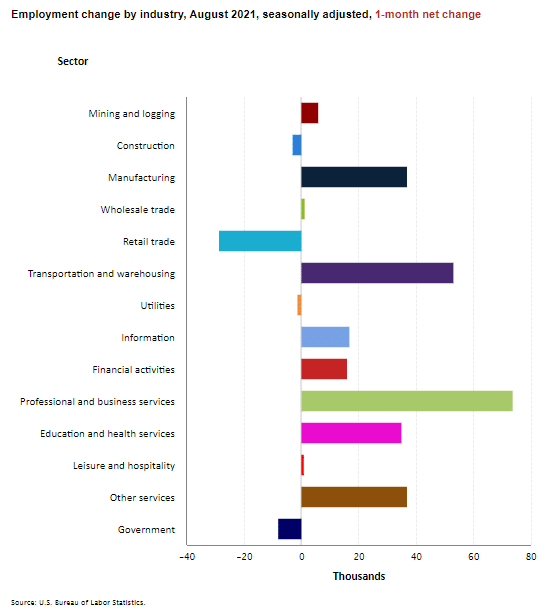
Another way to look at these monthly numbers. This one includes government jobs and shows the magnitude of the gain in Professional and Business Services jobs was.
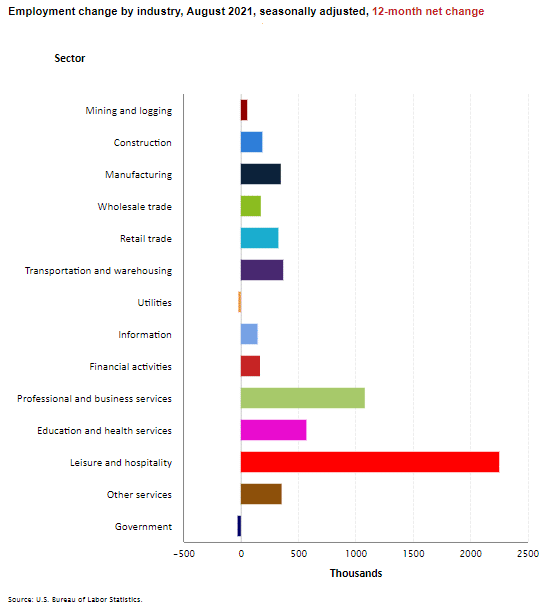
Looking at it over 12 months we can see the improvement in all the sectors. Even though Leisure and Hospitality didn’t gain much over the last month it is by far the biggest gainer on an annual basis but it also lost the most during the COVID shutdown.
Source: BLS
Employment-Population Ratio
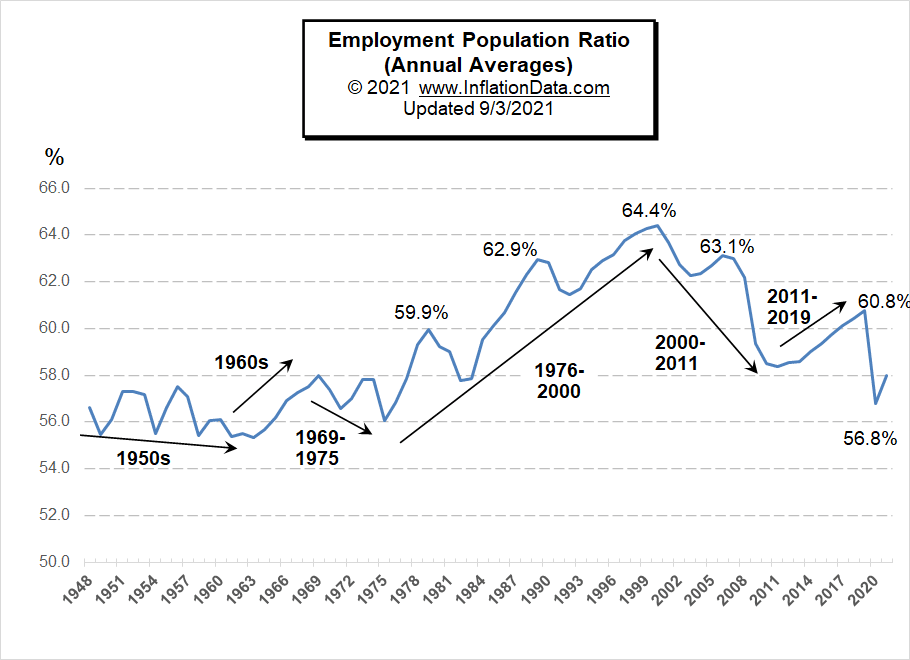
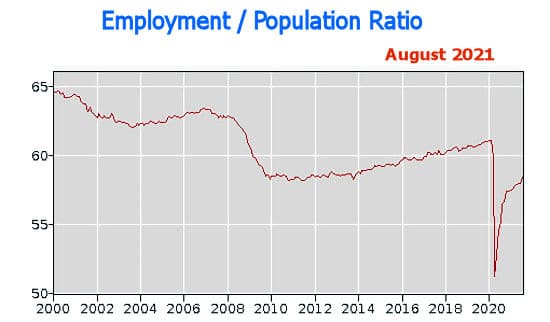
This month we’ve added a new page and expanded our coverage of the Employment-Population Ratio. This chart shows the actual percentage of the population that is working, unlike the Labor Force Participation rate which shows the percentage of the population that is working or looking for work.
In this chart, we can see the long-term trends in the percentage of the population that is working. For more information and to see the full commentary on these trends see Employment-Population Ratio.
This is the chart from the BLS that we have covered in the past.
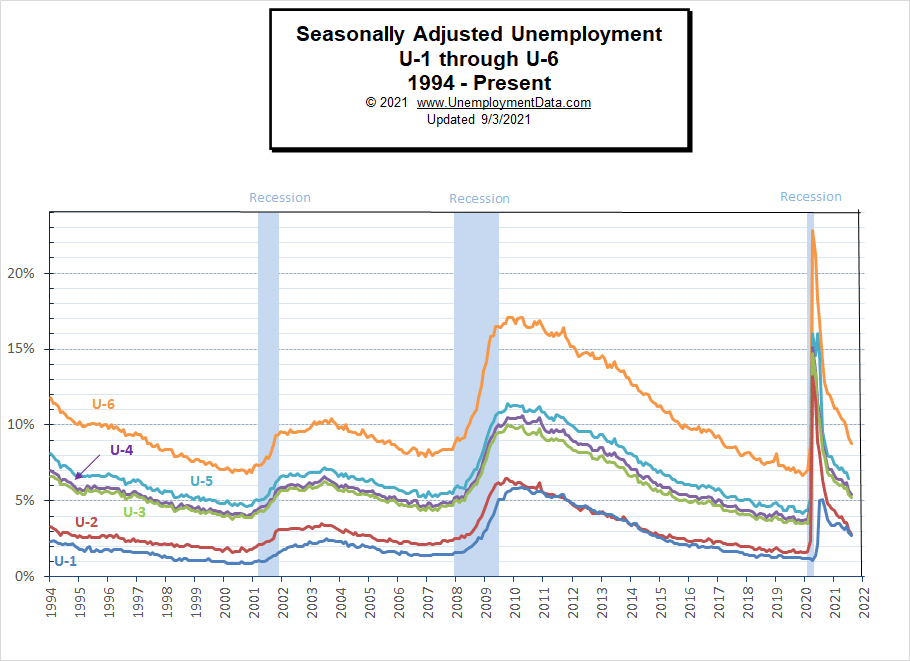
U1 through U6 Unemployment Rates
Last month the National Bureau of Economic Research (NBER) has determined that a sharp upturn occurred only 2 months after the recession started, so officially the recession bottomed in April 2020. The previous peak in economic activity occurred in February 2020 making it the shortest recession on record. And we can see that unemployment did fall rather quickly.
For more information about the various measurements of unemployment see What Is U-6 Unemployment?
Current Employment
Actual employment ticked up very slightly in August compared to July. As mentioned above, overall employment is still well below peak levels of November 2019 despite the population growing by roughly 1.6 million.
See Current Employment for more info.
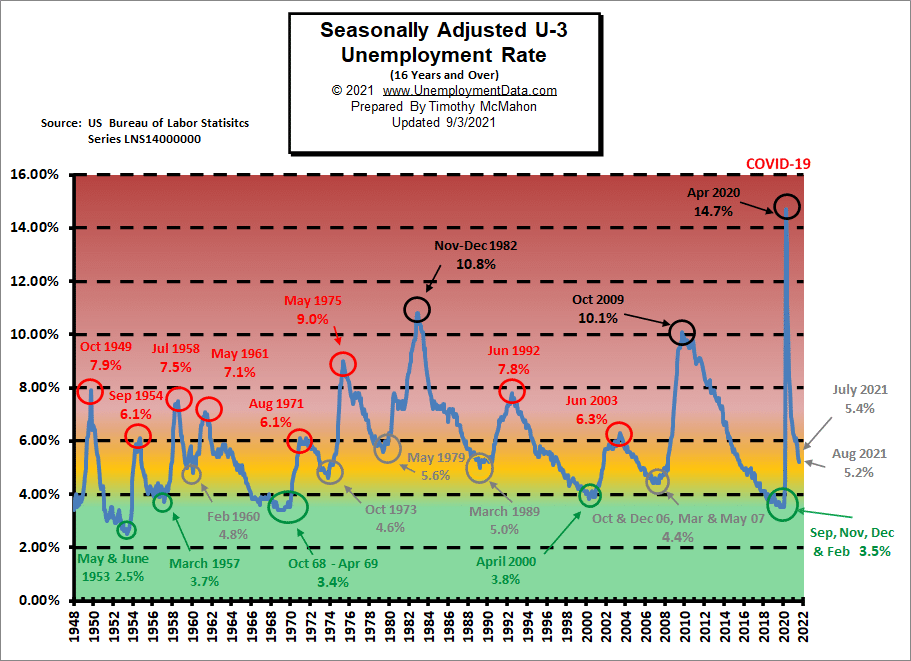
Unemployment Normalizing
In the chart below the “red zone” indicates things are really bad. Historically “Bad” for the U-3 usually starts at around 6.5%-7% and stops at around 10% with only three occasions getting above 10%. In 2020 COVID sent unemployment from really good (green zone) to really bad virtually overnight.
The yellow zone (from about 4% to 6%) is the normal operating range and when unemployment stays in this range the economy is generally doing OK. Below 4% and the economy is doing great and above 7% and the economy is in for trouble. Currently, the adjusted U-3 unemployment rate has fallen from the horrendous 14.7% of April 2020 down to 5.2% in August.
Historical Employment
Historically one of the primary indicators of a recession is the unemployment rate. The blue bars in the chart below indicate official recessions while the red line shows the Historical Employment Data. It took several years after the 2008 crash for employment to climb back above the 2007 peak levels and then in April 2020, the number of people employed fell below the 2007 peak once again. Approaching the lows of the 2008-2010 crash. By August 2020, employment had rebounded back above the 2007 peak level but it remains below the 2019 peak.
See Historical Employment Data for more info.
Current Seasonally Adjusted Unemployment
Duration of Unemployment
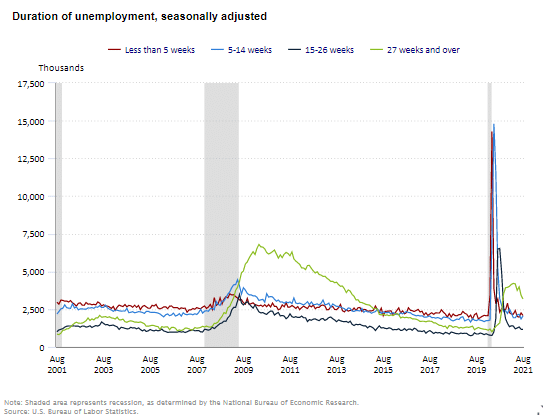
Looking at how long people remain unemployed can give us an indication of how bad the economy is. So if most of the people are unemployed for less than 5 weeks (red line) that would indicate that they can find jobs relatively easily. On the other hand, when times are bad, there will be more people who are unemployed for 27 weeks or more (green line). As things start getting bad the green line rises through the red line as we saw in 2008. It then took several years for the green line to fall below the red line. Because unemployment spiked so quickly in 2020 first the red line climbed and then the other lines followed. The green line has started falling but it is still above the red line.
Labor Force Participation Rate
The Labor Force Participation Rate (LFPR) appears to be bouncing between 61.4% and 61.7%.
See Labor Force Participation Rate for more information.
If you would like to receive this monthly report and other article updates click here you can unsubscribe at any time.
Here are some articles you might enjoy in case you missed them:
Read more on UnemploymentData.com.
- 5 Ways to Boost Your Career in Digital Marketing
- Why Managers Should Receive Regular Soft Skills Training
- How Military Service Can Set You up for a Good Education/Career
- What to Know When Leaving Your Job
- Transform Your Career by Passing Microsoft AZ-900 Certification Exam
From InflationData.com
- How to Prepare for Inflation
- Safe-Haven Investments that Protect Your Capital From Rising Inflation
- 9 Inflation Books You Must Read
- Hyperinflation Strikes Lebanon… Again
- The Relationship Between Inflation and Interest Rates: Explained
- How Can Inflation Affect Businesses?
- Inflation and Bonds
- Oil vs. Gold- Why Compare Commodity Prices Against Each Other?
- How Does a Country “Export” its Inflation?
From Financial Trend Forecaster
- Moore Inflation Predictor
- NYSE ROC
- NASDAQ ROC
- Fintech: The New Financial Management Disruptive Technology
- Credit Card Debt Trends
- The Making of the Next Housing Crisis
- Which is Over Priced? Oil or Gold?
- What are NFTs and Why are They Going Crazy?
- Is Bitcoin Headed For a Fall?
- Be Prepared “Or Else”
- The Maniacal Residential Real Estate Market
- Why the Stock Market is the True “Great Deceiver”
- High “Beta” stocks … “Meme” stocks… and Index stocks… Oh My!
- Why U.S. Corporate Bankruptcies Could Skyrocket
- Why “Trouble is Brewing” for the U.S. Housing Market
- The Fear of Missing Out
From OptioMoney.com
- How to Get the Most Money When You Sell Used Furniture
- A Unique Way to Create Extra Income
- How Your Credit Score Affects You and Your Family
- Tips For Renting Out a Room In Your House
- How to Prepare to Apply for a Mortgage When You Are Self-Employed
From Your Family Finances

