
April 2022 Employment — Bureau of Labor Statistics (BLS) Jobs Report
![]()
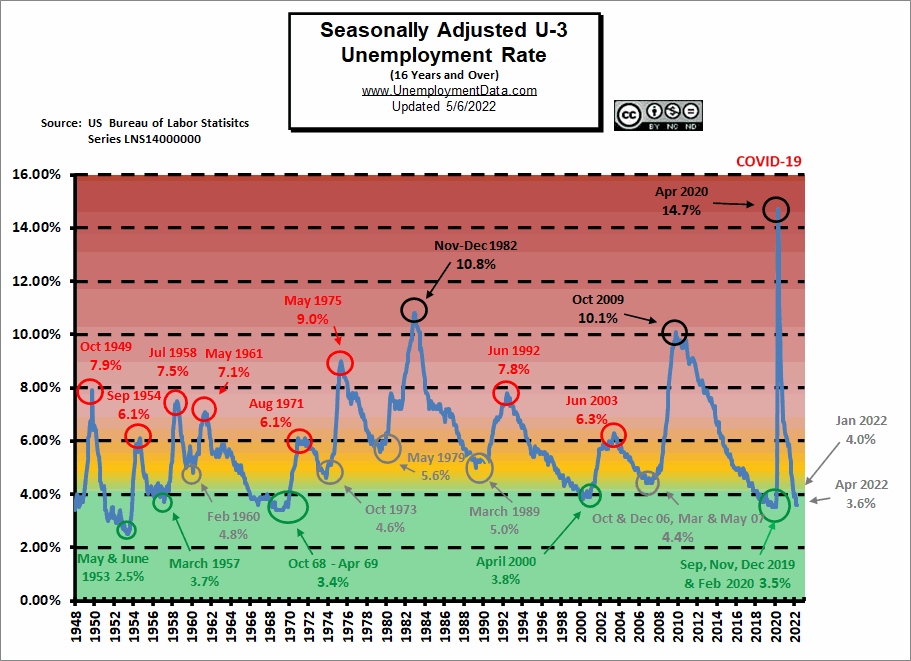
- Adjusted U-3 was Unchanged at 3.6%
- Unadjusted U-3 was Down from 3.8% to 3.3%
- Unadjusted U-6 was Down from 7.1% to 6.6%
- Labor Force Participation Down from 62.4% to 62.2%
- Unadjusted Employment rose from 149. 912 to 150.938 million
According to the Commissioner of the U.S. Bureau of Labor Statistics:
“Nonfarm payroll employment increased by 428,000 in April, and the unemployment rate was unchanged at 3.6 percent. Job growth was widespread, led by gains in leisure and hospitality, in manufacturing, and in transportation and warehousing.
Nonfarm employment is down by 1.2 million, or 0.8 percent, from its February 2020 level before the onset of the coronavirus (COVID-19) pandemic.
In April, employment growth continued in leisure and hospitality (+78,000), with gains in food services and drinking places (+44,000) and accommodation (+22,000). Employment in leisure and hospitality is down by 1.4 million, or 8.5 percent, from its February 2020 level.”
As usual, they are talking about “Seasonally Adjusted Jobs” from the “Household Survey” rather than looking at the results reported by actual companies in the BLS “Establishment Survey”
Looking at the Establishment Survey report we see…
Originally the BLS reported employment of 149.938 million for March which they adjusted to 149.912 million. So 26,000 jobs disappeared for March. They are reporting 150.938 million jobs for April which is actually an increase of exactly 1,000,000 jobs based on their original estimates or an increase of 1,026,000 based on their updated numbers.
According to Jeffrey Tucker at Gilder’s Daily Prophecy “The jobs report this morning didn’t look half bad on the surface… The trouble was in the footnotes: The U.S. labor force shrank by 363,000 people in April from a month earlier… The labor force participation rate… ticked down to 62.2% in April from 62.4% in March.
So the dropout economy is getting worse, not better, rendering these unemployment numbers rather pointless… Women with kids have dropped out and child care is too expensive. Many men just moved home to mom and dad and are happy to live off savings and look forward to going into debt. Plus, the demoralization of the workforce after lockdowns has drained American ambition… In addition, wage growth is slowing, a fact which might cheer the Fed, but is bad news for workers because it means the purchasing power of their wages will fall further, after having endured a devastating hit over the last six months.
A former Fed official went public with a very obvious statement, namely that the federal funds rate needs to be 3.5% in order to even begin to make a dent in inflation.
How does Richard Clarida know this? It’s not rocket science: short-term rates need to be positive in real terms rather than negative. That means 3.5%, yes, but more likely double or triple that. The Fed simply won’t go there. The Fed’s theory is that it can put out the house fire by carefully spraying a bit of water here and there in a way that doesn’t cause shock and alarm.”
Employment / Population Ratio
As we can see in the Employment-Population Ratio the “pandemic” is still an excuse for many people.
According to the April 2022 Household Survey Supplemental Data:
In April, 7.7 percent of employed persons teleworked because of the coronavirus pandemic, down from 10.0 percent in the prior month. These data refer to employed persons who teleworked or worked at home for pay at some point in the 4 weeks preceding the survey specifically because of the pandemic.
In April, 1.7 million persons reported that they had been unable to work because their employer closed or lost business due to the pandemic–that is, they did not work at all or worked fewer hours at some point in the 4 weeks preceding the survey due to the pandemic. This measure is down from 2.5 million in the previous month. Among those who reported in April that they were unable to work because of pandemic-related closures or lost business, 19.0 percent received at least some pay from their employer for the hours not worked, little different from the prior month.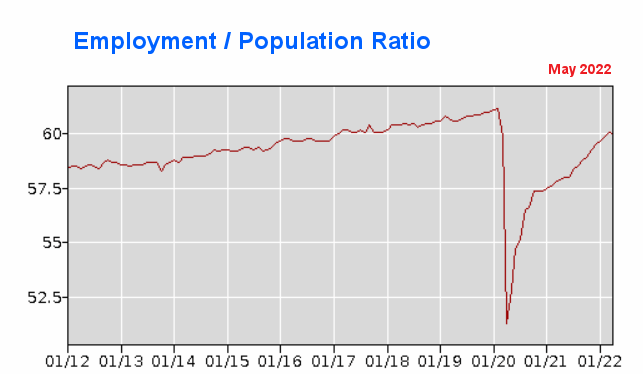
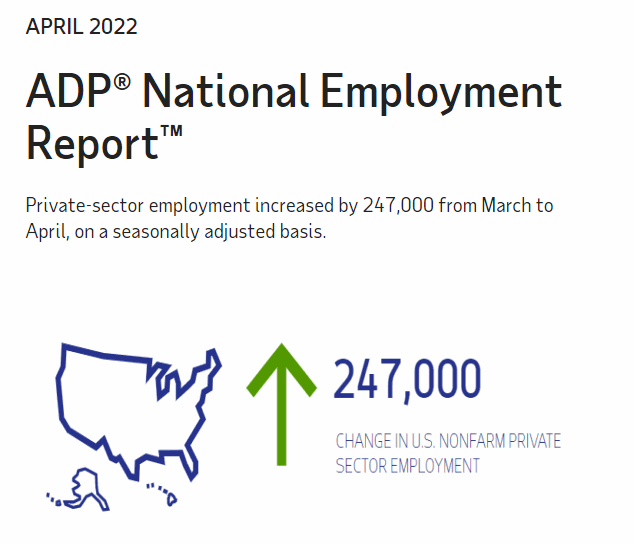
ADP National Employment Report
In addition to the BLS, we can look at the Jobs Report generated by private companies like ADP Research Institute. In this case, ADP numbers are only half of the BLS “Current Population Survey (CPS)” numbers and 1/4 of their “Current Employment Statistics survey (CES)” numbers.
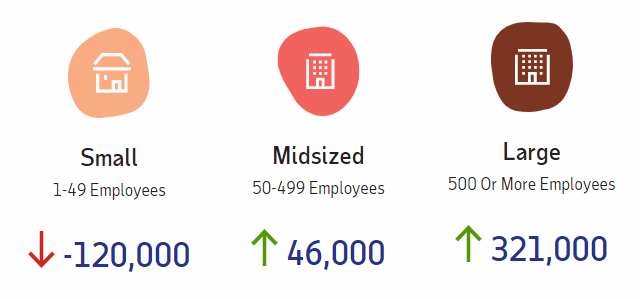
The interesting thing about ADP data is that they also provide breakdowns based on company size. And small companies continue to shrink. Long-term this is NOT good small companies are where the future big companies come from.
Unemployment Historically Low
Companies continue to have difficulty finding qualified workers, and unemployment is nearing historic lows. In signs of the overheated economy that Larry Summers talked about,
 Click for a larger Image
April 2022 Employment by Sector
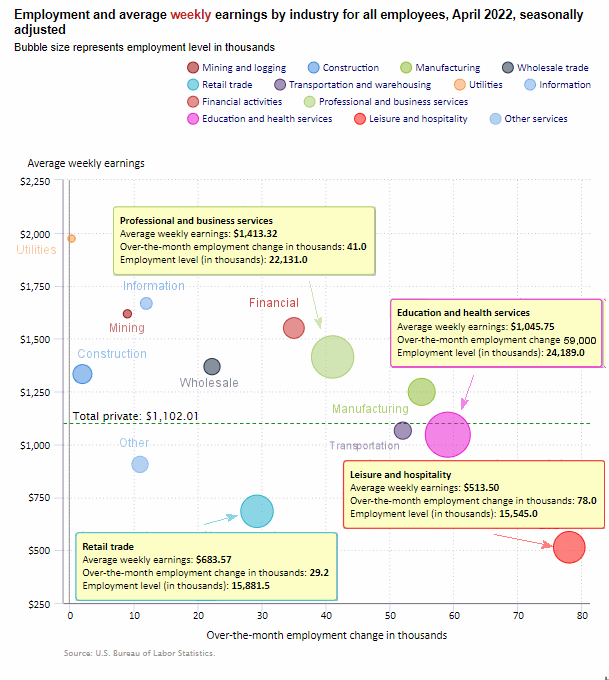
The employment “bubble chart” is a quick and easy way to see how each sector performs on a seasonally adjusted basis. The Bubble’s Size tells us the total Employment for that industry (i.e., larger bubbles mean more people are employed in that sector).
The bubble’s location on the chart tells us that there has been a change in Employment Levels over the most recent month… A bubble further to the right indicates larger job growth. A bubble’s vertical location on the chart shows the average industry salary.
Average weekly wages $1,102.01 up from $1,097.86 in march and $1,086.46 in December 2021.
 Click for a larger Image.
Remember, these are Seasonally Adjusted Numbers! Once again, Leisure and Hospitality was the largest gainer with 78,000 new jobs. Professional and Business Services gained 41,000 jobs. Education and Health gained 59,000 jobs, and Retail gained 29,200 jobs. Transportation gained 52,000 after losing a few jobs last month.
Employment and Average Weekly Earnings by Industry
April 2022, Seasonally Adjusted Employment
| Industry | Monthly Increase | Average Weekly Earnings | Employment Level |
| Total Private Employment | 406,000 | $1,102.01 | 129,125,000 |
| Mining and Logging | 9,000 | $1,617.25 | 613,000 |
| Construction | 2,000 | $1,332.39 | 7,628,000 |
| Manufacturing | 55,000 | $1,248.21 | 12,729,000 |
| Wholesale trade | 22,200 | $1,367.64 | 5,835,700 |
| Retail trade | 29,200 | $683.57 | 15,881,500 |
| Transportation and Warehousing | 52,000 | $1,065.02 | 6,468,400 |
| Utilities | 300 | $1,972.87 | 539,100 |
| Information | 12,000 | $1,666.55 | 2,951,000 |
| Financial Activities | 35,000 | $1,550.25 | 8,941,000 |
| Professional and Business Services | 41,000 | $1,413.32 | 22,131,000 |
| Education and Health Services | 59,000 | $1,045.75 | 24,189,000 |
| Leisure and Hospitality | 78,000 | $513.50 | 15,545,000 |
| Other Services | 11,000 | $905.37 | 5,673,000 |
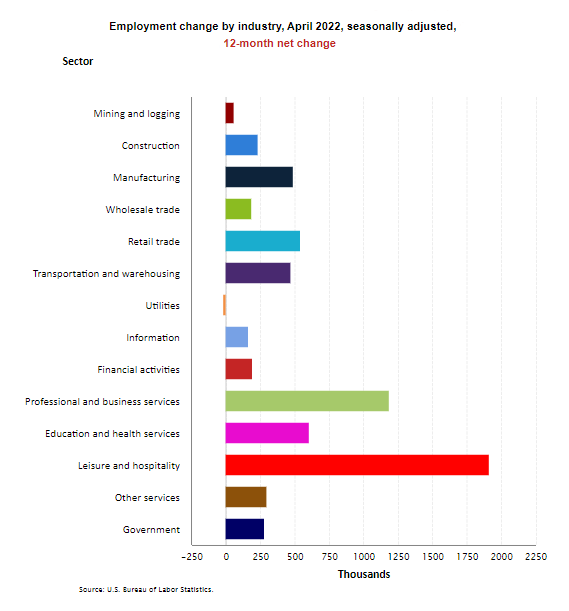
Annual Employment Change by Industry
Looking at Employment Change by Industry over the last 12 months, we can see that Government gained 279,000 jobs over the year while Leisure and Hospitality gained 1,914,000.
April 2022 Unemployment by Education
College grads only have a 2% unemployment rate, while those with less than a High School diploma actually ticked up to 5.4% from 5.2% last month.
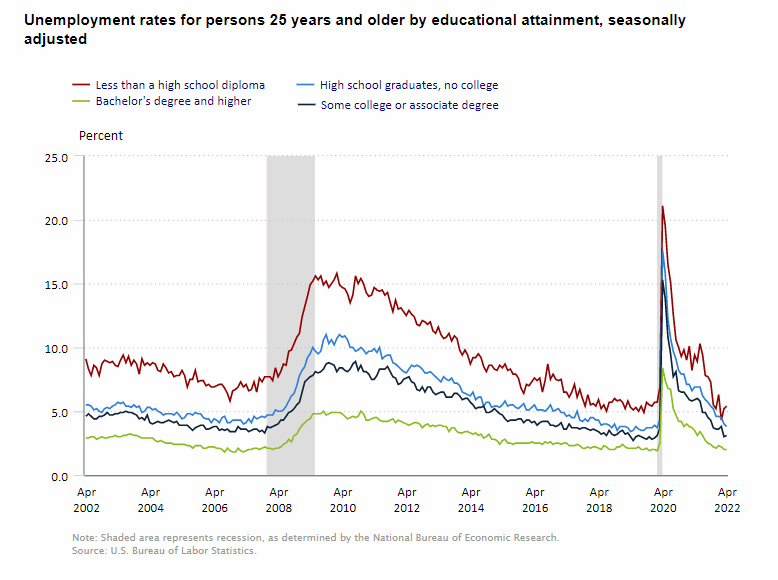
Source: BLS
April 2022 Labor Force Participation Rate
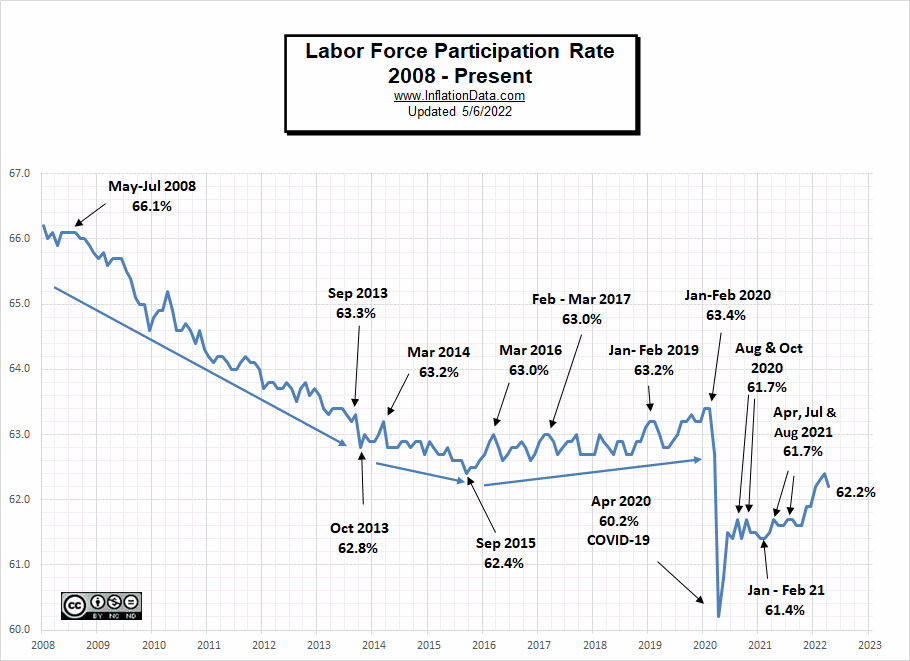 LFPR is down 2/10th% after being up 1/10th% last month but is still more than an entire percentage point below Jan-Feb 2020 levels possibly indicating a permanent exodus from the labor force.
See Labor Force Participation Rate for more information.
Seasonally Adjusted U1 through U6 Unemployment Rates
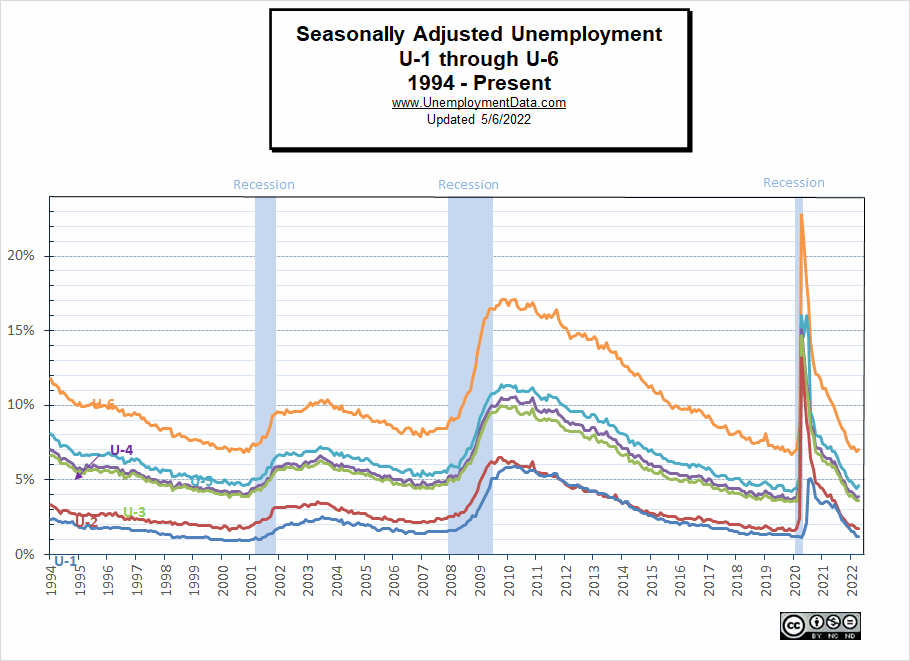
For more information about the various measurements of unemployment, see What Is U-6 Unemployment?
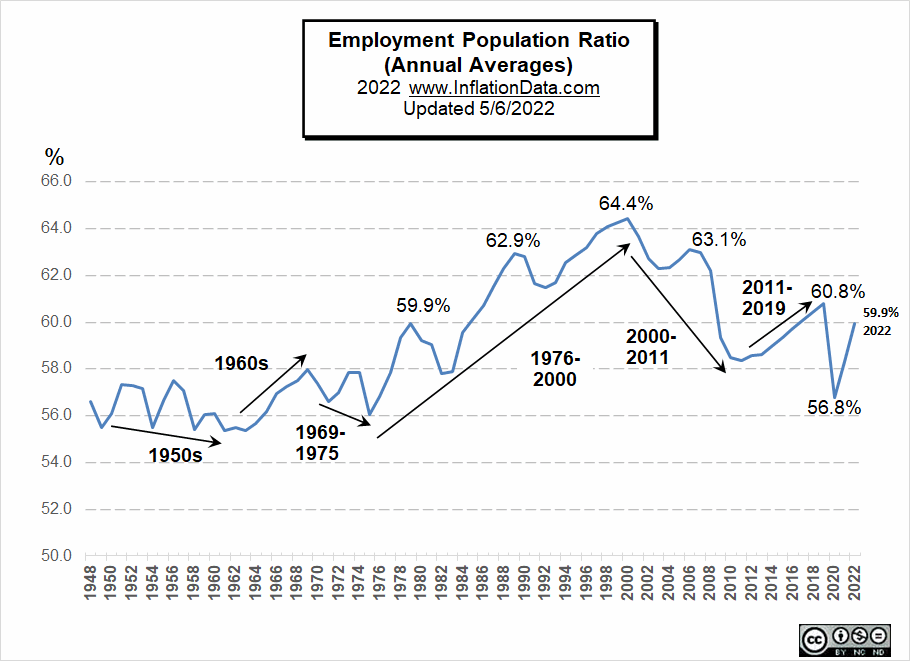
April Employment-Population Ratio
This chart shows the actual percentage of the population that’s working, unlike the Labor Force Participation Rate, which shows the portion of the people working or looking for work. The Annual Average Employment-Population Ratio for 2021 was 58.3% so far for 2022 it is 59.9%.
By looking at annual averages rather than monthly numbers, we can see the long-term trends in the percentage of the population that is working. For more information and the full commentary on these trends, see Employment-Population Ratio.
Current April 2022 Employment
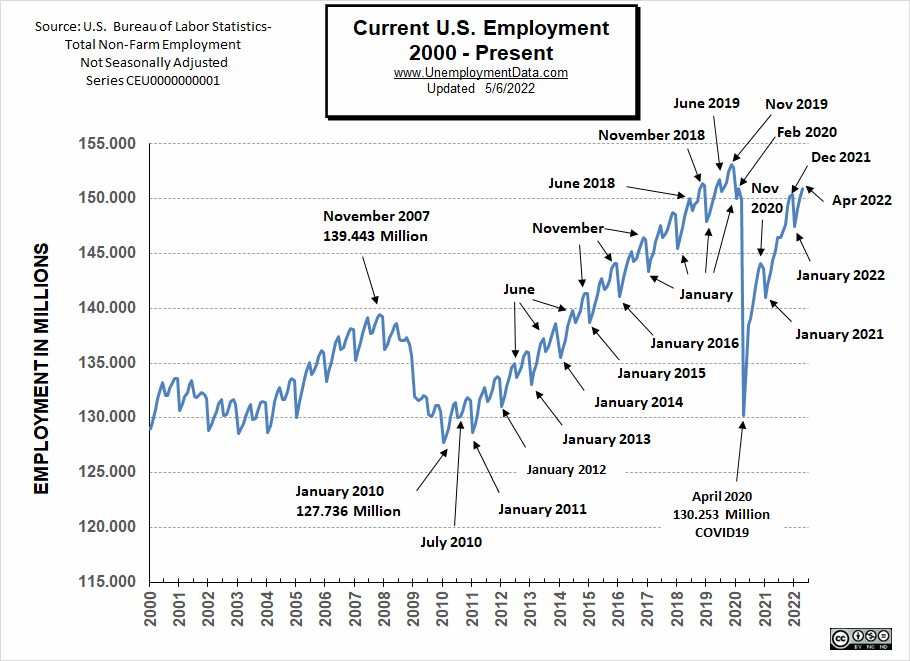
April 2022 employment increased above December 2021 but is still below November 2019 levels, plus the Civilian Non-Institutional Population has increased by 3.9 million since then.
Unemployment is nearing previous cyclical lows. It is currently below the 2006-7 lows of 4.4% and approaching the 2000 low of 3.8% but still not quite to the 2019 low of 3.5%.
See Current Employment for more info.
Click here if you would like to receive this monthly report and other article updates. You can unsubscribe at any time.
Here are some articles you might enjoy if you missed them:
Read more on UnemploymentData.com.
- Jobs of the Future: Growing Your Career in the IT Field
- Practical Resources for Migrant Workers in the U.S.
- Is Intermodal Trucking The Right Job For You?
- What Is Hot Shot Trucking?
From InflationData.com
- Roots of Our Current Inflation
- How Families Are Adjusting To The Crazy Inflation Rates
- How To Invest In Cryptocurrency: 4 Tips For Beginners To Get Started
- March Inflation Highest Since 1981
- Former Treasury Secretary Larry Summers on the Current Inflation Situation
- How Quickly Can The FED Get Inflation Under Control?
From Financial Trend Forecaster
- Moore Inflation Predictor
- NYSE ROC
- NASDAQ ROC
- The Fed’s New “Tightening” Plan Is Too Little, Too Late
- Keynesians and Market Monetarists Didn’t See Inflation Coming
- Elon Musk Ambushes Twitter
- Can Ruthless Governments Make Crypto Worthless?
- Will Russian Sanctions Open a Can of Worms?
- In What Universe is $100+ Crude Oil Cheap?
- Predicting the Collapse of a “Parabolic Rise”
- Surging Housing Prices Are Entering The Stratosphere- Look Out Below
- Germany’s DAX: What You Can Learn from the 2007 Top
- The Market is Currently a “Mixed Bag”
- The Journey to High-Confidence Trading Starts Now!
From OptioMoney.com
- Surprising Ways a Storage Unit Can Save You Money
- Guide to Managing Small Business Finances
- Unlock The Benefits Of A Good Credit Score
- Buying A Home When You Are Already In Debt
- Top 10 Tasks Businesses Should Outsource in 2022
From Your Family Finances