
![]() January Unemployment is almost record setting… but not for the reason you might think.
January Unemployment is almost record setting… but not for the reason you might think.
On Friday February 2nd the U.S. Bureau of Labor Statistics (BLS) released their monthly employment survey results for the month of January. According to the BLS the Seasonally Adjusted U-3 Unemployment Rate for January is unchanged for the almost record setting 4th month in a row. That’s right from October through January the Seasonally Adjusted Unemployment rate has been 4.1%. This is a very low level and we really don’t expect it to get too much lower but the interesting part is that the unadjusted U-3 was 3.9% from October through December (resulting in the adjusted rate being 4.1%) but then in January the unadjusted rate jumped to 4.5% (a 0.6% increase) and the adjusted U-3 remained the same at 4.1%. This is because typically January sees an uptick in unemployment as all the seasonal employees get laid-off. So we would expect some sort of uptick in unadjusted unemployment rate. But because the Seasonally Adjusted U3 was unchanged for the month the current increase in the unadjusted U-3 was actually no greater or less than normal. See Current Unemployment Chart for more info.
U-6 Unemployment
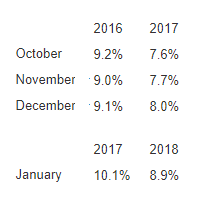 Over the same period, Unadjusted U-6 unemployment which is a broader measure of Unemployment including discouraged workers, climbed steadily.
It was 7.6% in October, then 7.7% in November, then 8.0% in December, and finally 8.9% in January.
This is still significantly better than a year ago when in November 2016 Unadjusted U-6 was 9% and had climbed to 10.1% by January 2017.
See Unadjusted U-6 unemployment for more info.
Employment
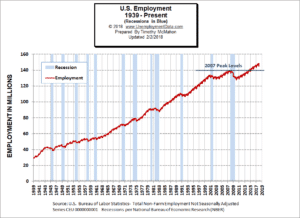 Over the last month, the actual number of people working (not seasonally adjusted) has decreased by -3,085,000 jobs and at the same time the civilian non-institutional population (a fairly narrow measurement of population) has increased by a very large 671,000 due to the BLS adjusting their numbers to match the census bureau numbers.
The BLS Commissioner said:“Nonfarm payroll employment rose by 200,000 in January, and the unemployment rate remained at 4.1 percent. Employment continued to trend up in construction, food services and drinking places, health care, and manufacturing. In 2017, employment growth averaged 181,000 per month.” The reason the BLS commissioner said jobs increased by 200,000 is because he is talking about “Seasonally Adjusted” jobs. Meaning that although actual jobs are down by over 3 MIllion, they are up by 200,000 more than average for this time of year.
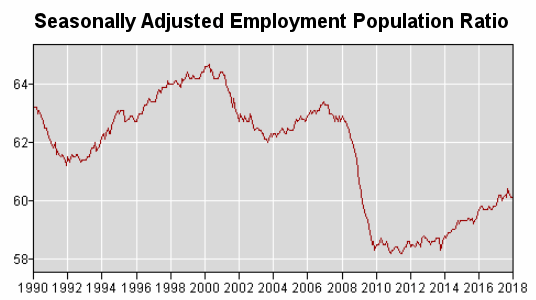
Employment / Population Ratio
If you take the number of jobs and divide it by the population you get what percentage of the population is working. You would think this would be a much more accurate indicator than the unemployment rate. If we look at the current Employment Population Ratio chart you will see that it fell drastically beginning in 2008 and has since begun climbing but it is still nowhere near previous levels. As a matter of fact it isn’t even up to the previous lows of 1992 and 2003. So the fact that the “unemployment rate is the same” is a bit misleading since a much smaller percentage of the population is actually working. Bureau of Labor Statistics Series LNS12300000.
Employment by Sector
The employment “bubble chart” gives us a good representation of how each sector of the economy is doing (employment wise).
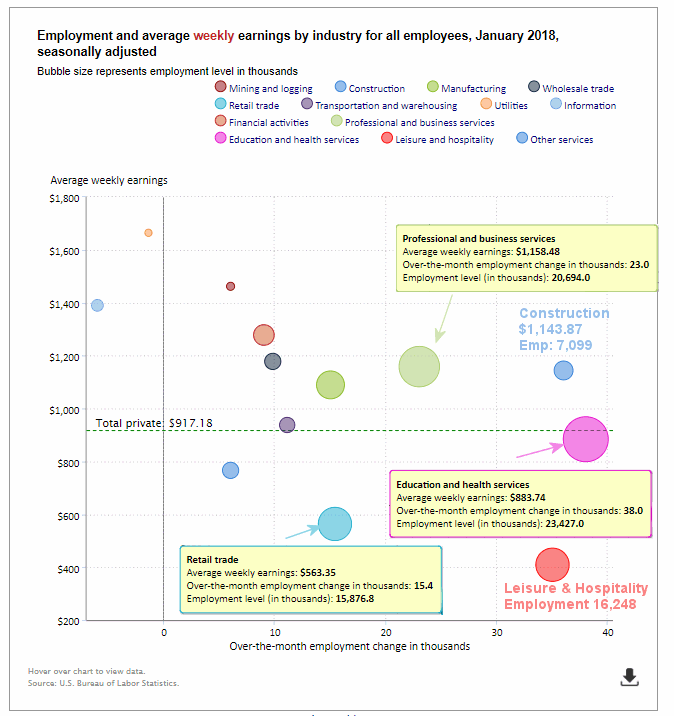
How to read this chart:
Bubbles location on the chart tell us two things:
- Change in Employment Levels over the most recent month.
- Average Weekly earnings.
Bubble Location tells us:
- The further to the right the bubble the larger the increase in the number of jobs.
- The higher up on the chart the larger the average salary.
Employment and Average Weekly Earnings by Industry for All Employees
January 2018, Seasonally Adjusted
| Industry | Monthly Increase | Average Weekly Earnings | Employment Level |
| Total Private Employment | 196,000 | $917.18 | 125,482,000 |
| Mining and Logging | 6,000 | $1,462.22 | 704,000 |
| Construction | 36,000 | $1,143.87 | 7,099,000 |
| Manufacturing | 15,000 | $1,089.30 | 12,555,000 |
| Wholesale trade | 9,800 | $1,178.19 | 5,953,200 |
| Retail trade | 15,400 | $563.35 | 15,876,800 |
| Transportation and Warehousing | 11,100 | $937.59 | 5,250,200 |
| Utilities | -1.400 | $1,664.69 | 553,200 |
| Information | -6000 | $1,390.16 | 2,773,000 |
| Financial Activities | 9000 | $1,278.02 | 8,518,000 |
| Professional and Business Services | 23,000 | $1,158.48 | 20,694,000 |
| Education and Health Services | 38,000 | $883.74 | 23,427,000 |
| Leisure and Hospitality | 35,000 | $408.98 | 16,248,000 |
| Other Services | 6,000 | $765.98 | 5,831,000 |
Labor Force Participation Rate
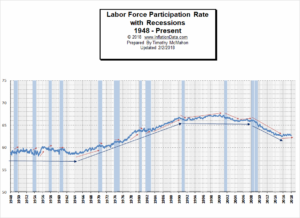 You might be wondering if recessions have any effect on the LFPR. It might make sense that the LFPR would fall during a recession. In the chart to the left we can see both LFPR vs. Recessions. And the results were a bit surprising. The red arrows indicate short term trends and the blue arrows indicate longer term trends.
See Labor Force Participation Rate for more information.
For more information See:
- Article: Employment vs. Unemployment how do they compare?
- Historical Employment Data Chart
- Current Unemployment Rate Chart
- Current Employment vs Unemployment Chart Are they really “two sides of the same coin”?
- What is U-6 Unemployment?
- The Misery index measures inflation plus unemployment and is a good measure of the discomfort of the country’s population.
- More Unemployment and Employment Charts