
The U.S. Bureau of Labor Statistics (BLS) released its August employment / unemployment report on September 4th, 2026.
Employment / Unemployment
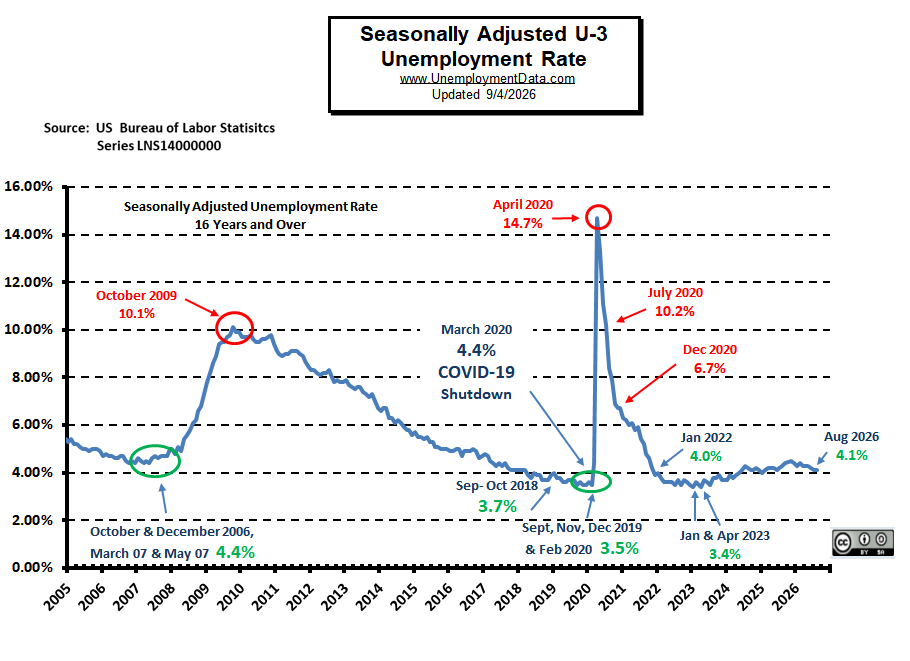
- Seasonally Adjusted U-3 is 4.1% Unchanged
- Unadjusted U-3 is 4.3% down from 4.4%
- Unadjusted U-6 is 7.8% down from 8.3%
- Labor Force Participation is 61.6% up from 61.4%
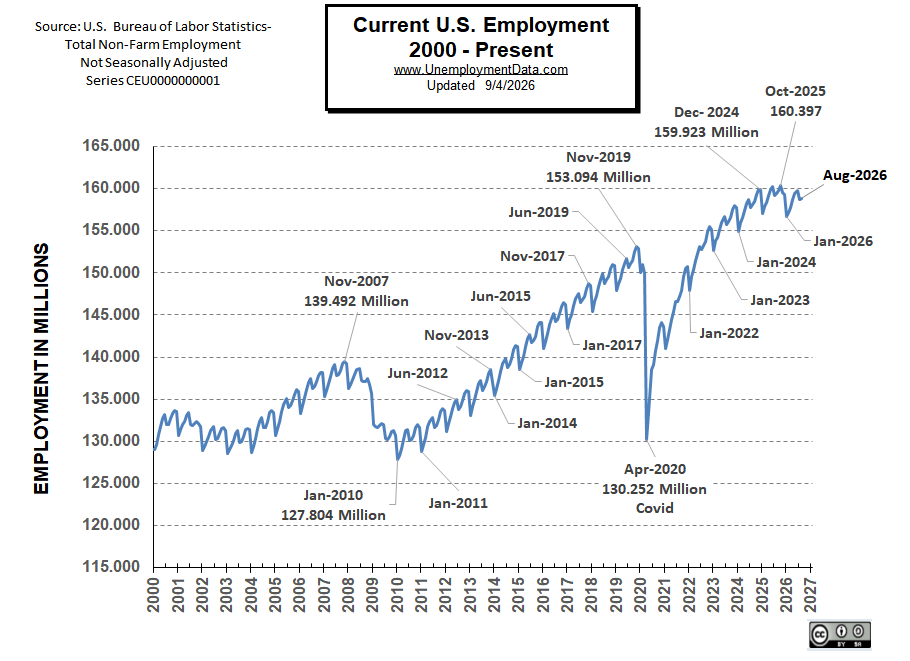
- Unadjusted Employment rose from 158.726 million to 158.880 million
- Next Update: October 2nd, 2026
Summary:
The Adjusted U-3 was unchanged for the month, but UNADJUSTED Employment was Down slightly.
According to the BLS Commissioner’s report:
“Total nonfarm payroll employment increased by 162,000 in August, and the unemployment rate was unchanged at 4.1 percent, the U.S. Bureau of Labor Statistics reported today. Employment increased in food services and drinking places and in local government education. The information industry lost jobs…
…education added 42,000 jobs in August, largely offsetting a decrease in the prior month… employment in manufacturing continued its upward trend (+16,000)… The change in total nonfarm payroll employment for June was revised up by 11,000, from +20,000 to +31,000, and the change for July was revised up by 44,000, from -23,000 to +21,000. With these revisions, employment in June and July combined is 55,000 higher than previously reported.“
As usual, they are talking about “Seasonally Adjusted Jobs”.
Looking at the Unadjusted Establishment Survey report, we see…
The BLS is currently reporting a rise from 158.726 million to 158.880 million, or 157,000. But last month they reported employment was 158.649 million, so it actually rose from 158.649 to 158.880 million, or 231,000.
Current Unemployment Rate Chart
 Current Employment Chart
BLS: Employment by Sector
The BLS employment “bubble chart” based on the Establishment Survey Data gives us a good picture of the Seasonally-adjusted employment numbers.
The Bubble’s Size tells us the total Employment for that industry (i.e., larger bubbles mean more people are employed in that sector).
The bubble’s location on the chart tells us that there has been a change in Employment Levels over the most recent month… A bubble further to the right indicates larger job growth. A bubble’s vertical location on the chart shows the average industry salary.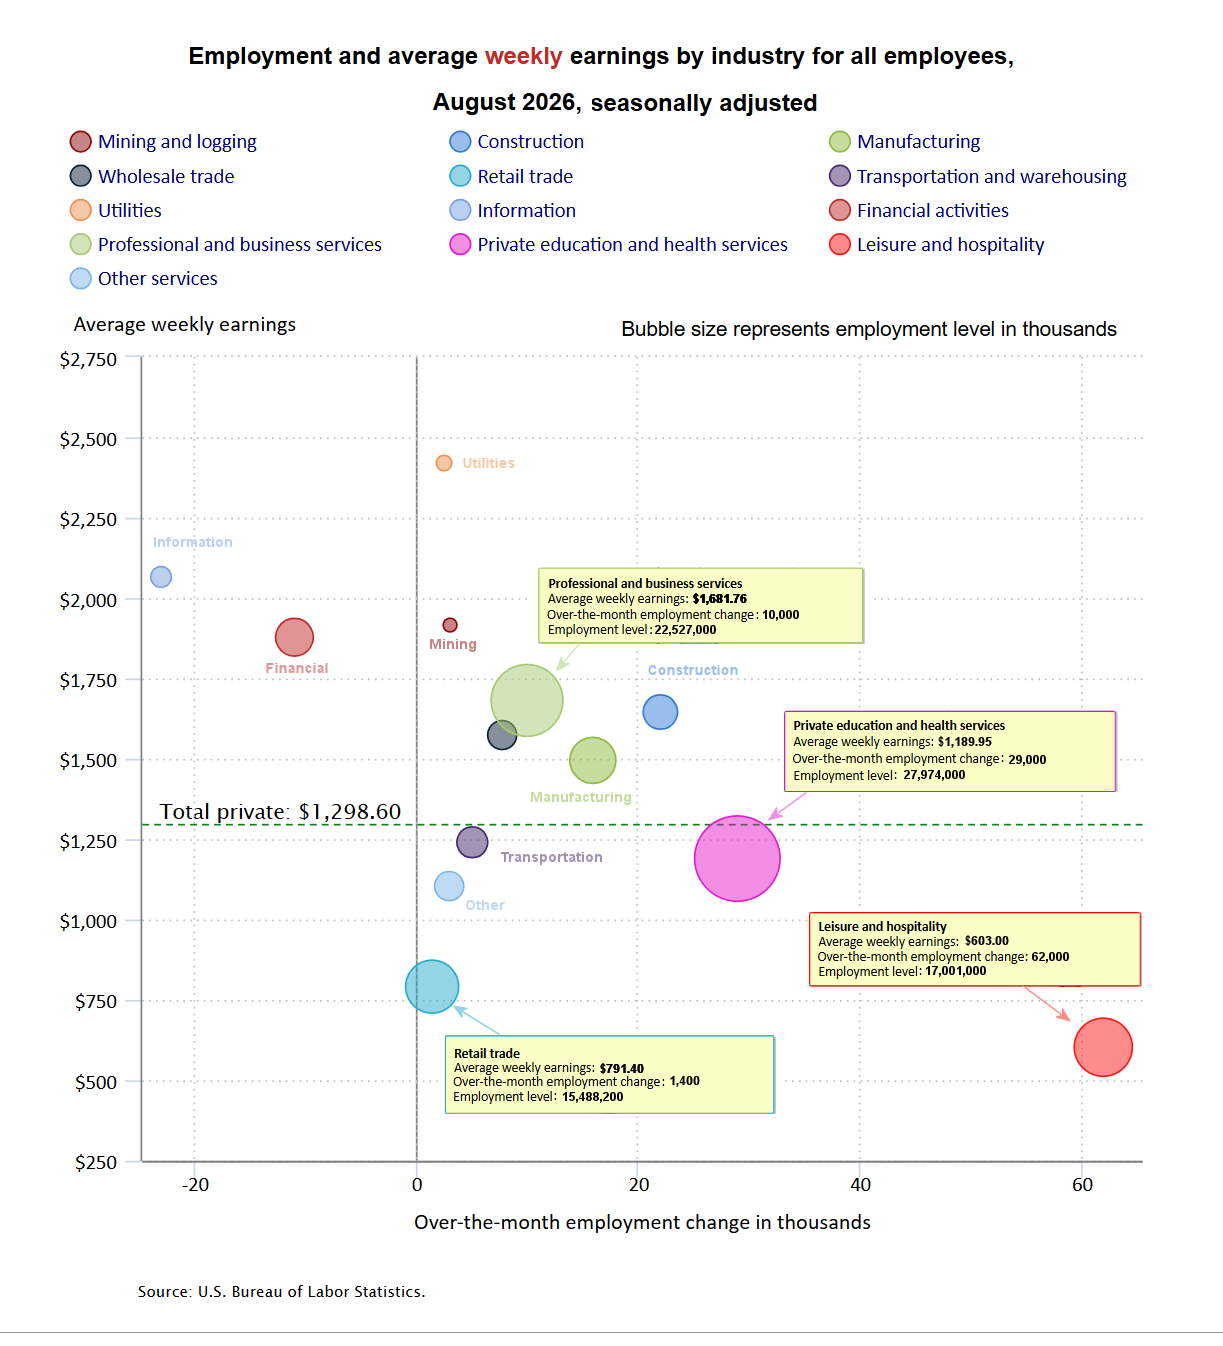 Looking at the chart above, two sectors actually lost jobs in August: Information (-23,000) and Financial Activities (-11,000). That’s a little hard to ignore when the overall job market was still adding jobs.
The Information sector continues to feel the effects of restructuring, automation, and cost-cutting across tech, media, and telecommunications. Some of this is related to efficiency improvements due to AI, and some firms use AI to justify cuts actually caused by previous overhiring.
Companies in tech, media, and telecom are tending to cut roles that generative AI can now perform such as: customer service, content creation/editing, data entry, basic coding, and some marketing operations.
Financial Activities is dealing with its own headache, as higher interest rates and slower lending and real estate activity have encouraged companies to trim their payrolls.
BLS Average Weekly Wages
| Date | Average Weekly Wage |
|---|---|
| August 2026 | $1,298.60 |
| July 2026 | $1,291.40 |
| June 2026 | $1,289.34 |
| May 2026 | $1,285.91 |
| April 2026 | $1,283.16 |
| March 2026 | $1,277.37 |
| February 2026 | $1,278.36 |
| January 2026 | $1,274.25 |
| December 2025 | $1,266.08 |
| November 2025 | $1,269.10 |
| October 2025 | $1,260.27 |
| September 2025 | $1,255.14 |
| August 2025 | $1,252.40 |
| July 2025 | $1,247.27 |
| June 2025 | $1,243.51 |
| May 2025 | $1,240.78 |
| April 2025 | $1,238.92 |
| March 2025 | $1,234.96 |
| February 2025 | $1,229.15 |
| January 2025 | $1,222.14 |
| December 2024 | $1,224.17 |
| November 2024 | $1,221.08 |
| October 2024 | $1,212.73 |
| September 2024 | $1,212.16 |
| August 2024 | $1,208.05 |
| July 2024 | $1,199.74 |
| June 2024 | $1,200.84 |
| May 2024 | $1,196.73 |
| April 2024 | $1,188.79 |
| March 2024 | $1,191.96 |
| February 2024 | $1,187.49 |
| January 2024 | $1,178.87 |
| December 2023 | $1,179.58 |
| November 2023 | $1,175.45 |
| October 2023 | $1,168.94 |
| September 2023 | $1,169.94 |
| August 2023 | $1,165.82 |
| July 2023 | $1,161.06 |
| June 2023 | $1,158.94 |
| May 2023 | $1,152.40 |
| April 2023 | $1,149.99 |
| March 2023 | $1,144.49 |
| February 2023 | $1,143.68 |
| January 2023 | $1,142.49 |
| December 2022 | $1,133.14 |
| November 2022 | $1,132.29 |
| October 2022 | $1,131.42 |
| September 2022 | $1,126.92 |
| August 2022 | $1,119.18 |
| July 2022 | $1,118.96 |
| June 2022 | $1,113.77 |
| May 2022 | $1,110.66 |
| April 2022 | $1,105.82 |
| March 2022 | $1,103.46 |
| February 2022 | $1,097.91 |
| January 2022 | $1,090.20 |
| December 2021 | $1,095.51 |
| November 2021 | $1,086.80 |
| October 2021 | $1,080.56 |
| September 2021 | $1,078.10 |
| August 2021 | $1,071.14 |
| July 2021 | $1,066.97 |
| June 2021 | $1,062.79 |
| May 2021 | $1,061.31 |
| April 2021 | $1,054.68 |
| March 2021 | $1,048.05 |
| February 2021 | $1,039.73 |
| January 2021 | $1,047.55 |
| December 2020 | $1,040.87 |
| November 2020 | $1,031.47 |
| October 2020 | $1,027.99 |
| September 2020 | $1,026.95 |
| August 2020 | $1,023.30 |
| July 2020 | $1,016.89 |
| June 2020 | $1,016.55 |
| May 2020 | $1,031.28 |
| April 2020 | $1,027.37 |
| March 2020 | $979.69 |
| February 2020 | $978.92 |
| January 2020 | $975.15 |
BLS Employment Levels by Industry
August 2026, Seasonally Adjusted Employment
Remember, these are Seasonally Adjusted Numbers, so they aren’t cumulative!
| Industry | Monthly Increase | Ave. Weekly Earnings | August Employment Level | July Employment Level |
|---|---|---|---|---|
| Total private | 127,000 | $1,298.60 | 135,752,000 | 135,588,000 |
| Mining and logging | 3,000 | $1,916.20 | 609,000 | 607,000 |
| Construction | 22,000 | $1,645.57 | 8,359,000 | 8,343,000 |
| Manufacturing | 16,000 | $1,495.26 | 12,638,000 | 12,611,000 |
| Retail trade | 1,400 | $791.40 | 15,488,200 | 15,440,900 |
| Transportation and warehousing | 5,000 | $1,240.47 | 6,606,300 | 6,596,100 |
| Utilities | 2,500 | $2,420.04 | 611,700 | 608,100 |
| Information | -23,000 | $2,065.72 | 2,745,000 | 2,780,000 |
| Financial activities | -11,000 | $1,878.21 | 9,086,000 | 9,090,000 |
| Professional and business services | 10,000 | $1,681.76 | 22,527,000 | 22,518,000 |
| Private education and health services | 29,000 | $1,189.95 | 27,974,000 | 27,962,000 |
| Leisure and hospitality | 62,000 | $603.00 | 17,001,000 | 16,931,000 |
| Other services | 3,000 | $1,104.34 | 6,035,000 | 6,038,000 |
Source: BLS
ADP® National Employment Report
ADP provides an independent (non-government) estimate of private-sector employment and pay, based on data derived from ADP client payrolls. According to ADP®, In collaboration with Stanford Digital Economy Lab.
ADP: Private employers added 38,000 jobs in August
- Private employers posted their slowest pace of job creation since January. Manufacturing, professional services, and information shed jobs. Education and health care, construction, and leisure and hospitality all showed solid hiring.
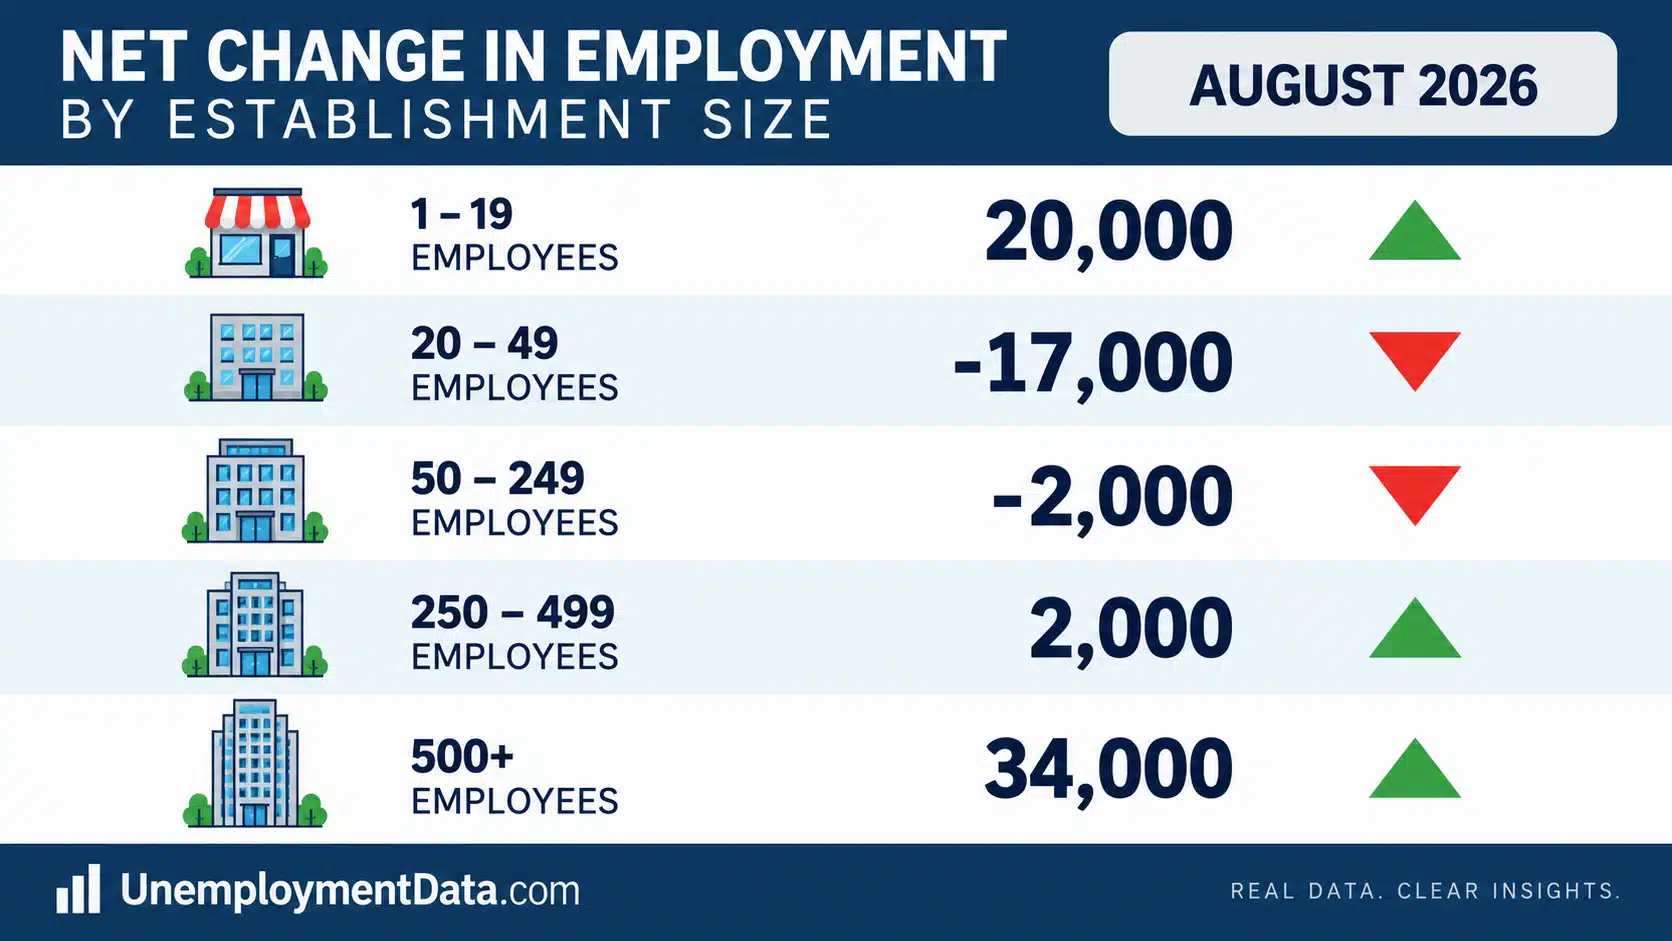
ADP Private Employment by Establishment Size
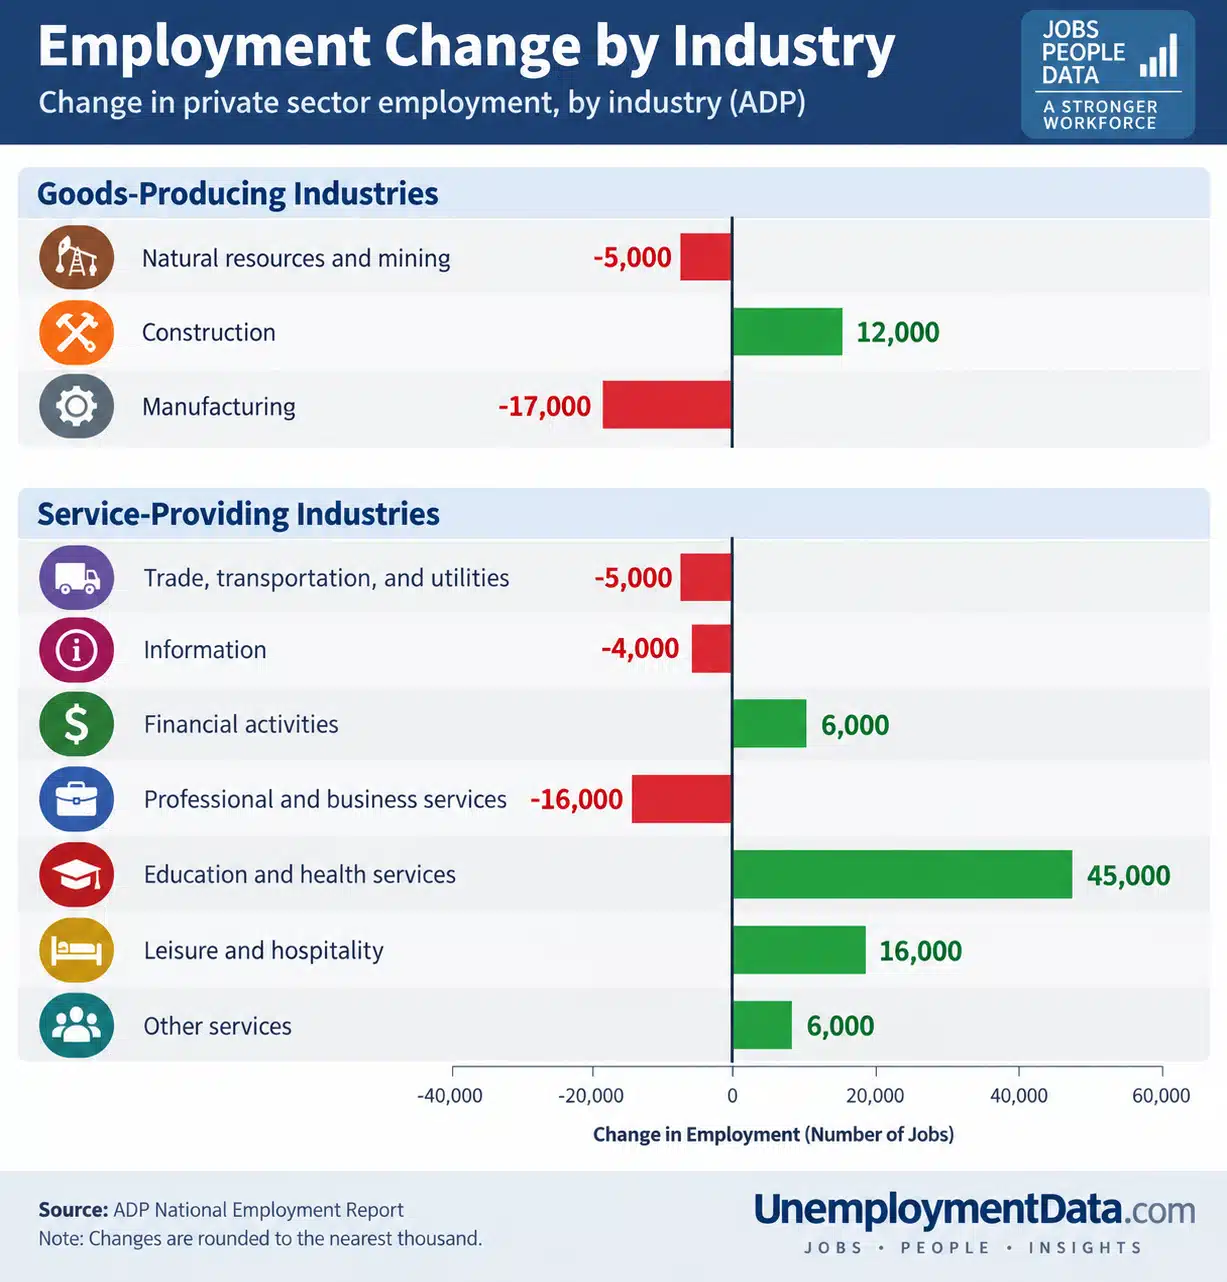
ADP Job Gainers / Losers
When broken down further into individual industries, we see that once again, Education and Health were the biggest gainers.
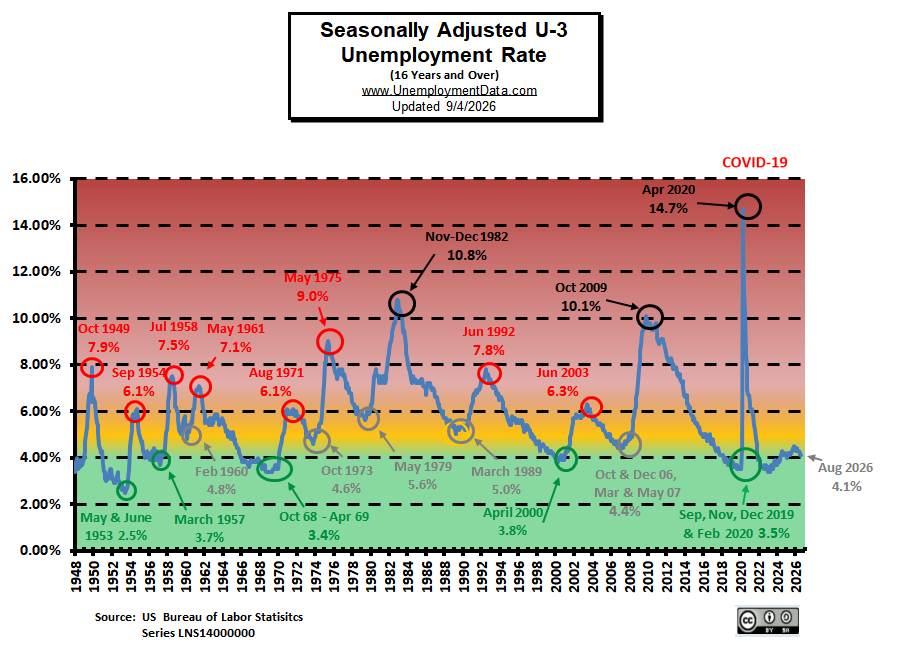
Seasonally Adjusted Unemployment Rate Chart 1948-Present
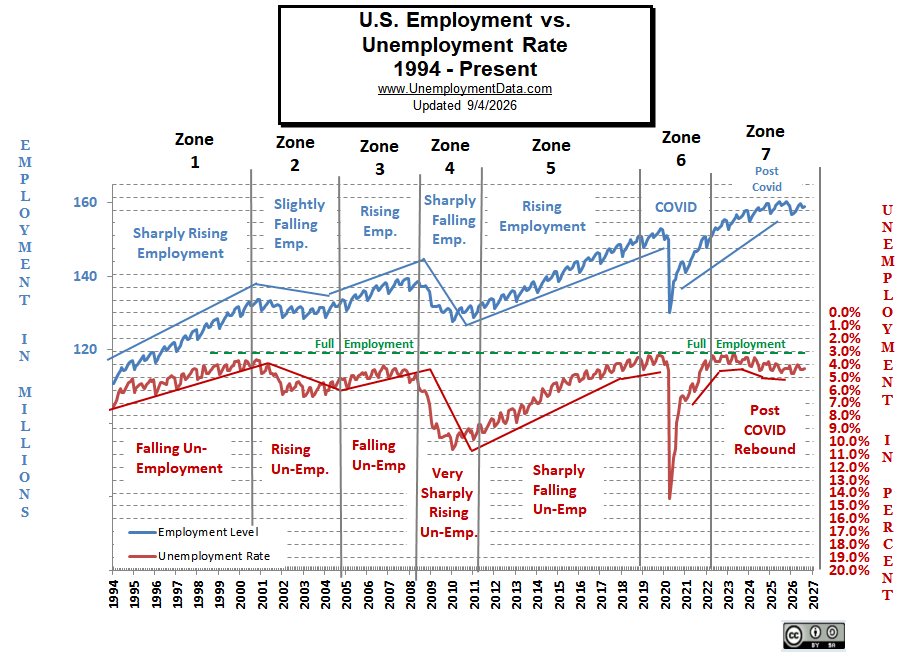
Less Than Full Employment
This chart compares employment levels with the (inverted) unemployment rate.
Full Employment is when everyone who wants a job has one. It is generally considered to be around 3%. The chart allows us to easily see how far from “full employment” we are.
Note: Full employment is not considered to be at zero percent because even when employers are having difficulty finding employees, some people are still unemployed due to either:
- Structural unemployment (mismatch between worker skills and job requirements, i.e., not enough training) or
- Frictional unemployment. There will always be people who have quit or have lost a seasonal job and are in the process of getting a new job.
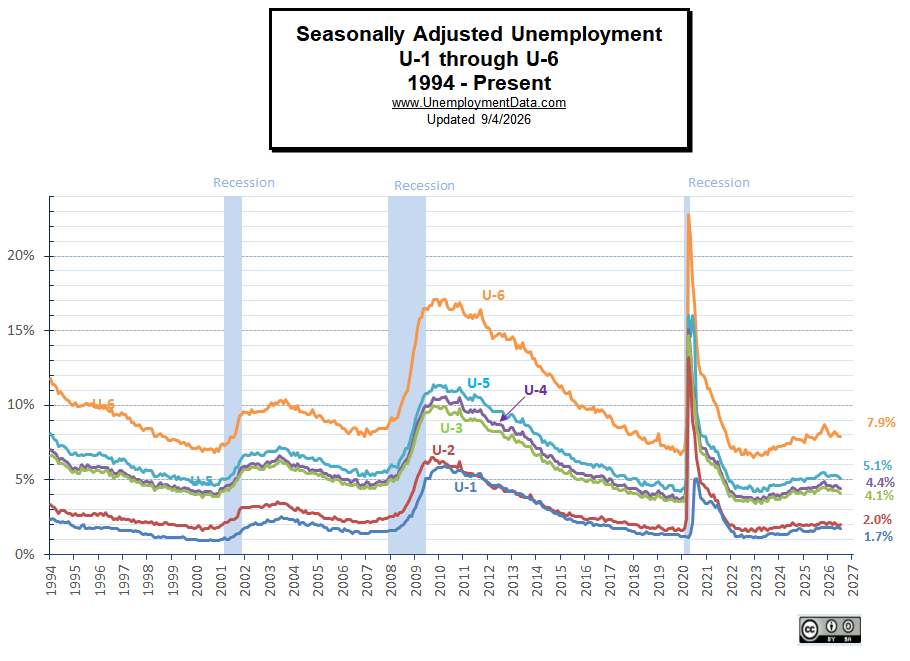
Seasonally Adjusted U1 through U6 Unemployment Rates
Labor Force Participation Rate
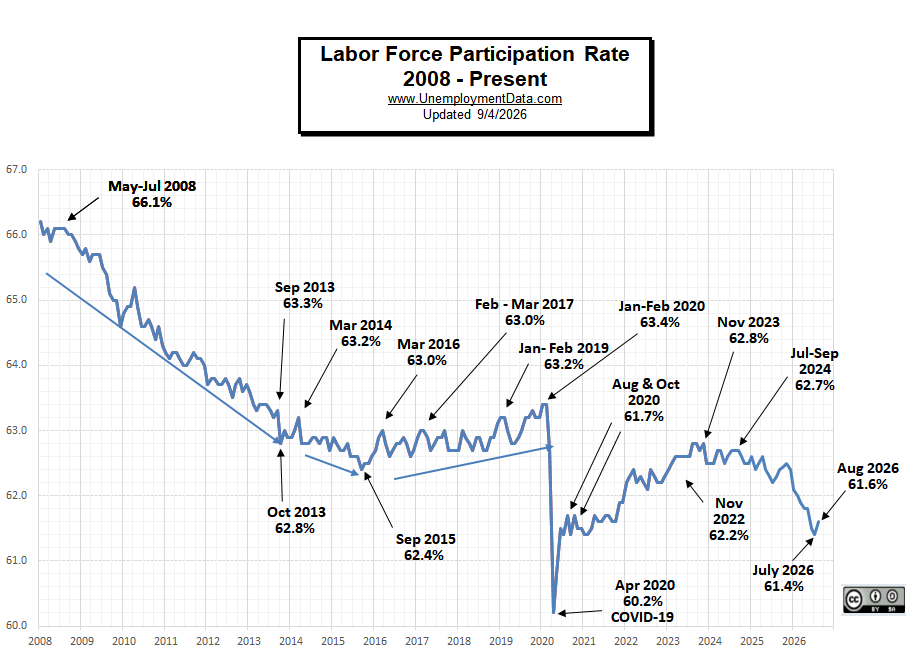
The Labor Force Participation Rate is the percentage of the Non-Institutional Population that makes up the Labor Force.
And the Employment – Population Ratio is the percentage of the Total Population that is Employed.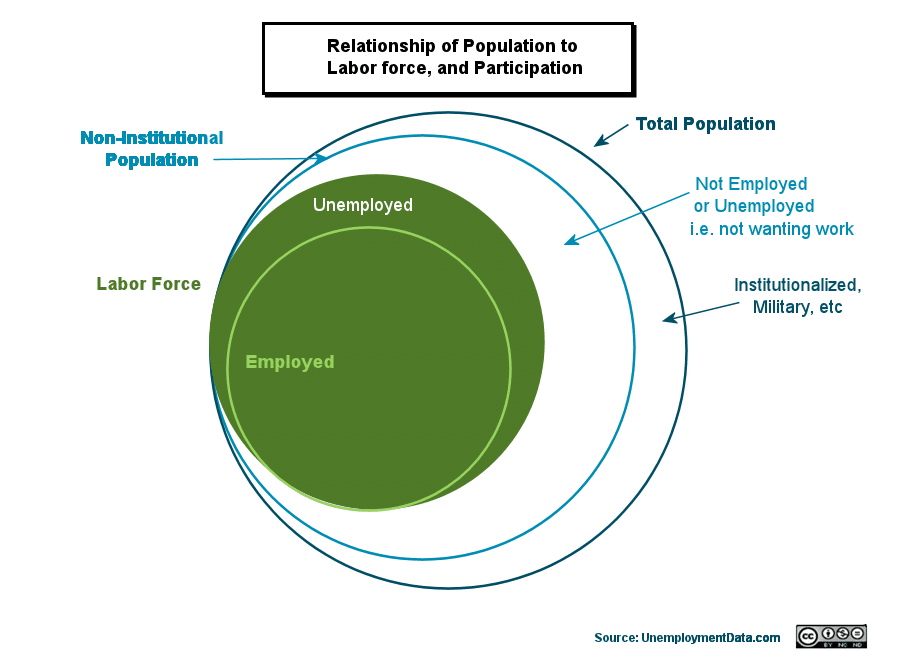
Employment-Population Ratio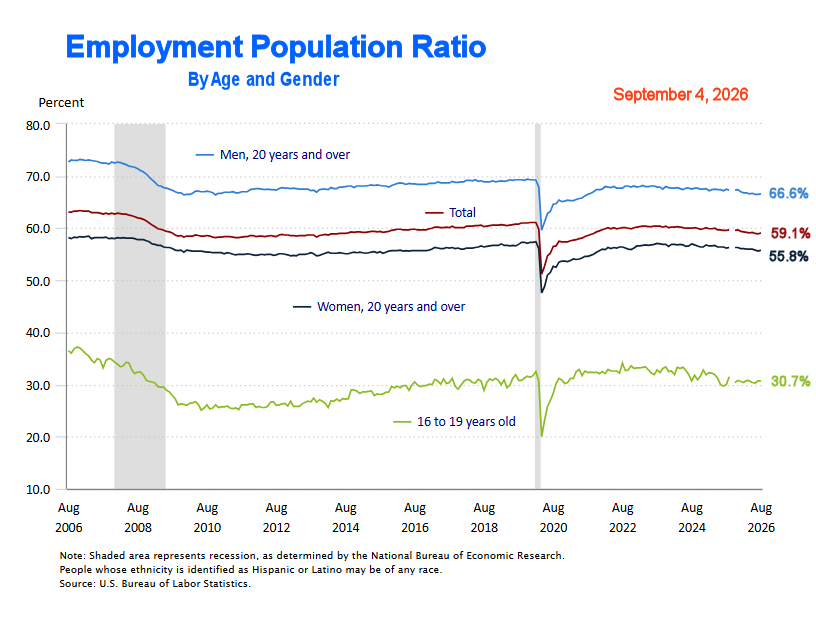
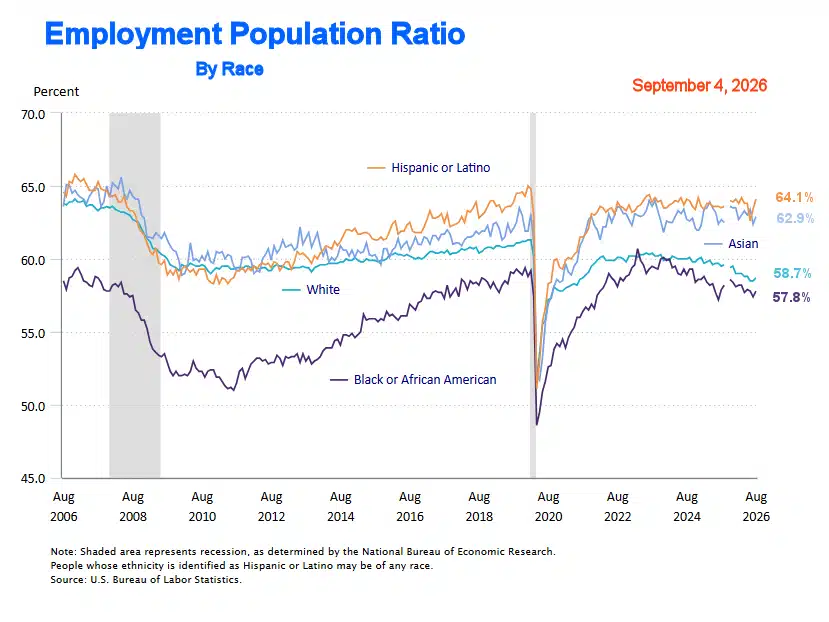
Employment-Population Ratio by Race
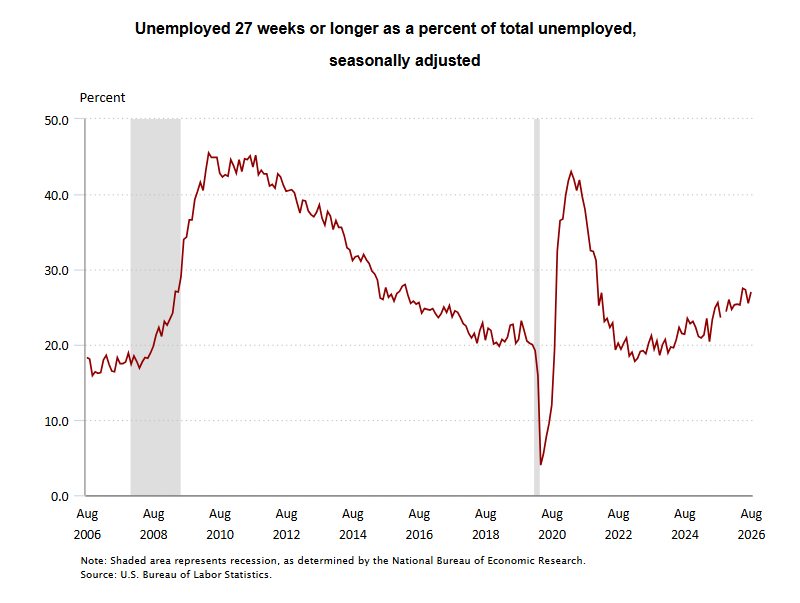
Percent Unemployed 27 weeks or Longer
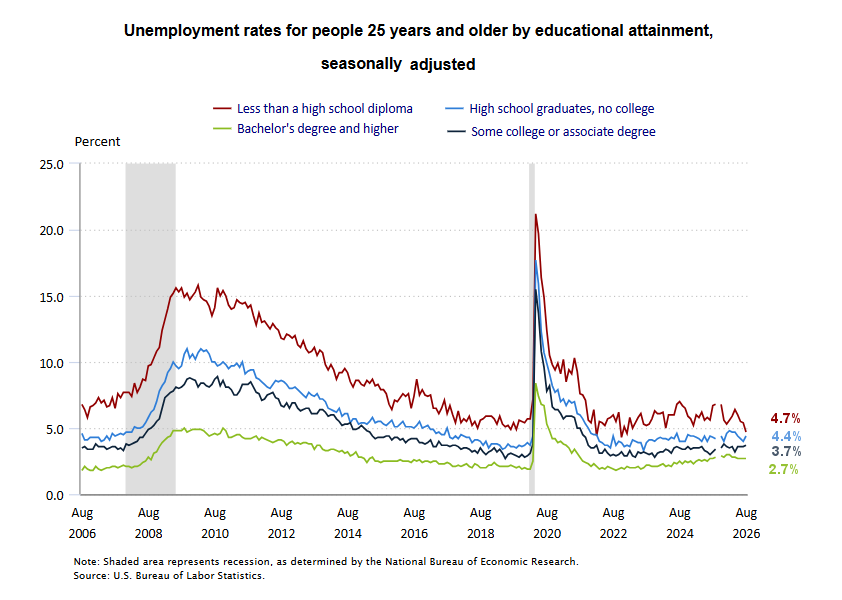
Unemployment by Education
There are a couple of interesting things to note this month.
1. The falling unemployment rate for the uneducated, i.e., less than a High School diploma, perhaps because of the mass deportations of illegals who were previously taking those jobs?
2. The rise in the unemployment rate of those with only a High School diploma, as AI replaces their jobs.
Read more on UnemploymentData.com.
- Inflation vs Unemployment Challenge FED’s Resolve
- Does Raising The Minimum Wage Make A Substantial Difference?
- Would More Jobs Help Social Security?
From InflationData.com
From Financial Trend Forecaster
- Moore Inflation Predictor
- NYSE ROC
- NASDAQ ROC
- ETH and BTC Buy Signal
- AI Is Long-Term Deflationary But Its Energy Demand Could Fuel Inflation
- Can Scott Bessent Stop a Bond Market Debt Spiral?
- Nvidia’s $500 Billion AI Financing Strategy Could Reshape the AI Industry
- We May Already Be Living in the Singularity
- Fed Holds Rates Again, But Three Officials Wanted a Hike
- How Affordable Was the 1950s American Dream?
- What Is the K-Shaped Economy? Everything You Need to Know
- The Hidden Cost of “Free” Healthcare and College in Scandinavia
From OptioMoney

Leave a Reply