
The U.S. Bureau of Labor Statistics (BLS) released its employment / unemployment report for May on June 7th, 2024.
Employment / Unemployment
![]()
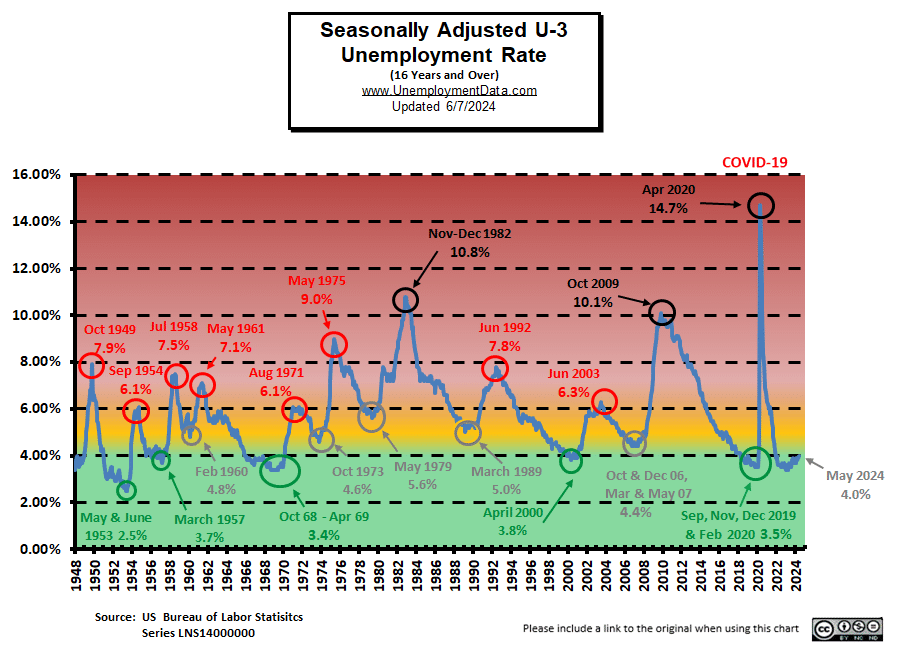
- Seasonally Adjusted U-3 was 4.0% up from 3.9% in April
- Unadjusted U-3 was 3.7% up from 3.5% in April
- Unadjusted U-6 was 7.1% up from 6.9% in April
- Labor Force Participation was 62.5% down from 62.7%
- Unadjusted Employment rose from 158.001 million to 158.918 million
- Next data release July 5th 2024
Summary:
Total Employed increased in May, but Unemployment was also up.
According to the Commissioner of the U.S. Bureau of Labor Statistics:
“Total nonfarm payroll employment increased by 272,000 in May, and the unemployment rate changed little at 4.0 percent, the U.S. Bureau of Labor Statistics reported today. Employment continued to trend up in several industries, led by health care; government; leisure and hospitality; and professional, scientific, and technical services.
Both the unemployment rate, at 4.0 percent, and the number of unemployed people, at 6.6 million, changed little in May. A year earlier, the jobless rate was 3.7 percent, and the number of unemployed people was 6.1 million.”
You can read the full BLS report here.
As usual, they are talking about “Seasonally Adjusted Jobs”.
Looking at the Unadjusted Establishment Survey report we see…
Originally the BLS reported employment of 158.016 million for April which they adjusted slightly to 158.001 million in May.
They are currently reporting 158.918 million jobs for May which is actually an increase of 902,000 jobs based on their original numbers or 917,000 based on their new numbers for April. The LFPR was down from 62.7% to 62.5%.
The LFPR was down from 62.7% to 62.5%.
Bad News for the Market
In the perverse stock market of these post-pandemic days, the market is looking for an excuse for the FED to cut interest rates so “Bad News is Good News” for the market.
BUT… This month was the opposite of last month, the “experts” were only expecting 190,000 new jobs but the BLS reported 272,000 new jobs. So the market fell on the “good news”. However, had they focused on the Adjusted U3 number itself (like they did last month) which rose from 3.9% to 4.0% the market would have risen. This is the same percentage increase as last month which went from 3.8% in March to 3.9% in April. But last month that increase triggered a buying spree.
And all those extra jobs that the market was worried about? 43,000 of them were new government jobs! Hardly the sign of a booming economy. Mr. Market may have been fooled by the ADP report (which is released 2 days before the BLS report) that showed only 152,000 new jobs based on actual payroll records that ADP processes.
So, the real numbers don’t really matter, as Bob Prechter of Elliottwave International says, all that matters is finding an excuse to do what the market wants to do anyway.
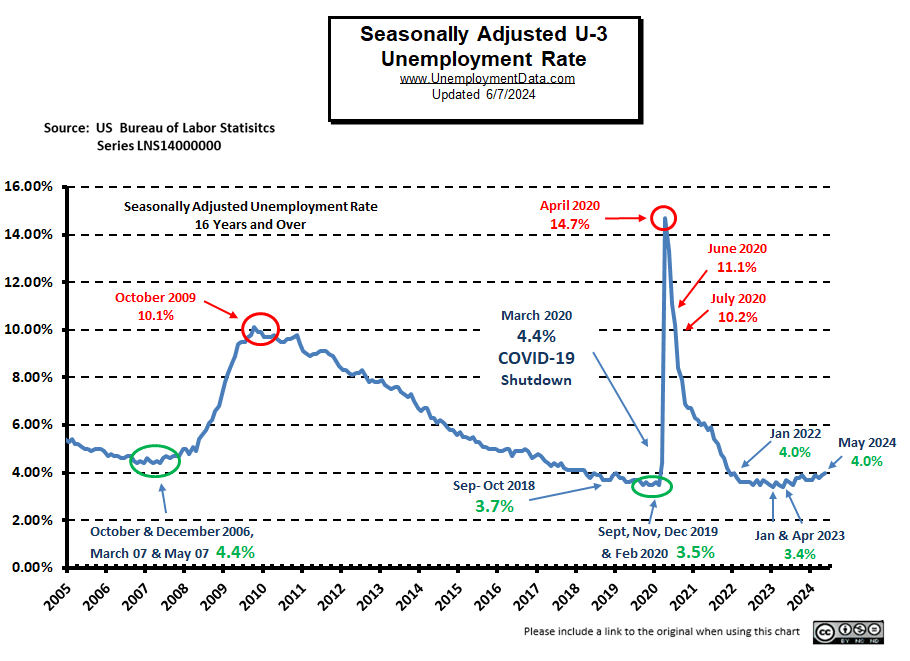
Current Unemployment Rate Chart
Seasonally Adjusted U3 Unemployment remains above the pre-COVID 2019 cyclical lows of 3.5%, as well as above the lows made early in 2023. The unemployment rate is inching back toward the yellow zone.
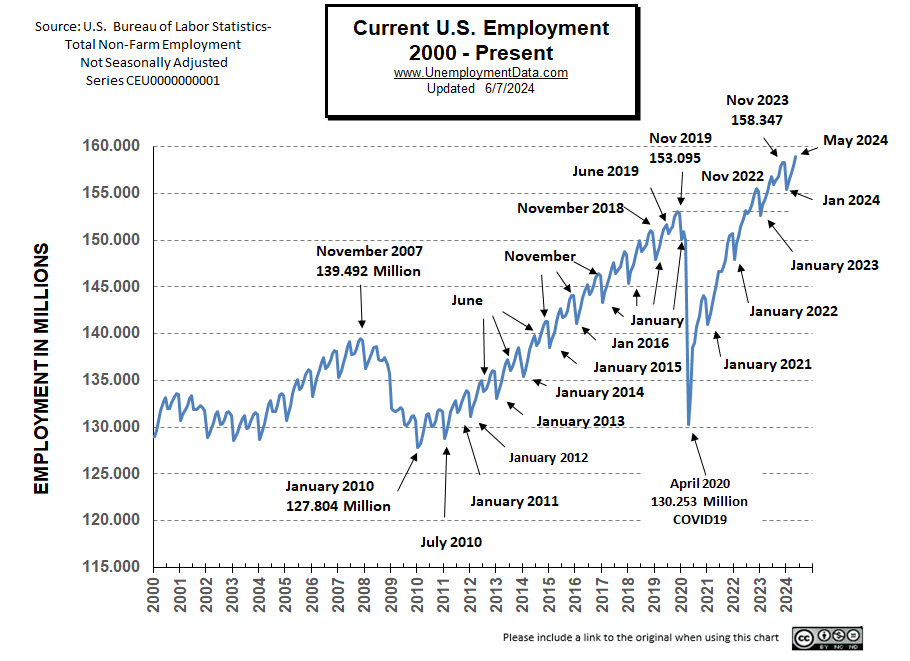
Current Employment Rate
Employment is Up from 158.001 million in April to 158.918 million in May Typically, the low point for each year occurs in January and then employment moves almost straight up to a small peak around June.
Employment is 2,786,000 Above Year-Ago Levels and 7.95 million above February 2020 (prior to the Covid Crash)
However, the Civilian Population has also increased by about 8.62 million since February 2020 (probably not counting the millions of illegal aliens that have come since then).
See Current Employment for more information.
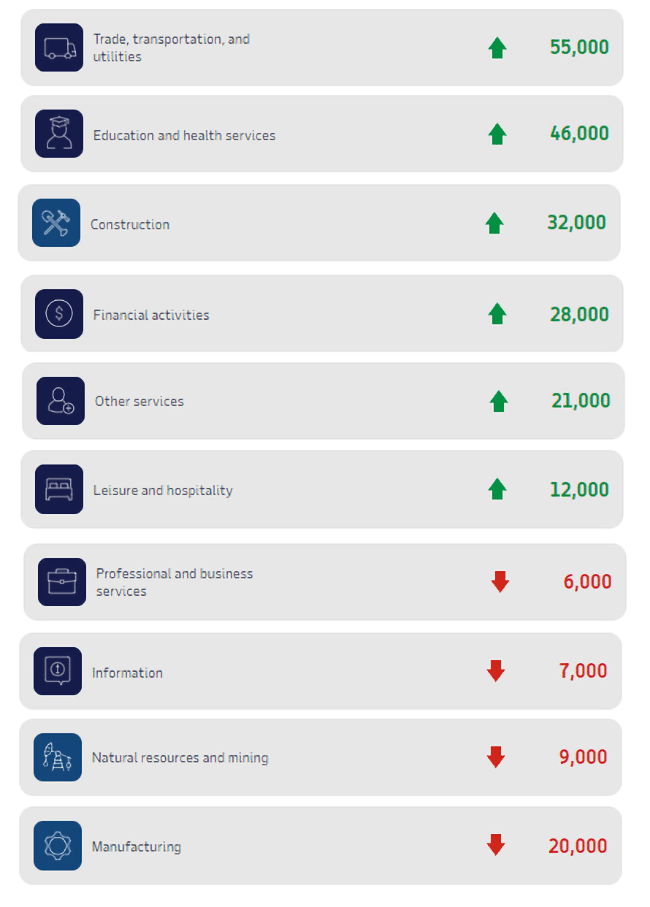
BLS: May 2024 Employment by Sector
The BLS employment “bubble chart” based on the Establishment Survey Data gives us a good picture of the Seasonally adjusted employment numbers.
The Bubble’s Size tells us the total Employment for that industry (i.e., larger bubbles mean more people are employed in that sector).
The bubble’s location on the chart tells us that there has been a change in Employment Levels over the most recent month… A bubble further to the right indicates larger job growth. A bubble’s vertical location on the chart shows the average industry salary.
Remember, these are Seasonally Adjusted Numbers, so they aren’t cumulative!
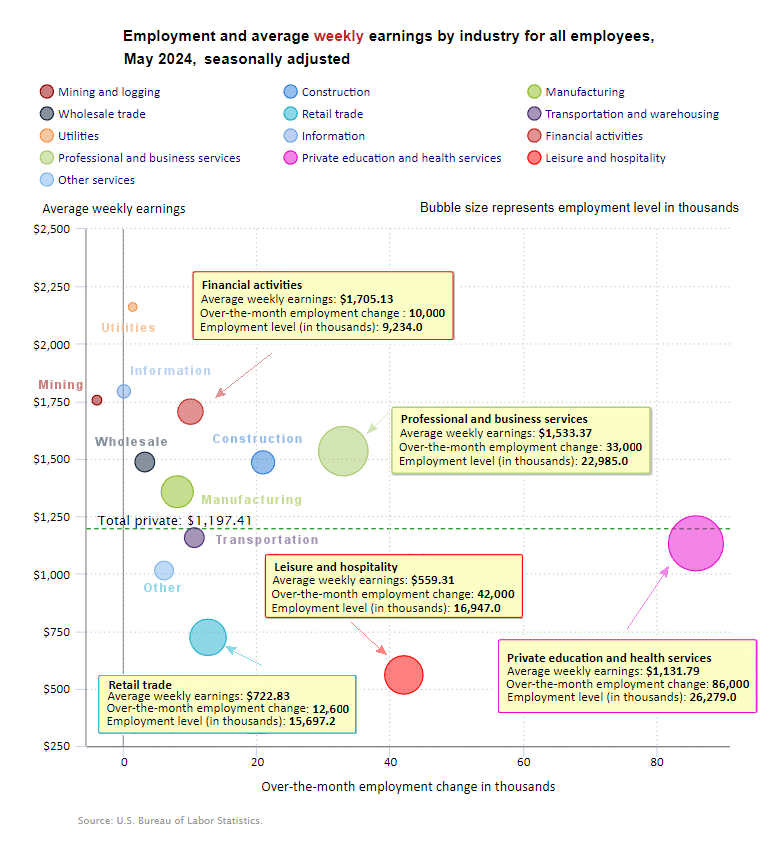
According to the BLS, Education and Health added 86,000 jobs in May compared to 95,000 jobs in April and similar gains in February and March. Leisure and Hospitality Services added 42,000 jobs and Retail added 12,600 jobs.
BLS Average Weekly Wages
| Date | Average Weekly Wage |
| May 2024 | $1,197.41 |
| April 2024 | $1,191.93 |
| March 2024 | $1,193.34 |
| February 2024 | $1,185.75 |
| January 2024 | $1,178.16 |
| December 2023 | $1,175.46 |
| November 2023 | $1,173.04 |
| October 2023 | $1,166.20 |
| September 2023 | $1,165.47 |
| August 2023 | $1,163.41 |
| July 2023 | $1,157.28 |
| June 2023 | $1,155.15 |
| May 2023 | $1,146.99 |
| April 2023 | $1,147.58 |
| March 2023 | $1,141.34 |
| February 2023 | $1,141.61 |
| January 2023 | $1,146.14 |
| December 2022 | $1,125.73 |
| November 2022 | $1,129.01 |
| October 2022 | $1,124.01 |
| September 2022 | $1,119.87 |
| August 2022 | $1,116.42 |
| July 2022 | $1,116.54 |
| June 2022 | $1,106.76 |
| May 2022 | $1,105.47 |
| April 2022 | $1,102.01 |
| December 2021 | $1,086.46 |
BLS Employment and Average Weekly Earnings by Industry
May 2024, Seasonally Adjusted Employment
Note that due to “seasonal adjusting,” although they may claim that there was a “monthly increase” (or decrease), there isn’t always an actual increase; you can’t just subtract last month’s “employment level” from this month’s level. For instance, Mining employment was supposed to have lost -4,000 jobs in May. But May had 633,000 and April had 641,000 which looks more like a -8,000 decrease. And Construction went from 8,219,000 in April to 8,228,000 which looks like a 9,000 job increase but due to adjusting it is a 21,000 increase.
| Industry | Monthly Increase | May Ave. Weekly Earnings | May Employment Level | Apr. Employment Level |
| Total Private Employment | 229000 | $1,197.41 | 135,224,000 | 135,015,000 |
| Mining and Logging | -4,000 | $1,755.17 | 633,000 | 641,000 |
| Construction | 21,000 | $1,484.34 | 8,228,000 | 8,219,000 |
| Manufacturing | 8,000 | $1,356.58 | 12,965,000 | 12,961,000 |
| Wholesale trade | 3,100 | $1,485.93 | 6,163,400 | 6,169,700 |
| Retail trade | 12,600 | $722.83 | 15,697,200 | 15,677,900 |
| Transportation and Warehousing | 10,600 | $1,156.68 | 6,583,500 | 6,575,800 |
| Utilities | 1,300 | $2,160.68 | 588,200 | 587,400 |
| Information | 0 | $1,793.58 | 3,014,000 | 3,013,000 |
| Financial Activities | 10,000 | $1,705.13 | 9,234,000 | 9,233,000 |
| Professional and Business Services | 33,000 | $1,533.37 | 22,985,000 | 22,942,000 |
| Private Education and Health Services | 86,000 | $1,131.79 | 26,279,000 | 26,194,000 |
| Leisure and Hospitality | 42,000 | $559.31 | 16,947,000 | 16,897,000 |
| Other Services | 6,000 | $1,013.57 | 5,907,000 | 5,904,000 |
Source: BLS
ADP® National Employment Report
ADP provides an independent (non-government) estimate of private-sector employment and pay, based on data derived from ADP client payrolls. According to ADP®, In collaboration with Stanford Digital Economy Lab.
ADP: Private employers added 152,000 jobs in May
- Job gains were slower in May due to a steep decline in manufacturing. Leisure and hospitality also showed weaker hiring.

Source: ADP®
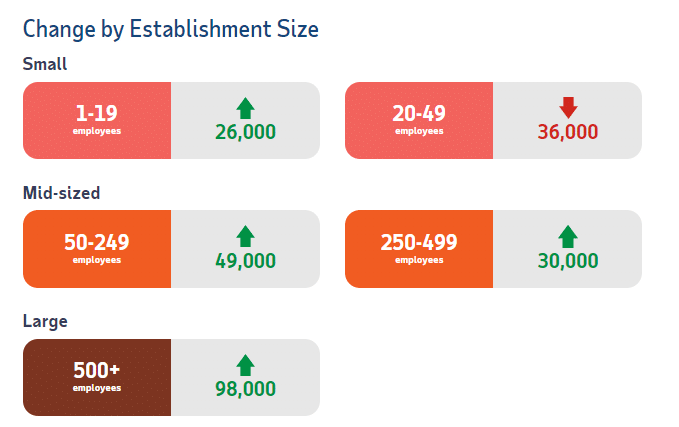
ADP Private Employment by Establishment Size
As we can see from the graphic below most establishment sizes had positive gains. The only sector that declined slightly were those establishments with 20-49 employees.
May ADP Changes:
ADP Job Gainers / Losers
ADP provides an entirely different picture of the job situation compared to the BLS perspective. For instance while the BLS says manufacturing gained 8,000 jobs, ADP says they lost 20,000 jobs. Last month ADP only had 1 category losing jobs this month there are four losers. And ADP’s total of 152,000 new jobs was much lower than the BLS’ 272,000 new jobs.
Unemployment
May’s Seasonally Adjusted Unemployment is up from 3.9% to 4.0%.
Labor Force Participation Rate
The LFPR is down from 62.7% to 62.5%.
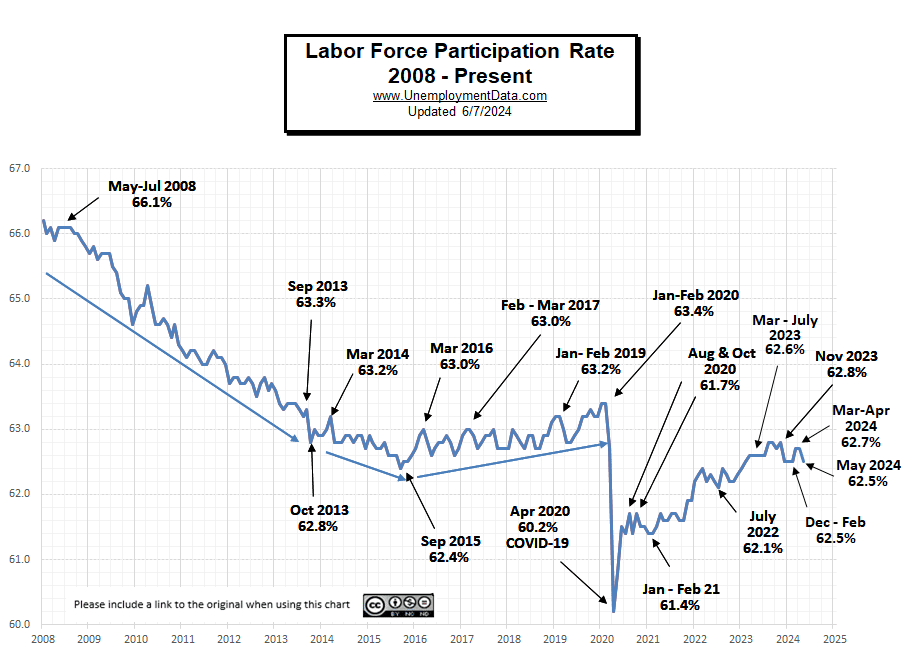 See Labor Force Participation Rate for more information.
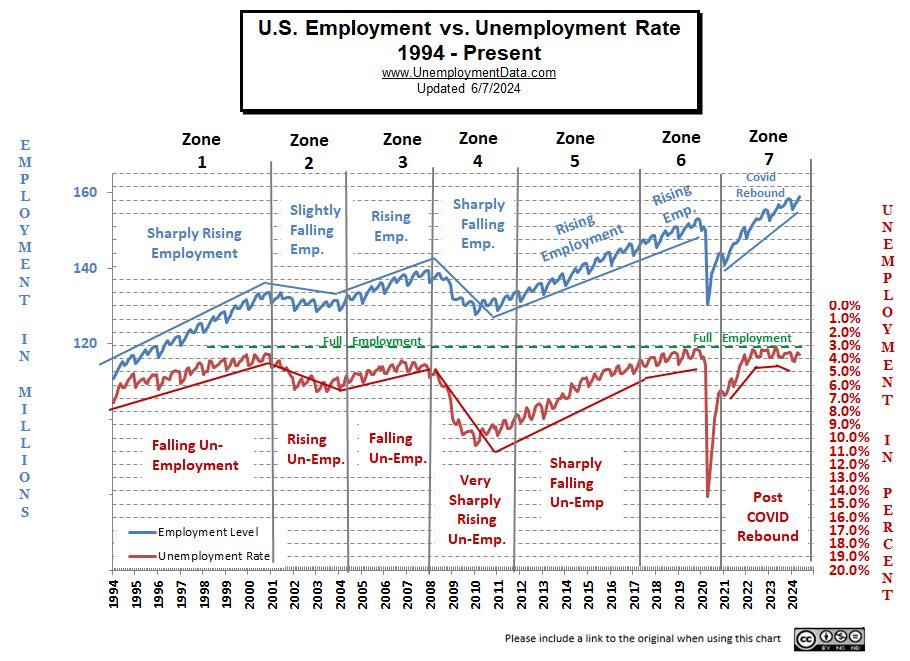
Near Full Employment
This chart compares employment levels with the (inverted) unemployment rate.
Full Employment is when everyone who wants a job has one. It is generally considered to be around 3%. After the unemployment rate almost touched the magic full employment line in April 2023, it began moving away (i.e., higher unemployment). This month on an unadjusted basis it got closer again.
Note: The Unemployment rate is inverted to track the employment rate. Neither is Seasonally Adjusted. For more information see Employment vs. Unemployment.
Note: Full employment is not considered to be at zero percent because even when employers are having difficulty finding employees, some people are still unemployed due to either:
- structural unemployment (mismatch between worker skills and job requirements, i.e., not enough training) or
- frictional unemployment There will always be people who have quit or have lost a seasonal job and are in the process of getting a new job. Or
- Simply because they quit their job knowing it would be easy to find another (hopefully better) job.
Seasonally Adjusted U1 through U6 Unemployment Rates
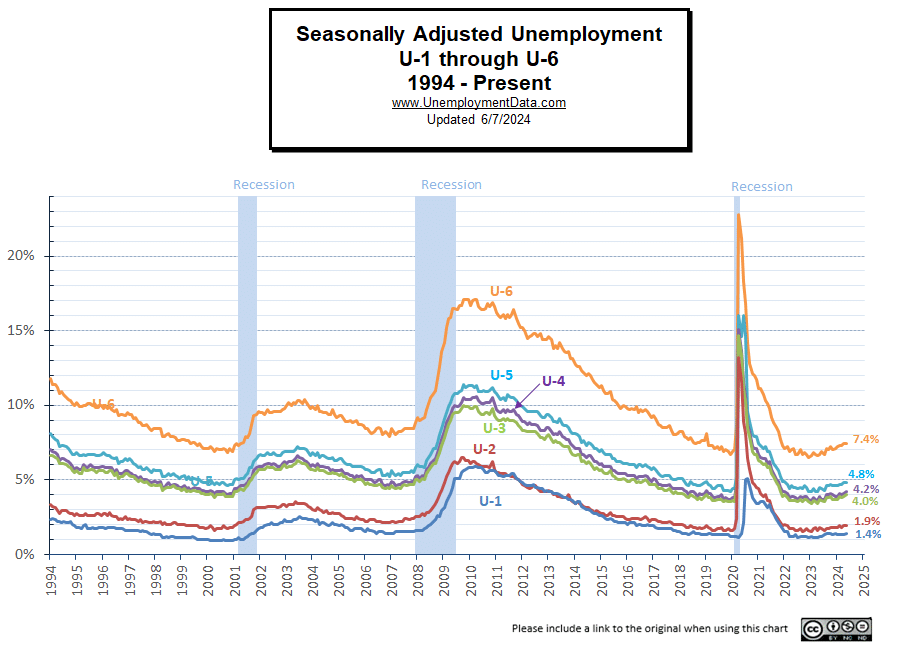 For more information about the various measurements of unemployment, see What Is U-6 Unemployment?
Seasonally Adjusted Unemployment by Education
This chart does refute the idea that getting a college education doesn’t help you find a job. Those with a 4 year degree have half the unemployment level than someone with only a High School diploma. But it doesn’t show whether they are “underemployed” i.e. working as a Barista at Starbucks or flipping burgers at McDonalds. And these numbers only apply to people over the age of 25 (so they have had some time to settle in).
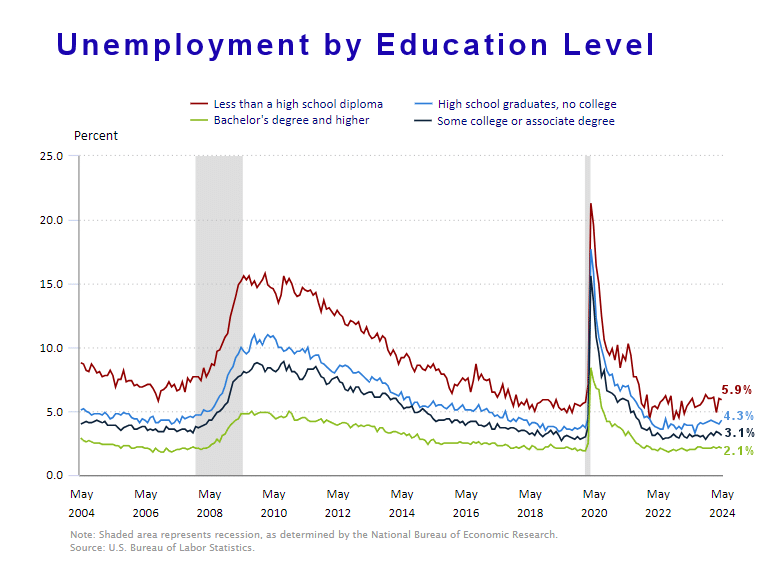
Source: BLS
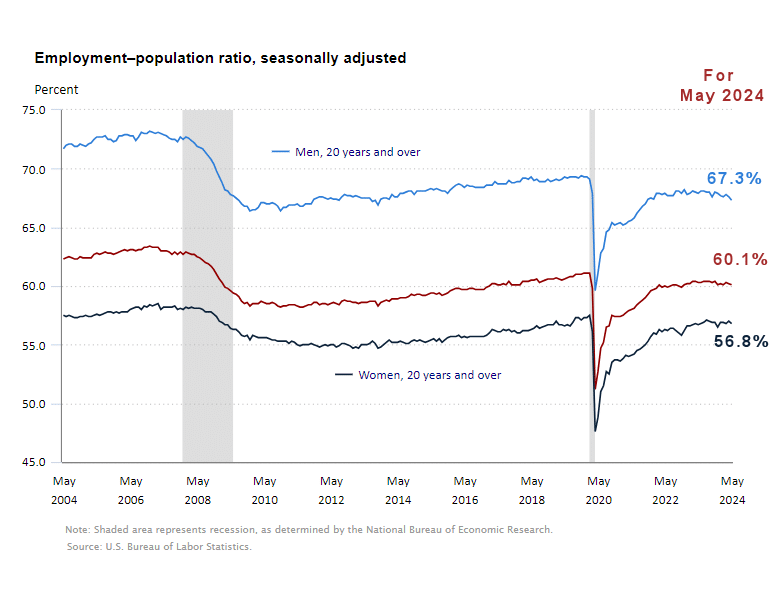
Employment-Population Ratio
This month we broke out the Employment-Population Ratio by gender. Showing that Men make up a much larger portion of the workforce, i.e., 67.3% of men are employed (compared to 67.6% last month) and only 56.8% of women are employed. But…
As you can see 20 years ago, back in April 2004, almost 72% of men were working and 57.4% of women were working. In 2008 the Great Recession caused a massive decline in employment for both men and women. By December of 2009, only 66.4% of men were working and 55.4% of women. Over the next decade, women workers rebounded to 57.5% but men only rebounded to 69.3%.
Now only 67.3% of men are working and 56.8% of women are working, so it isn’t women who have left the workforce but men. Perhaps there are more stay-at-home Dads? Or more men decided to retire in 2009 and 2020, rather than bother returning to the workforce.
 See Employment Population Ratio for more information.
Read more on UnemploymentData.com.
- The American Labor Market: Fact vs. Fiction
- Design Meets Security: Creating Safe and Attractive Commercial Entrances
- Unlocking The Value Of A “Career College” Degree In Today’s Economy
- April Unemployment- Bad News is Good News?
- The Challenges and Triumphs of Working in Emergency Care
From InflationData.com
- If Trump Won the 2020 Election Would Inflation Be Lower?
- How Social Security Tax and Inflation Affect Couples’ Retirement
- Inflation Destroys More Than Money
- How Inflation Is Reshaping the Job Market for New Entrants
- April Inflation Sparks Market
From Financial Trend Forecaster
- Moore Inflation Predictor
- NYSE ROC
- NASDAQ ROC
- The Tectonic Shift in Crypto
- Crypto Goes Mainstream
- Applying the ROC to Crypto
- Economic Education Has Become Economic Disinformation
- The Modern Day Wild West: Crypto Scams And Opportunities
From Elliott Wave University
- Why You Should Pay Attention to This Time-Tested Indicator Now
- Gold: Setting Near-Term Price Targets
- Bob Prechter on the Rich Dad Radio Show
- A.I. Revolution and NVDA: Why Tough Going May Be Ahead
- Free report: ‘Gold Investors’ Survival Guide’
From OptioMoney
- How Moving to a New Place Impacts Your Spending Patterns
- The “Ins and Outs” of Energy Efficient Windows
- How to Effectively Manage Credit Cards as a Homeowner
- What are “Moving Loans” and Do You Need One?
- Navigating Currency Exchange: Maximizing Your Money When Moving Abroad
From Your Family Finances
- What is Identity Theft and How to Protect Yourself
- Smart Spending for Your Roof: Navigating Costs and Options
- 10 Reasons Millennials Should Start Investing in Real Estate
- Finding Your Way: Navigating Insurance Coverage For Flood Recovery
- Navigating a Money Pit: Financial Survival Guide for Moving into a Fixer-Upper