
The U.S. Bureau of Labor Statistics (BLS) released its employment / unemployment report for August on September 2nd.
![]()
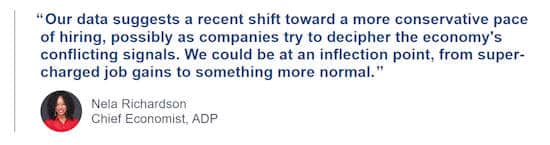
- Unadjusted Employment rose from 152.263 million to 152.572
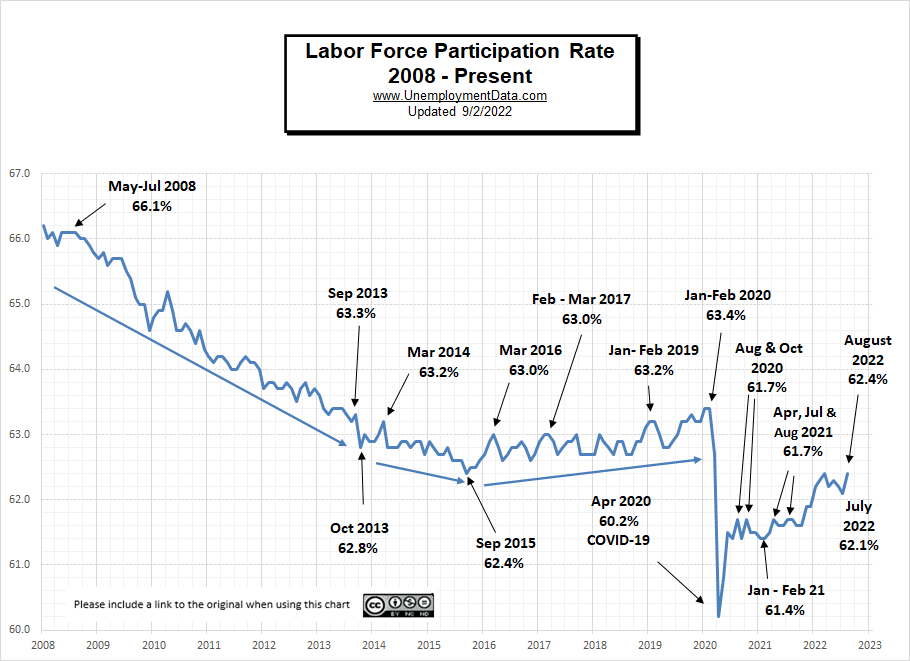
- Labor Force Participation Up from 62.1% to 62.4%
- Adjusted U-3 was Up from 3.5% to 3.7%
- Unadjusted U-3 was Unchanged at 3.8%
- Unadjusted U-6 was Down from 7.2% to 7.0%
Looking Back:
In June, we reported a few Early Indicators of a brewing recession.
- Labor Force Participation Down from 62.3% to 62.2%
- Upturn in Uneducated Unemployment
- Rising Unemployment among the newly unemployed
- Average Weekly Hours among manufacturing workers falling
Since then, the BLS has changed the employment numbers for June from an initial 152.692 million for June. They adjusted down to 152.634 million in July and then down to 152.607 in August. So, a total of 85,000 jobs disappeared for June.
July’s Indicators
Originally they reported employment of 152.249 million jobs for July. They have adjusted that to 152.263 million , which is an increase of 14,000 jobs. For August, they are currently reporting 152.572 million, an increase of 323,000 based on their original estimates or an increase of 309,000 based on their updated numbers.
But… August employment is still below June’s employment no matter which number for June they use.
On the Bright Side
Labor Force Participation is Up to 62.4% where it peaked in March.
In the News:
Trying to put a good spin on rising unemployment US. News says:
Lower US Job Gain in August Could Aid Fed’s Inflation Fight
The NY Times is beating the same drum:
Job Market Cooled but Was Still Strong in August
The monthly employment report suggested that the Federal Reserve might be able to tame inflation without causing a recession.
CNN follows along:
Yes, the unemployment rate rose. Here’s why that’s good news
ADP National Employment Report
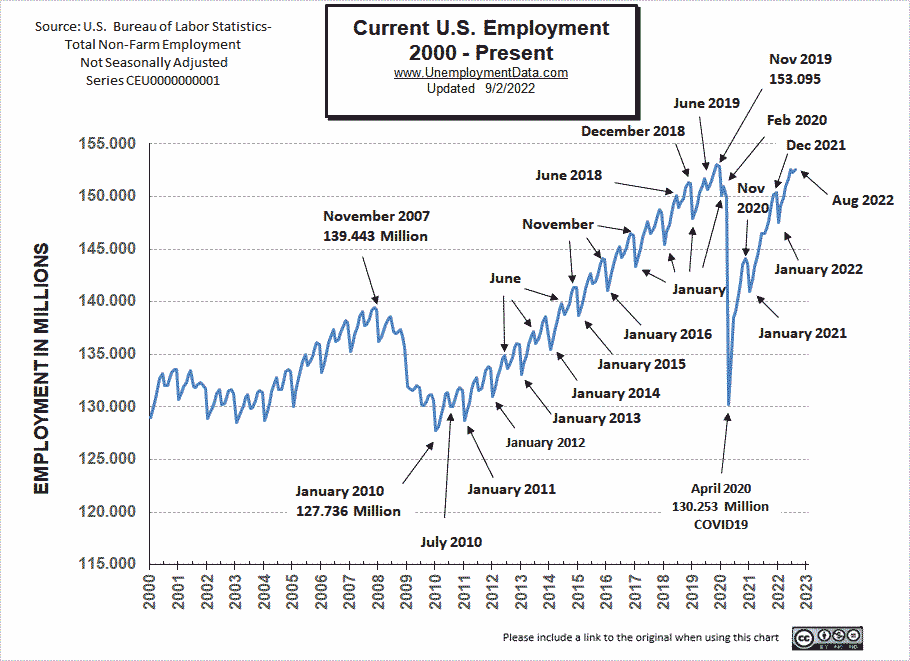
In addition to the BLS, we can look at the Jobs Report generated by private companies like ADP Research Institute. According to their numbers, August employment was up 132,000 not the 300,000+ that the BLS reports.
- Private employers created 132,000 jobs in August, a step down from the month before, when the economy created nearly 270,000 jobs. Payroll growth also slowed in July when compared to June of this year.
About the ADP Report:
The ADP National Employment Report is an independent estimate of the change in U.S. private sector employment and pay derived from actual, anonymous payroll data of client companies served by ADP, a leading provider of human capital management solutions. The report is produced by ADP Research Institute in collaboration with the Stanford Digital Economy Lab. The ADP National Employment Report is broadly distributed to the public each month, free of charge, as part of the company’s commitment to offering deeper insights of the U.S. labor market and providing businesses and governments with a source of credible and valuable information.
Current Employment
According to the Commissioner of the U.S. Bureau of Labor Statistics:
“Nonfarm payroll employment increased by 315,000 in August, and the unemployment rate rose to 3.7 percent. Notable job gains occurred in professional and business services, health care, and retail trade. Total nonfarm employment increased by 5.8 million over the year, as the labor market continued to recover from the job losses of the pandemic-induced recession. This growth brings total nonfarm employment 240,000 above its February 2020 level before the onset of the coronavirus (COVID-19) pandemic.”
You can read the full BLS report here.
As usual, they are talking about “Seasonally Adjusted Jobs” from the “Household Survey” rather than looking at the results reported by actual companies in the BLS “Establishment Survey”.
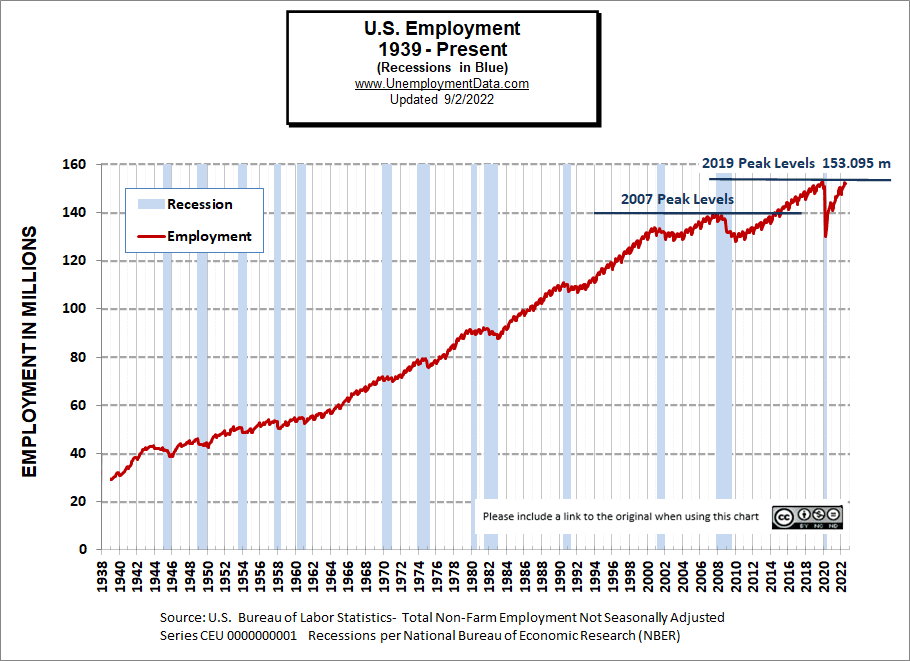
Employment is approaching the 2019 peak, although the population is now several million higher.
Historical Employment with Recessions
August 2022 Employment by Sector
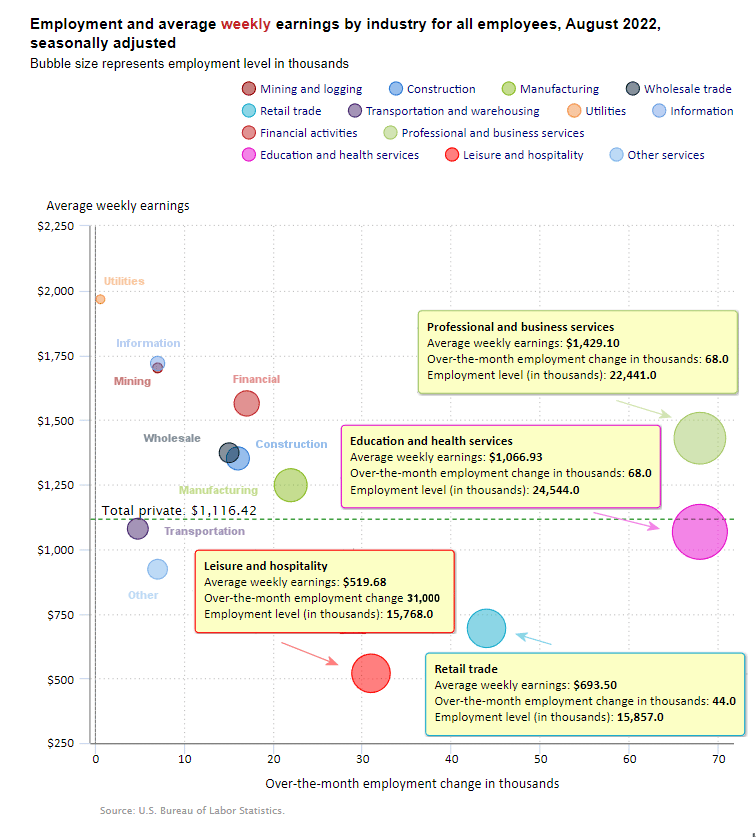
The employment “bubble chart” is a quick and easy way to see how each sector performs on a seasonally adjusted basis. So although we prefer to look at the Establishment Survey numbers these are the household survey adjusted numbers.
The Bubble’s Size tells us the total Employment for that industry (i.e., larger bubbles mean more people are employed in that sector).
The bubble’s location on the chart tells us that there has been a change in Employment Levels over the most recent month… A bubble further to the right indicates larger job growth. A bubble’s vertical location on the chart shows the average industry salary.
Up until last month, the tight Labor Market is still putting upward pressure on wages. In August, average weekly wages fell by a few cents.
Average Weekly Wages Fell Slightly
$1116.42 in August, $1,116.54 in July, $1,106.76, in June, $1,105.47 in May and $1,102.01 in April, and $1,086.46 in December 2021.
 Click for a larger image.
Remember, these are Seasonally Adjusted Numbers, so they aren’t cumulative! Every sector gained jobs again this month. Education and Health Services and Professional and Business Services gained 68,000 jobs each. Leisure and Hospitality gained 31,000 new jobs, while retail gained 44,000 jobs.
Last month we added another column to the table below that shows the employment levels that the BLS reported the previous month. Note that although they may claim that there was a “monthly increase” there isn’t always a real increase. Sometimes the increase is due to “seasonal adjusting”. We’ve marked those instances with an asterisk *. On the flip side, sometimes the increase is less than the actual increase due to seasonal adjusting. So, counterintuitively, the “monthly increase” is rarely this month’s employment level minus last month’s employment level.
Employment and Average Weekly Earnings by Industry
August 2022, Seasonally Adjusted Employment
| Industry | Monthly Increase | Average Weekly Earnings | Employment Level August | Employment Level July |
| Total Private Employment | 308,000 | $1,116.42 | 130,510,000 | 130,254,000 |
| Mining and Logging | 7,000 | $1,701.09 | 641,000 | 635,000 |
| Construction | 16,000 | $1,351.02 | 7,708,000 | 7,706,000 |
| Manufacturing | 22,000 | $1,247.29 | 12,852,000 | 12,826,000 |
| Wholesale trade | 15,100 | $1,372.80 | 5,896,200 | 5,872,200 |
| Retail trade | 44,000 | $693.50 | 15,857,000 | 15,805,300 |
| Transportation and Warehousing | 4,800 | $1,079.04 | 6,543,000 | 6,539,600 |
| Utilities | 600 | $1,966.57 | 541,600* | 541,600 |
| Information | 7,000 | $1,718.37 | 3,032,000 | 3,020,000 |
| Financial Activities | 17,000 | $1,563.69 | 8,981,000 | 8,965,000 |
| Professional and Business Services | 68,000 | $1,429.10 | 22,441,000 | 22,379,000 |
| Education and Health Services | 68,000 | $1,066.93 | 24,544,000 | 24,495,000 |
| Leisure and Hospitality | 31,000 | $519.68 | 15,768,000 | 15,769,000 |
| Other Services | 7,000 | $922.21 | 5,705,000 | 5,700,000 |
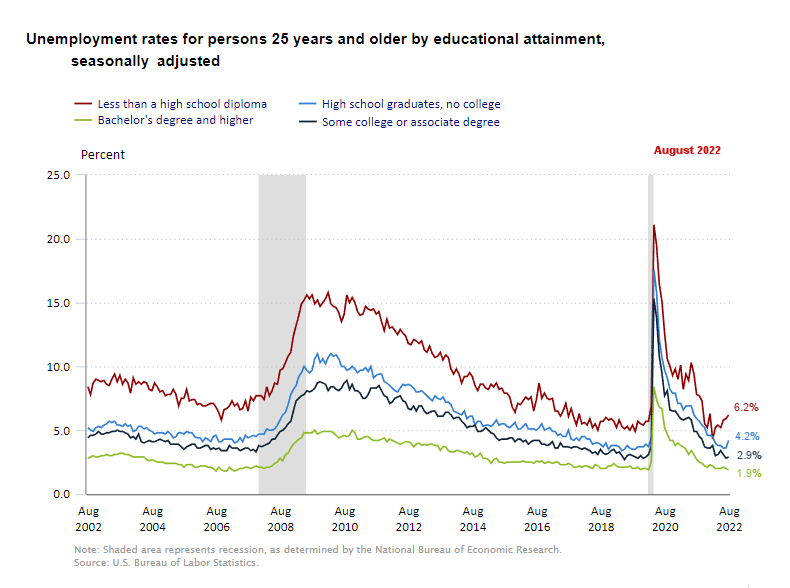
Unemployment by Education
Unemployment among College grads fell slightly to 1.9%, while all other categories rose. Those with some college rose to 2.9% in August, while those with only a High School Diploma had an unemployment rate of 4.2%, and those with less than a High School diploma rose to 6.2% in August.
| Less than H.S. | H.S. No College | Some College | Bachelors + | |
| Feb 2022 | 4.3% | 4.5% | 3.8% | 2.2% |
| Mar 2022 | 5.2% | 4.0% | 3.0% | 2.0% |
| Apr 2022 | 5.4% | 3.8% | 3.1% | 2.0% |
| May 2022 | 5.2% | 3.8% | 3.4% | 2.0% |
| Jun 2022 | 5.8% | 3.6% | 3.1% | 2.1% |
| Jul 2022 | 5.9% | 3.6% | 2.8% | 2.0% |
| Aug 2022 | 6.2% | 4.2% | 2.9% | 1.9% |
As we’ve said for a couple of months now, the upturn in uneducated unemployment could be an early indicator of trouble brewing in the economy. They are the unskilled, easily replaced workers (always the first to go), and their unemployment levels are rising. But it hasn’t filtered down to the higher levels of education yet.
Source: BLS
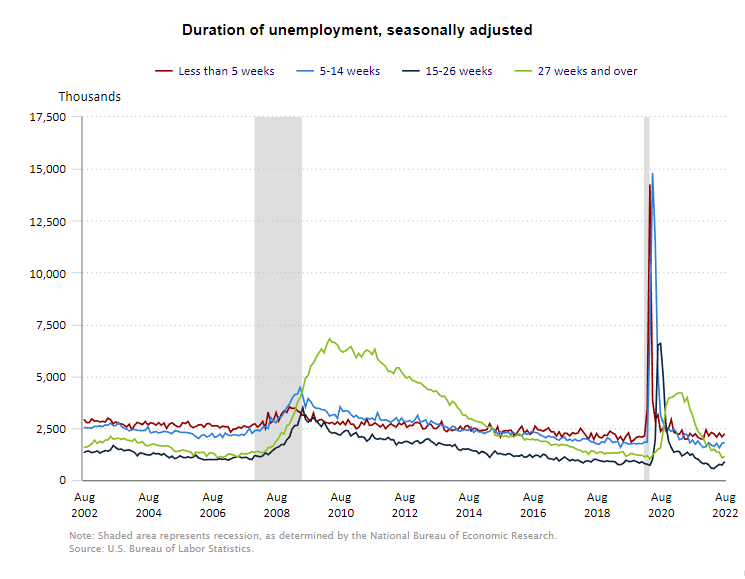
Duration of Unemployment
Unemployment in the 15-26 week category is rising, indicating that it is taking longer for people to find new jobs.
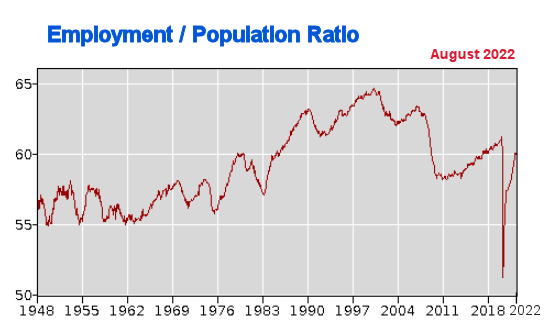
Employment / Population Ratio
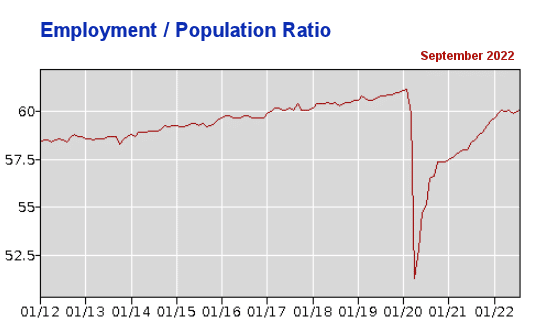
The employment/population ratio ticked up slightly in August but is still well below pre-covid levels.
As we can see in the Employment-Population Ratio since 1948:
From 1948 through 1976 between 55% and 58.2% of the total population worked outside the home. But in 1977 all that began to change. By the end of 1977, it was at 58.7% and by 1979 it was over 60%.
Those numbers continued to climb for the next two decades and at the turn of the century, the Employment-Population ratio was around 65%. For the next decade, it fell rather steadily (with a brief respite from 2004-2007). So that by 2010 it was back around 58.5%.
Through the teens, it gradually regained a bit of its loss. So by the end of 2019 and the beginning of 2020, the Employment-Population ratio was hovering between 61.0% and 61.2%. So roughly 61% of the population was working… 4% less than in 2000. But then, due to the COVID-19 virus, we saw a sharp drop in March 2020 to 60.0%, and April saw an unprecedented drop to 51.3%.
By July 2020, the Employment-Population ratio had regained roughly half of its loss taking it to 55.1%. Then the Employment / Population ratio rose steadily throughout 2021, so by May 2021, it was 58.0%. It increased slowly until December when it reached 59.5%. Through May 2022, the employment-population ratio only increased another 0.6% to reach 60.1% where it began to falter and by July it was at 60.0%.
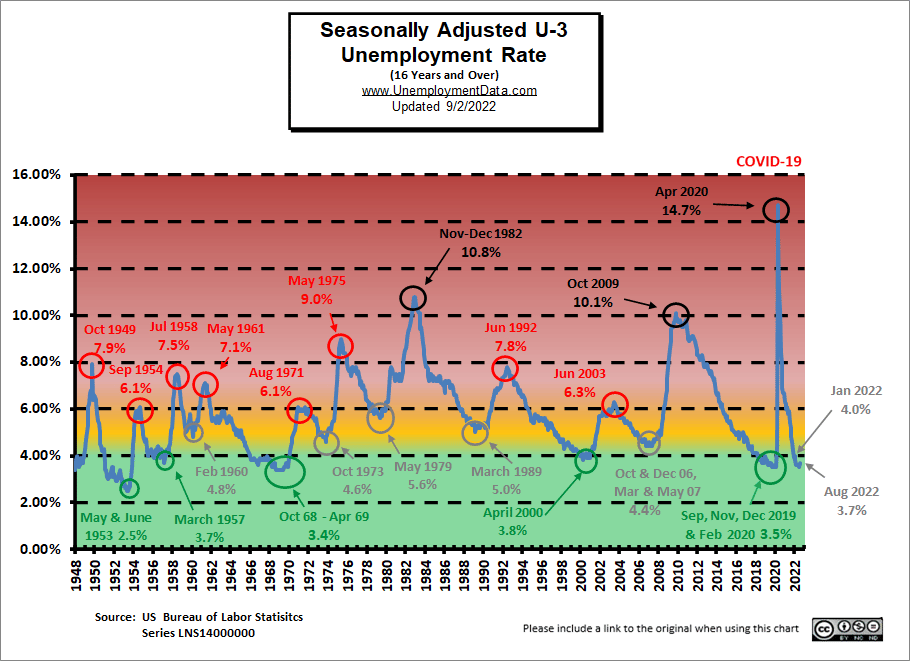
Unemployment Still Historically Low
Unemployment levels are in the historically low territory. After all, the FED did pump unprecedented TRILLIONS into the economy to get us to this place.
See: FED Actions for more info.
But we can see that Seasonally Adjusted U-3 is definitely in the “Green” territory.
 Click for a larger Image
August 2022 Labor Force Participation Rate
LFPR jumped up in August but is still below Jan-Feb 2020 levels (i.e. 63.4%), possibly indicating a permanent departure from the labor force by one spouse in order to be more active in their children’s lives and education.
See Labor Force Participation Rate for more information.
Seasonally Adjusted U1 through U6 Unemployment Rates
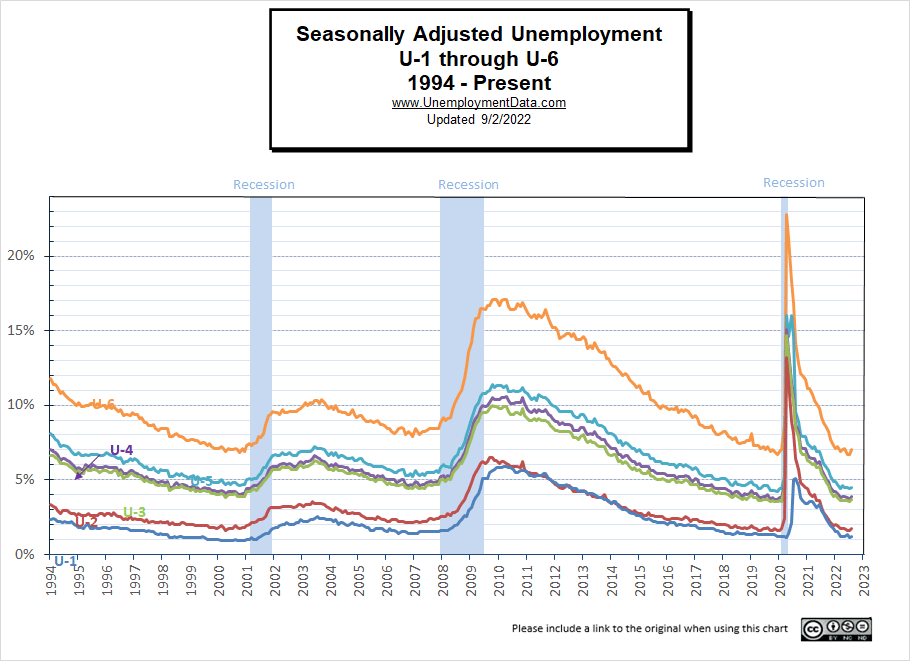
For more information about the various measurements of unemployment, see What Is U-6 Unemployment?
Click here if you would like to receive this monthly report and other article updates. You can unsubscribe at any time.
Here are some articles you might enjoy in case you missed them:
Read more on UnemploymentData.com.
- 6 Steps to Start Your Home-Based Business
- July 2022 Jobs Report- Not as Rosy as They’d Have You Believe
- Is the Average Worker “Falling Behind”?
- 4 Ways to Keep Good Employees at Your Company for Longer
- June 2022 BLS Jobs Report- Recession Indicators?
From InflationData.com
- Total U.S. Cumulative Inflation
- Have Commodity Prices Peaked? Does That mean Recession?
- 2022: Highest June Inflation Since 1941
- The Many Evils of Inflation
- July 4th Cookout Will Cost You 17% More in 2022
From Financial Trend Forecaster
- Moore Inflation Predictor
- NYSE ROC
- NASDAQ ROC
- Non-Fungible Tokens (NFTs): Another Financial “Fumble”
- Will Loan Forgiveness Raise College Costs?
- How Long Will This Recession Last?
- Is The U.S. A Powerful “Empire” In Decline?
- How Low Can the S&P 500 Go?
- Stocks Don’t Go Straight Up (or Straight Down)
- What the “Housing Busts” Indicator Is Saying Now
- How to Prepare for a Hard-Hitting Bear Market (Think 1929-1932)
- The Dow 8 Waves are Incomplete
- What to Make of the Stock Market’s Bounce
From OptioMoney.com
- 7 Ways to Save Money When Living in a Big City
- How Addiction Can Cause Financial Trouble
- Common Mistakes to Avoid When Investing in Real Estate
- Financial Mistakes to Avoid After College
- Common Tax Mistakes That You Need To Avoid
From Your Family Finances