The U.S. Bureau of Labor Statistics (BLS) released its employment / unemployment report for September on October 6th, 2023.
Adjusted U3 Unemployment Unchanged
![]()
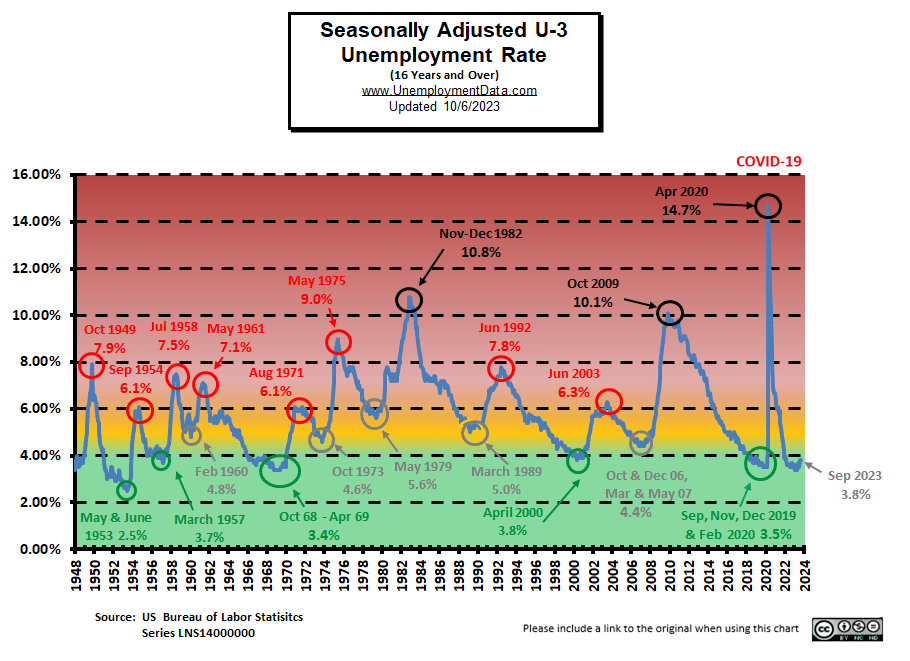
- Adjusted U-3 was 3.8% unchanged from August
- Unadjusted U-3 was 3.6% down from 3.9%
- Unadjusted U-6 was 6.7% down from 7.2%
- Labor Force Participation was 62.8% unchanged
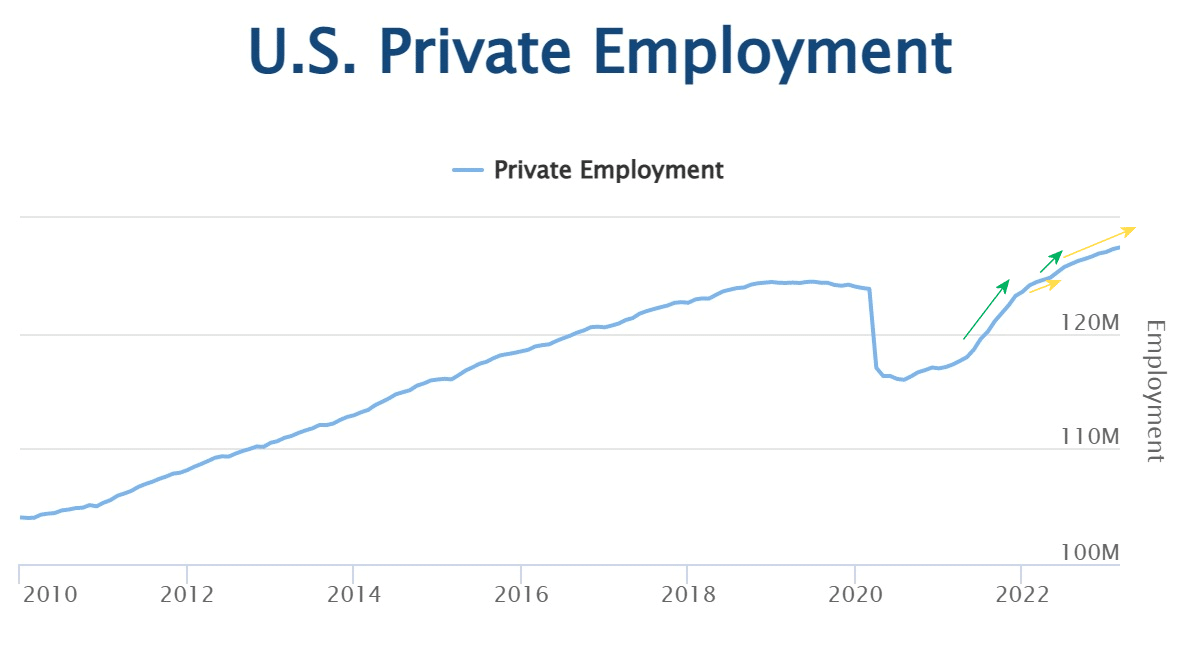
- Unadjusted Employment rose from 156.416 to 157.001 million
Summary:
Despite the fact that the Seasonally Adjusted U3 unemployment rate was unchanged,
the UNADJUSTED U3 Rate was down… as is typical for this time of year.
Total Employed increased from 156.416 million in August to 157.001 million in September.
According to the Commissioner of the U.S. Bureau of Labor Statistics:
“Total nonfarm payroll employment rose by 336,000 in September, and the unemployment rate was unchanged at 3.8 percent, the U.S. Bureau of Labor Statistics reported today. Job gains occurred in leisure and hospitality; government; health care; professional, scientific, and technical services; and social assistance…
Among the major worker groups, the unemployment rates for adult men (3.8 percent), adult women (3.1 percent), teenagers (11.6 percent), Whites (3.4 percent), Blacks (5.7 percent), Asians (2.8 percent), and Hispanics (4.6 percent) showed little or no change in September.”
You can read the full BLS report here.
As usual, they are talking about “Seasonally Adjusted Jobs”.
Looking at the Unadjusted Establishment Survey report we see…
Originally the BLS reported employment of 156.302 million for August which they adjusted to 156.416 million. So they added 114,000 jobs for August. They are currently reporting 157.001 million jobs for September which is actually an increase of 699,000 jobs based on their original estimates or an increase of 585,000 based on their updated numbers.
BLS Source
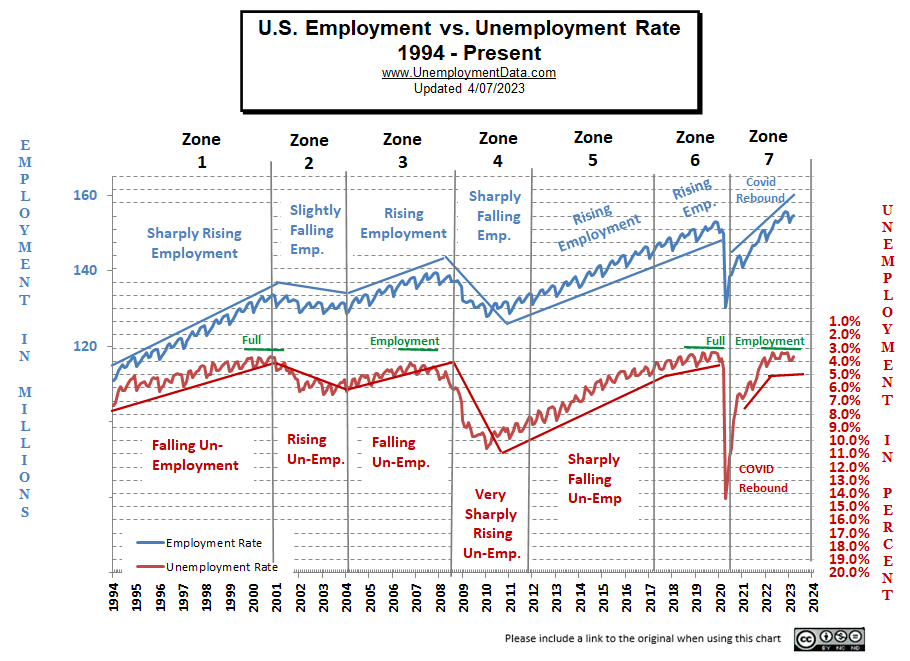
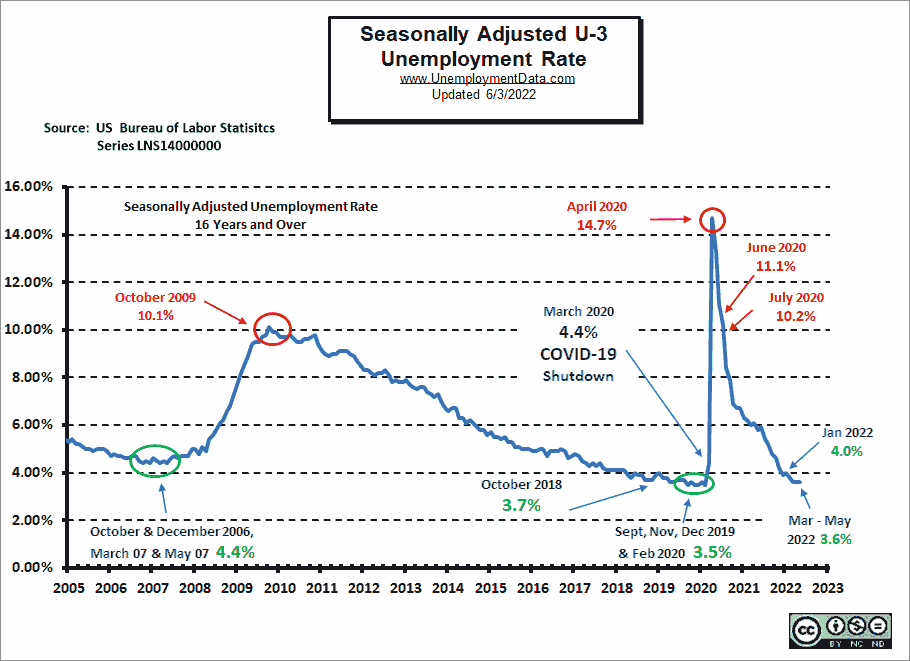
Current Employment Rate Chart
Adjusted Unemployment is slightly above the pre-COVID 2019 cyclical lows of 3.5% as well as above the lows made earlier this year. Current levels are still within the “Green Zone”.
[Read more…] about October Unemployment Report for September 2023