
On June 3rd the U.S. Bureau of Labor Statistics released its “surprisingly weak” monthly Employment Report which the media is touting as “terrible”. According to the media “only 38,000 jobs were created” in the month of May. Although experts were predicting an increase two or three times as large.
This was the smallest gain since September 2010 partially fueled by the Verizon strike of 34,000 but even with that extra 34,000 payrolls would have increased by only 72,000. Fed Chair Janet Yellen has said monthly gains of roughly 100,000 jobs are needed to keep up with growth in the work-age population.
However, like most Government statistics it is only half the story. First of all, the numbers quoted are
“Seasonally Adjusted”. If we look at the Total Non-Farm Employment Not Seasonally Adjusted Employment for April it was 143.941 Million and for May was 144.592 Million so simple subtraction will tell you that Non-Farm Payrolls actually increased by 651,000 but May is typically the beginning of the Summer increase so the net increase after seasonal adjustment is only 38,000. In addition, U-6 unemployment rose from 9.3% to 9.4% while the Unadjusted U-3 Unemployment actually fell from 4.7% to 4.5%. And even seasonally adjusted U-3 fell from 5% in April to 4.7% in May. So everything is really rosy right? Well, not exactly.
Employment Analysis by James Barrett
Listening to the monthly “Unemployment” numbers left me scratching my head. How could unemployment rates be at or near historic lows and yet feel so bad?
I decided to look at the numbers simplistically, without all of the caveats and footnotes and convoluted breakdowns and adjustments. Simply look at the Population growth compared to the Labor Force growth and see what we get.
Finding the Census Bureau’s annual USA populations numbers was simple. Likewise, the Bureau of Labor Statistics publishes easily found regular numbers indicating the size of the total Labor Force by year.
My simplified analysis is sure to be imprecise, and I know there is an 18-year gap between population growth by birth and Labor Force eligibility, etc. but at the same time, due to its simplicity, this analysis should provide a realistic overview of the employment situation across the nation.
I chose to look at the time period 2008 to 2015
(the last full year that numbers that are available.)
Here’s what I found:
| (in Millions) | 2008 | 2009 | 2010 | 2011 | 2012 | 2013 | 2014 | 2015 | Total |
| 1. U.S. Population (Census Bureau) | 304.1 | 306.8 | 308.1 | 310.5 | 312.9 | 315.2 | 317.7 | 320.2 | +16.1 |
| 2. Labor Force (BLS) | 154.3 | 154.1 | 153.9 | 153.6 | 155.0 | 155.4 | 155.9 | 157.1 | +2.8 |
| Pop minus Labor Force (Not in Labor Force) | 149.8 | 152.7 | 154.2 | 156.9 | 157.9 | 159.8 | 161.8 | 163.1 | +13.3 |
| Growth in Non-Labor Force | — | +2.9 | +1.5 | +2.7 | +1.0 | +1.9 | +2.0 | +1.3 | +13.3 |
| 3. Population Annul Growth Rate (AGR) | 0% | .888% | .424% | .779% | .773% | .735% | .793% | .787% | |
| 4. Est. Labor Force if same AGR | 154.3 | 155.7 | 156.3 | 157.5 | 158.8 | 159.9 | 161.2 | 162.5 | |
| Missing Labor Force (2 minus 4) | — | (1.6) | (2.4) | (3.9) | (3.8) | (4.5) | (5.3) | (5.4) |
In the table above, I subtracted the Labor Force from the Population yielding some indication of the size of the group of Americans not in the Labor Force and found something shocking. Forget about “unemployment” percentages or Participation Rates or other complex permutations of numbers, the total US population over the past eight years has grown by 16.1 Million and 13.3 Million “of them” are NOT in the Labor Force!
What it shows is that if the size of the Labor Force had grown at the same rate as the Population (needed to maintain a similar employment/unemployment ratio), the Labor Force in 2015 would be 5.4 Million people larger than it actually was on July 1, 2015. Said a different way, there are actually 5.4 Million Americans not working AND not showing up in the published “unemployment” figures.
~James Barrett
 We’ve been talking about the falling Labor Force Participation Rate for a while here at Unemployment Data which means that as people fall out of the Labor Force the Government doesn’t have to count them as “Unemployed” anymore. Makes no sense I know. To make matters worse those falling out are not those retiring but actually young people. Interestingly, according to David Stockman a two-term Congressman from Michigan and Director of the Office of Management and Budget under President Ronald Reagan:
“In fact, at the February 2008 peak prior to the crisis, the BLS reported 138.5 million nonfarm payroll jobs compared to 143.9 million in April 2016. The net gain is thus only 5.6 million, and it means nearly 9 million or 61% of the 14 million new jobs our President has been crowing about are not “new” at all; they were born-again jobs, and even then they consist of lower paying and lesser quality jobs than the ones obliterated during the crash and so-called Great Recession. For instance, there has been a loss of 2.3 million goods-producing jobs in manufacturing, mining/energy and construction, paying an average of$58,000 per year; and these have been swapped for 1.9 million jobs in leisure and hospitality paying less than $20,000 per year.”
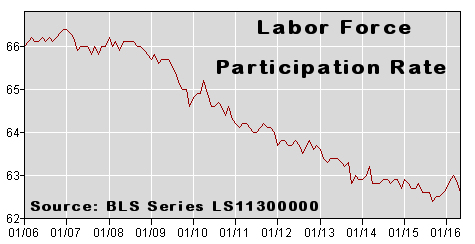
Long Term Labor Force Participation Rate (LFPR)
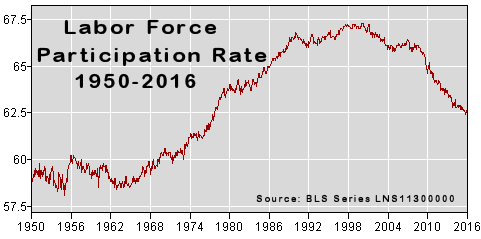
The LFPR grew during the 1960’s and 70’s as women began entering the workforce. It flatened during the recession of the early 1980’s and then peaked in the late 1990’s and fell during the recession from 2000 through 2004. From 2004 through 2007 it leveled off but then the “Great Recession” hit and the LFPR has fallen pretty steadily since. And even though we are supposed to be in a recovery the LFPR continues to fall although there was a bit of an up tick at the end of 2015 and early 2016, however beginning in April the LFPR has begun falling again.
Some people wrongly assume that the LFPR is falling due to retiring baby-boomers. This premise however has been proven false. See Record Low LFPR which shows the LFPR by age group since 1999. The biggest declines occur in the younger ages while those above age 60 actually show a higher percentage are working. For instance, in 1999 only 24% of those age 65-69 were working but according to the BLS by 2015 it had risen to 30.8% of those age 65-69 were working.
Gallup “Good Jobs” Index
Gallup’s “Good Jobs” Index is their version of the LFPR it is calculated as a percentage of the total population rather than limiting it to the “work force”. So although the percentage is lower it is a better indicator of the actual situation since it is not subject to fudging through simply redefining who is in the “work force”. Gallup says 45.4% of the total adult population is in the “Good Jobs” Index i.e. has a full-time job. This does not mean that they are employed at their full capacity or that they are earning a “decent wage” simply that they are employed full-time. Gallup defines a full-time as 30+ hours per week for an employer who provides a regular paycheck. This is up from 44.9% last month confirming the seasonal increase in employment mentioned above.
See: Is the Government Fudging Unemployment Numbers? For more info.
See Also:
Unemployment Rate Chart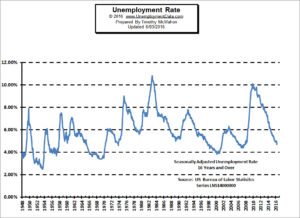 –
–
The seasonally adjusted unemployment rate
from 1948 to the present is one of the most watched statistics.
Where is it now and should you trust it?
U-6 Unemployment Rate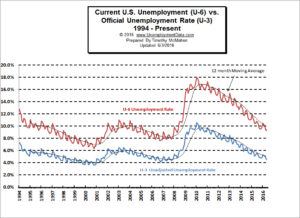 –
–
U-6 is the broadest measure of unemployment and includes
all classes of Unemployed plus those ”marginally attached”
and/or part-time for economic reasons.
Current Employment Data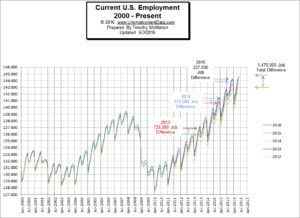 –
–
How many jobs are there actually?
This chart shows Employment since Jan 2000
and what the current trend is.
Historical Employment Data Chart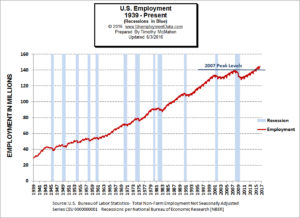 –
–
How Many People Are Actually Employed?