
December 2021 Unemployment report from the Bureau of Labor Statistics (BLS)
![]()
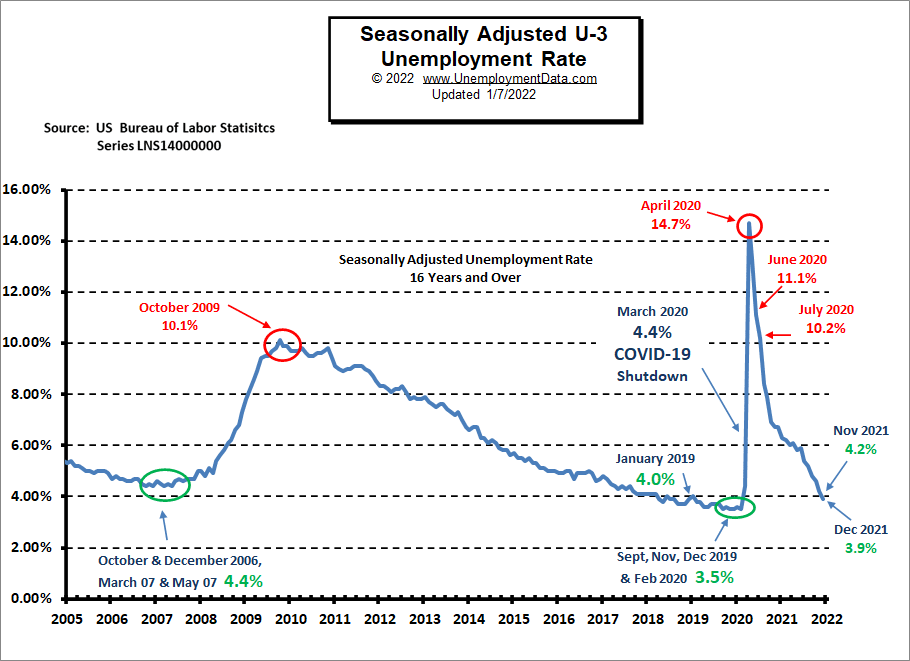
- Unadjusted U-3 was Down from 3.9% to 3.7%
- Adjusted U-3 was Down from 4.2% to 3.9%
- Unadjusted U-6 was Down from 7.4% to 7.2%
- Labor Force Participation Unchanged at 61.9%
- Unadjusted Employment rose from 150.098 million to 150.170 million
Job growth in December failed to meet expectations for the 2nd month in a row. Economists had predicted more than 400,000 jobs would be added in the month. Instead, according to the BLS, the U.S. economy added less than half that amount.
On a positive note, Seasonally adjusted unemployment fell from 4.2% to 3.9%.
According to the Commissioner of the U.S. Bureau of Labor Statistics:
“Nonfarm payroll employment rose by 199,000 in December, and the unemployment rate declined by 0.3 percentage point to 3.9 percent. Employment continued to trend up in leisure and hospitality, in professional and business services, in manufacturing, in construction, and in transportation and warehousing. In 2021, job growth averaged 537,000 per month. Employment has increased by 18.8 million since April 2020 but is down by 3.6 million, or 2.3 percent, from its level before the onset of the coronavirus (COVID-19) pandemic in February 2020.”
As usual, they are talking about “Seasonally Adjusted Jobs” from the “Current Population Survey (CPS)” rather than looking at the results reported by actual companies in their “Current Employment Statistics survey (CES).”
But looking at the CES report, we see…
Initially, the BLS reported 150.004 million for November, which they adjusted to 150.098 million. For December, they are reporting 150.170 million.
This is an increase of 166,000 jobs based on their original estimates or an increase of 72,000 based on their updated numbers.
Although Employment is 6.568 million Above Year-Ago Levels…
Employment numbers are still about 800,000 short of February 2020 numbers, but the Civilian Population has increased by about 2.6 MILLION people since then.
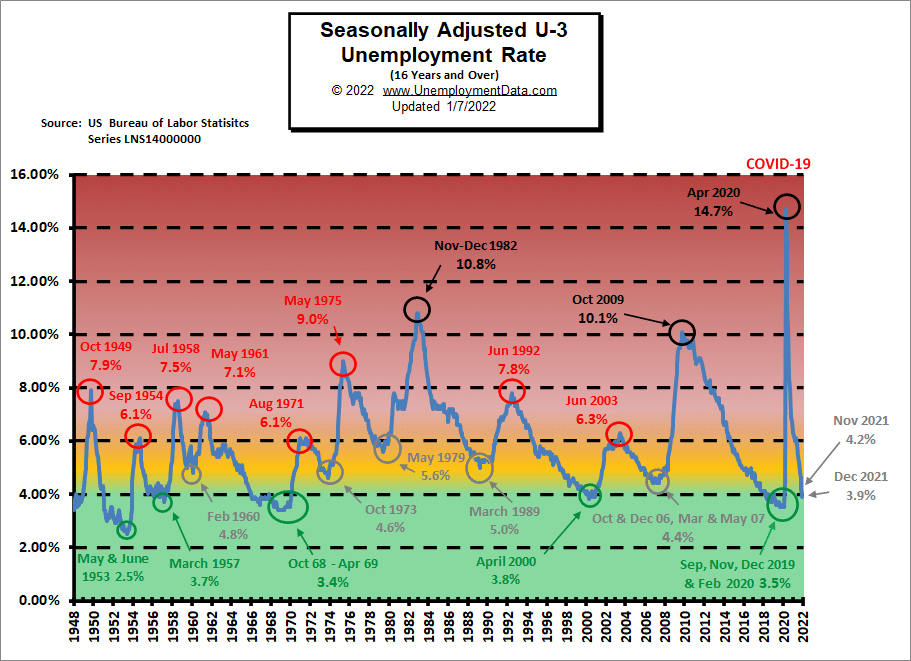
Unemployment Normalizing
Unemployment has entered the “Green Zone,” indicating that unemployment is doing reasonably well. Rather than a shortage of jobs, anecdotal evidence suggests a lack of workers. Help wanted signs are prevalent, but people seem reluctant to return to work either due to fear of COVID or a realization that spending time with family (or homeschooling) is more important than a second income eaten up by additional childcare, travel, and food preparation costs. This idea is reinforced by the low unemployment numbers combined with a low LFPR indicating many people have left the labor force.
 Click for larger Image
Labor Force Participation Rate
LFPR breaks out of its recent channel but is still well below 2019 levels.
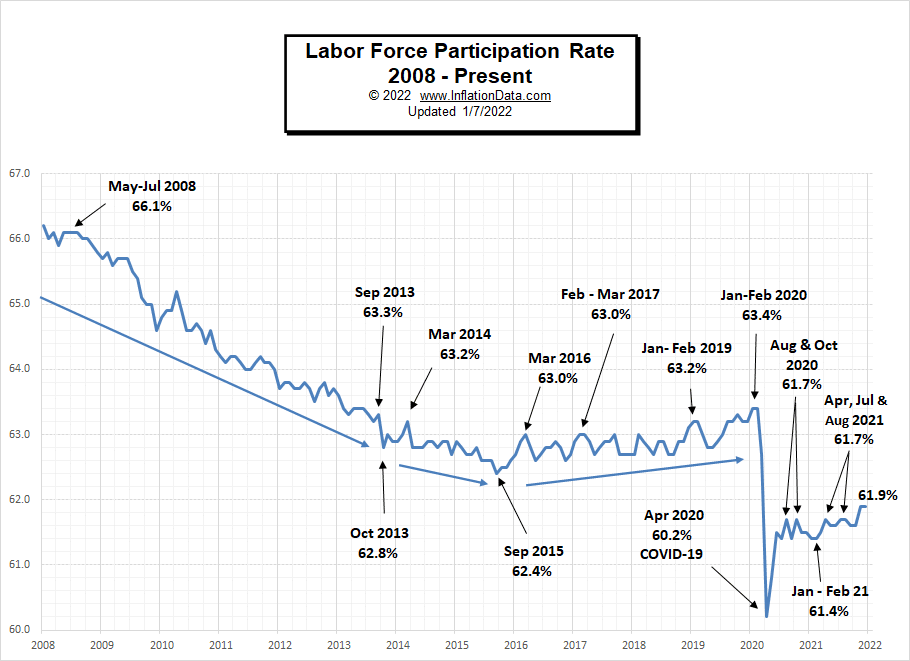 Until November, Labor Force Participation Rate (LFPR) had been bouncing between 61.4% and 61.7% for over a year. In November, the BLS reported the LFPR rose to 61.8% but later, they adjusted the November LFPR to 61.9% and are currently reporting the December LFPR as 61.9% as well.
As we explain in the page on the Labor Force Participation Rate, the BLS has a strange definition of Labor Force Participation, and so if you “want a job” but don’t look, you aren’t in the Labor Force.
Historical Employment
Unemployment goes hand-in-hand with recession. The 2008 recession saw a sharp reduction in Employment and a prolonged recession. The 2020 COVID scare saw an even sharper decline in Employment but a very brief recession, although employment levels have still not returned to pre-pandemic levels.
Note: Despite having a “pandemic,” the population increased by over 2 million.
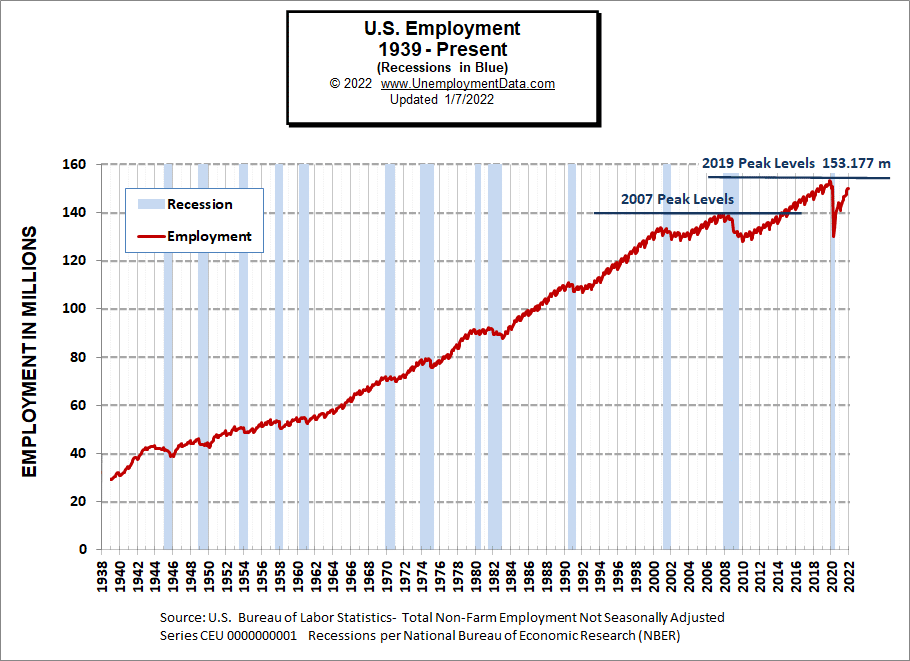
See Historical Employment Data for more info.
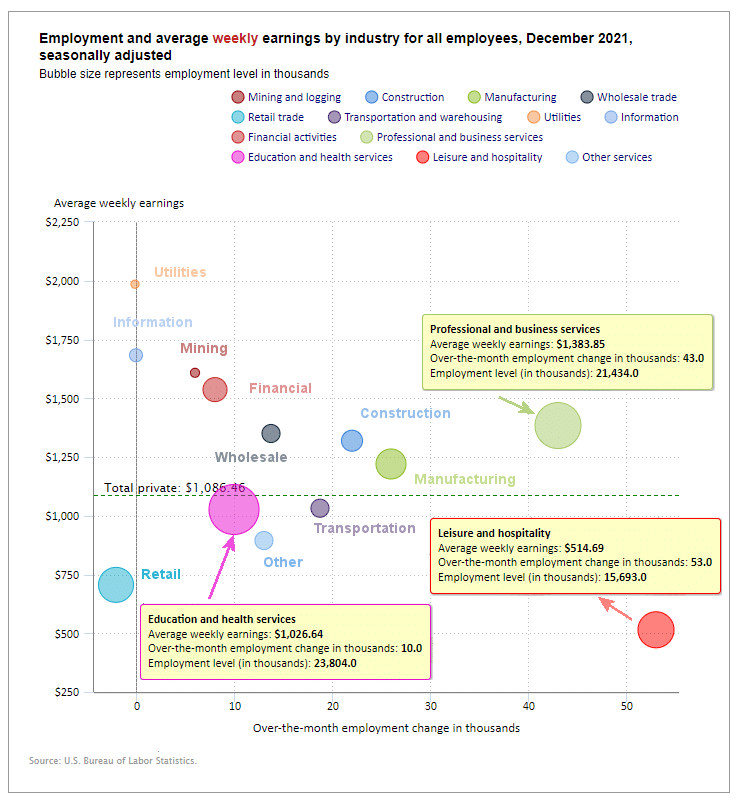
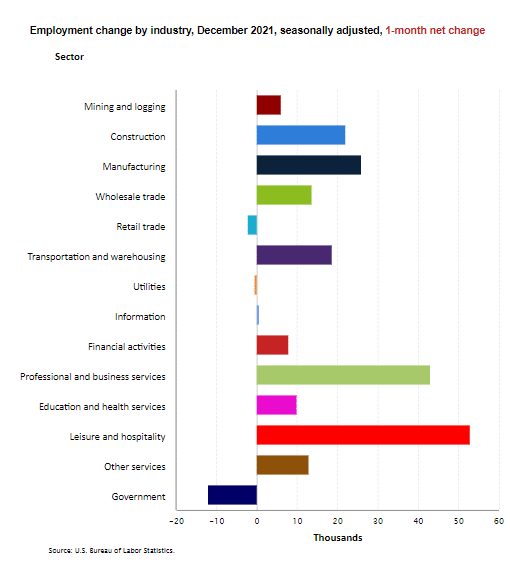
Employment by Sector
The employment “bubble chart” is a quick and easy way to see how each sector performs on a seasonally adjusted basis. The Bubble’s Size tells us total Employment for that industry (i.e., larger bubbles mean more people are employed in that sector).
The bubble’s location on the chart tells us that there is a change in Employment Levels over the most recent month… The further to the right the bubble, the larger the number of jobs, and the higher up on the chart, the larger the average salary.
Average weekly wages rose by $6.62 from $1,079.84 in November to $1,086.46 in December.
 Click for larger Image
Once again, Leisure and Hospitality was the largest gainer while Retail was the biggest loser. Both industries have the lowest weekly wages. The second-biggest gainer was Professional and Business Services, which has much better than average wages. Education and Health Services with fairly average wages gained 10,000 jobs over the month. These are also the four largest sectors of the economy, followed by the Manufacturing and Financial sectors.
Employment and Average Weekly Earnings by Industry
December 2021, Seasonally Adjusted
| Industry | Monthly Increase | Average Weekly Earnings | Employment Level |
| Total Private Employment | 211,000 | $1,086.46 | 127,043,000 |
| Mining and Logging | 6,000 | $1,608.32 | 656,000 |
| Construction | 22,000 | $1,319.30 | 7,560,000 |
| Manufacturing | 26,000 | $1,220.28 | 12,580,000 |
| Wholesale trade | 13,700 | $1,350.05 | 5,766,000 |
| Retail trade | -2,100 | $705.87 | 15,451,800 |
| Transportation and Warehousing | 18,700 | $1,032.08 | 6,041,300 |
| Utilities | -200 | $1,985.31 | 536,200 |
| Information | 0 | $1,682.86 | 2,795,000 |
| Financial Activities | 8,000 | $1,536.75 | 8,919,000 |
| Professional and Business Services | 43,000 | $1,383.85 | 21,434,000 |
| Education and Health Services | 10,000 | $1,026.64 | 23,804,000 |
| Leisure and Hospitality | 53,000 | $514.69 | 15,693,000 |
| Other Services | 13,000 | $894.52 | 5,807,000 |
This chart provides another way to look at these monthly numbers. This chart includes government jobs that lost 12,000 jobs in December.
Source: BLS Employment by Industry
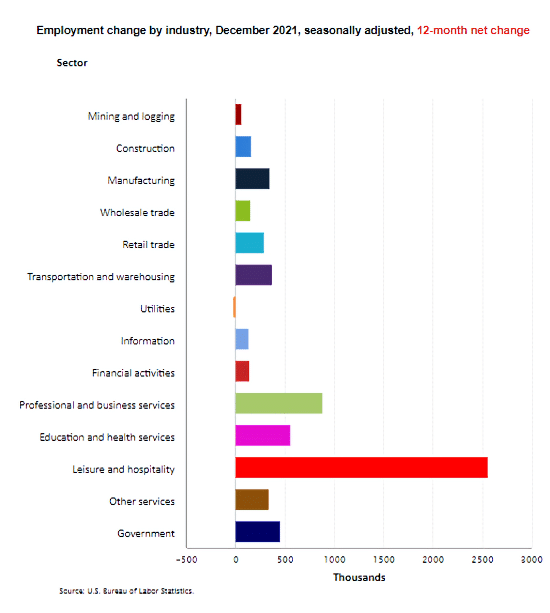
But looking at Employment Change by Industry over the last 12 months, we can see that Government gained 452,000 jobs over the year.
 Source: BLS
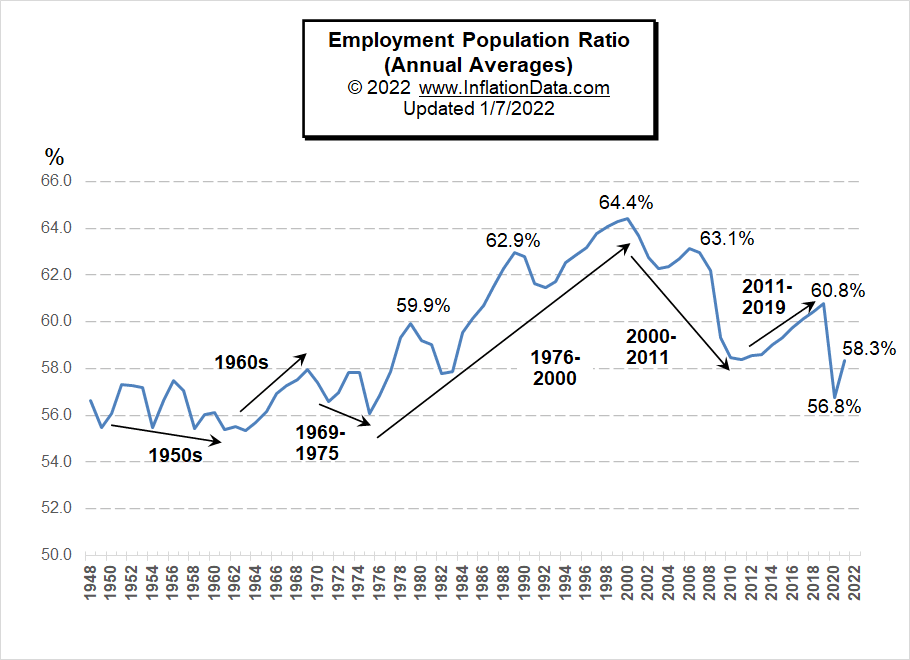
Employment-Population Ratio
This chart shows the actual percentage of the population that’s working, unlike the Labor Force Participation Rate, which shows the portion of the population working or looking for work. The Annual Average Employment-Population Ratio for 2021 was 58.3%, although, for December alone, it was slightly higher at 59.5%.
By looking at annual averages rather than monthly numbers, we can see the long-term trends in the percentage of the population that is working. For more information and the full commentary on these trends, see Employment-Population Ratio.
Seasonally Adjusted U1 through U6 Unemployment Rates
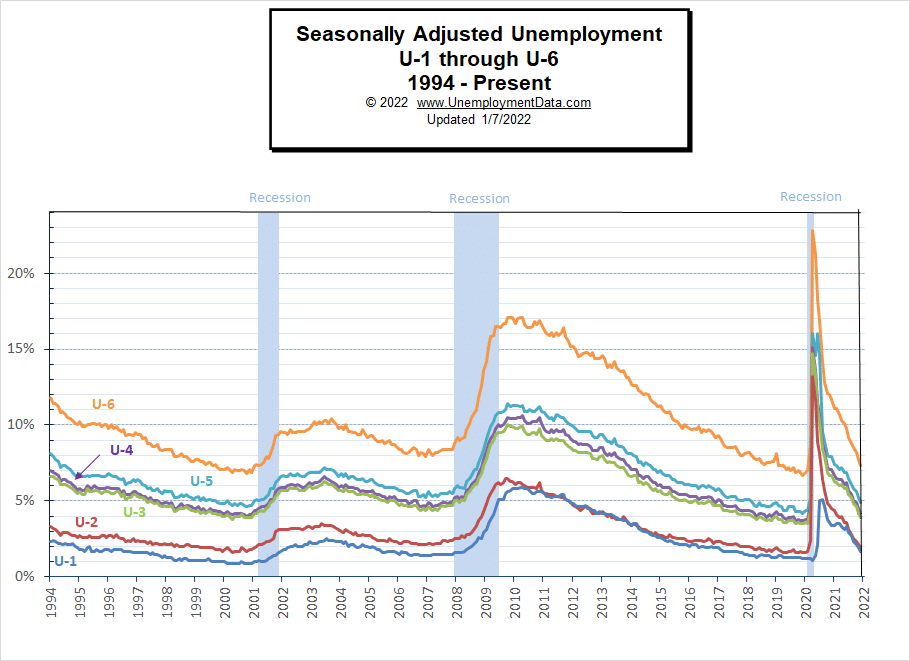
For more information about the various measurements of unemployment, see What Is U-6 Unemployment?
Current Employment
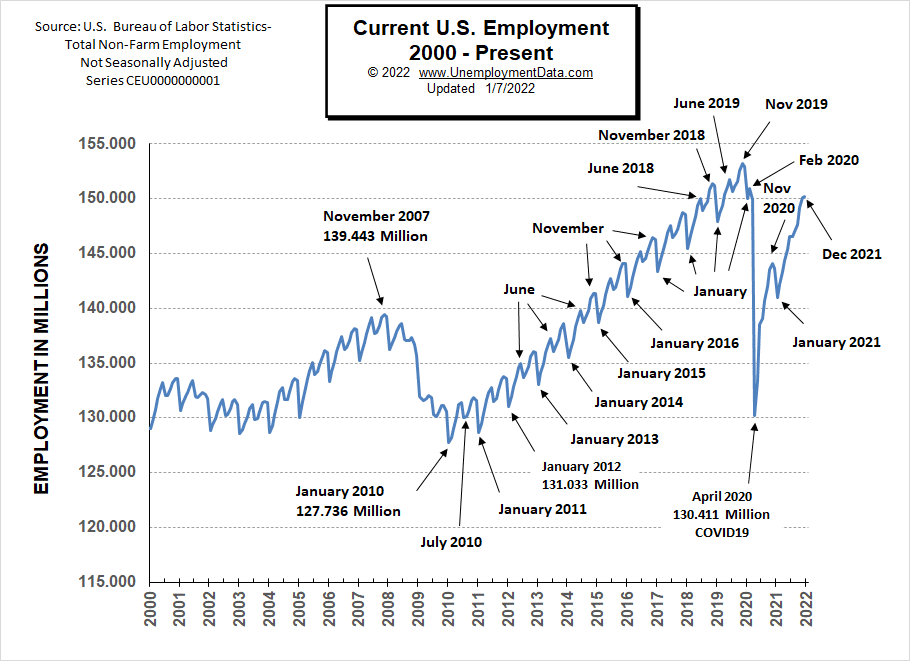
December employment ticked up, but still, 798,000 below February 2020 and 3.007 million below November 2019 levels, plus the Civilian Non-Institutional Population has increased by 2.6 million since then.
See Current Employment for more info.
Current Seasonally Adjusted Unemployment
 Click for larger Image
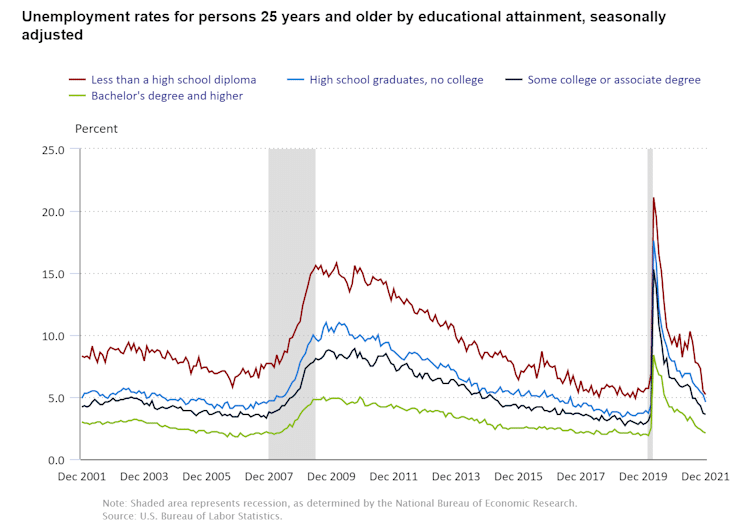
Unemployment by Education
In December, the unemployment rate for the most highly educated fell to 2.1% from 2.4% in November, while the least educated fell to 5.2% from 5.7%.
Those with the least education are always the first to be laid off when the economy declines because employers can easily replace them later. Those with specialized knowledge and/or skills are retained at all costs. The unemployment rate for Bachelor’s degree holders is typically between 2% and 3%, except when times are exceptionally bad.
Click for larger Image
Click here if you would like to receive this monthly report and other article updates. You can unsubscribe at any time.
Here are some articles you might enjoy if you missed them:
Read more on UnemploymentData.com.
- Simple Tips For Generating More Real Estate Clients
- Tips for Starting a Successful Home-Based Business
- Using the 9 Box Model for Evaluating Employees
- Perks of Choosing a Nursing Career
From InflationData.com
- Spoiler: The FED Guaranteed To Fight Inflation… Sooner Or Later
- Soaring Inflation Can Skyrocket Your Insurance Costs
- Why Quantitative Easing is Inflationary… Sometimes
- Millennials Have Never Seen Inflation This High
- Is Bitcoin a Better Inflation Hedge Than Gold?
- How Nixon’s Revolutionary Move Influenced U.S. Inflation For 50 Years
- U.S. Inflation is Not the Only One Increasing
- Inflation: The New Normal?
From Financial Trend Forecaster
- Moore Inflation Predictor
- NYSE ROC
- NASDAQ ROC
- Are 3D Printed Houses the Trend of the Future?
- Will 2022 Be the Year of Massive Social Media Upheaval?
- Metaverse vs. Multiverse- What are They? And Where are They Leading?
- Curing Cancer with T-Cells
- 5 Revolutionary Developments in the Financial Industry
- How Is Technology Affecting Global Trading Markets
- Euro: Look at This Head & Shoulders Chart Formation
- Has Crypto-Mania Finally Run Its Course?
- Are Disease Outbreaks Market Indicators?
- Secrets To Maintain A Healthy Trading Psychology
- A Change May Be Nigh for Real Estate
From OptioMoney.com
- Portfolio Diversification: The Key to Financial Stability
- Are Indoor Home Gyms Worth the Money?
- Can You Make Money with a Home Music Studio?
- Quick Guide To The Secrets Of FHA Loans
- Creative Ways to Make Money In Retirement
From Your Family Finances