• About WordPress
    • WordPress.org
    • Documentation
    • Learn WordPress
    • Support
    • Feedback
  • Log In
  • Skip to primary navigation
  • Skip to main content
  • Skip to primary sidebar
  • Home
  • Contact us
  • Related Sites
    • InflationData.com
    • Financial Trend Forecaster
    • Your Family Finances
    • Elliott Wave University
    • Optio Money
  • About
    • Terms of Use
    • Disclaimer & Disclosure
    • Privacy Statement
  • Sitemap
    • 2009-2010 Posts
    • 2011 Posts

UnemploymentData.com

Your Source for Employment and Unemployment Data

Unemployment
  • Charts
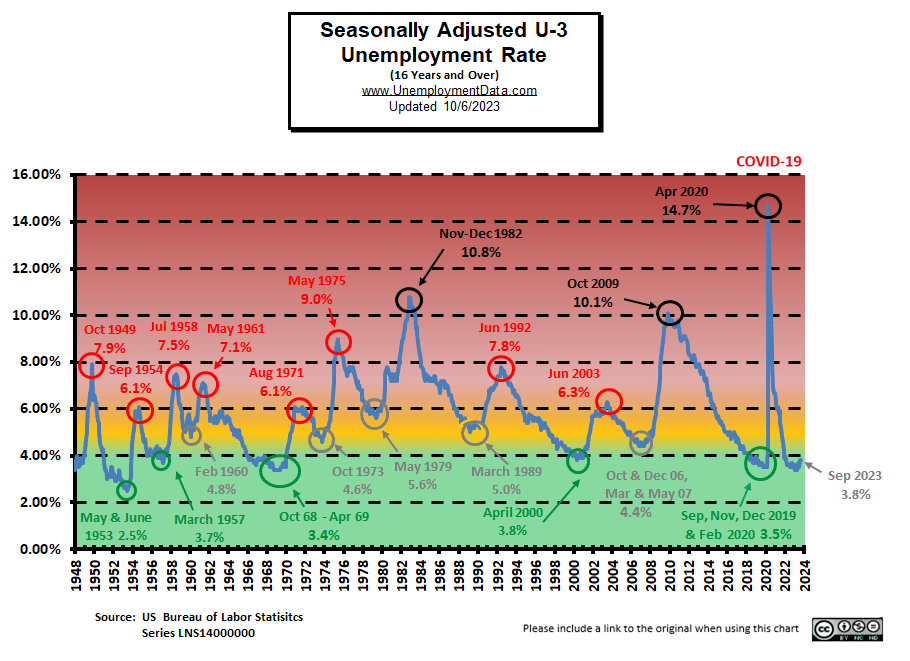
    • Current Unemployment Rate Chart
    • Current Employment Rate (Chart and Data)
    • Current Employment vs Unemployment Chart
    • Historical Employment Data
    • Employment Population Ratio
    • Misery Index
  • Unemployment
    • Historical Unemployment Rate Tables
    • What Is U-6 Unemployment?
    • Unadjusted vs. Seasonally Adjusted U-3 Unemployment Rate
    • BLS vs. Gallup Unemployment Numbers
    • Current U-6 Unemployment Rate
    • What is the Labor Force Participation Rate?
    • What is the Real Unemployment Rate?
  • Employment
    • Current Employment Rate (Chart and Data)
    • Historical Employment Data
    • Contacting a Live Person at the State Employment Commission
      • How to Talk to a Live Person at the Virginia Unemployment Commission
      • Florida’s FLUID Unemployment Program
    • Benefits
      • Insurance
      • Retirement
    • Careers
    • Employment Costs
    • Experience
    • Government
    • Job Hunting
      • Interview
      • Resume
  • Find Articles
  • Education
    • Skills
  • General
    • Small Business
      • Outsourcing
    • Success
You are here: Home / Archives for September

September

October Unemployment Report for September 2023

October 6, 2023 by Tim McMahon

The U.S. Bureau of Labor Statistics (BLS) released its employment / unemployment report for September on October 6th, 2023.

Adjusted U3 Unemployment Unchanged

Adj U3 Icon 3-8 unchg

  • Adjusted U-3 was 3.8% unchanged from August
  • Unadjusted U-3 was 3.6% down from 3.9%
  • Unadjusted U-6 was 6.7% down from 7.2%
  • Labor Force Participation was 62.8% unchanged
  • Unadjusted Employment rose from 156.416 to 157.001 million

Summary:
Despite the fact that the Seasonally Adjusted U3 unemployment rate was unchanged,
the UNADJUSTED U3 Rate was down… as is typical for this time of year.
Total Employed increased from 156.416 million in August to 157.001 million in September.

According to the Commissioner of the U.S. Bureau of Labor Statistics:

“Total nonfarm payroll employment rose by 336,000 in September, and the unemployment rate was unchanged at 3.8 percent, the U.S. Bureau of Labor Statistics reported today. Job gains occurred in leisure and hospitality; government; health care; professional, scientific, and technical services; and social assistance…

Among the major worker groups, the unemployment rates for adult men (3.8 percent), adult women (3.1 percent), teenagers (11.6 percent), Whites (3.4 percent), Blacks (5.7 percent), Asians (2.8 percent), and Hispanics (4.6 percent) showed little or no change in September.”

You can read the full BLS report here.

As usual, they are talking about “Seasonally Adjusted Jobs”.

Looking at the Unadjusted Establishment Survey report we see…
Originally the BLS reported employment of 156.302 million for August which they adjusted to 156.416 million. So they added 114,000 jobs for August. They are currently reporting 157.001 million jobs for September which is actually an increase of 699,000 jobs based on their original estimates or an increase of 585,000 based on their updated numbers. 

BLS Source

Current Employment Rate Chart

Adjusted Unemployment is slightly above the pre-COVID 2019 cyclical lows of 3.5% as well as above the lows made earlier this year. Current levels are still within the “Green Zone”.

Seasonally Adj U-3 Unemployment Rate for Sep-23

[Read more…] about October Unemployment Report for September 2023

Filed Under: BLS Tagged With: 2023, September, unemployment

Unemployment Reaches Lowest Point Since 1969

October 6, 2018 by Tim McMahon

Seasonally Adjusted U-3 Unemployment RateAccording to the the U.S. Bureau of Labor Statistics (BLS) monthly unemployment survey results for the month of September 2018 the current “Seasonally Adjusted” Unemployment Rate for September is 3.7% the lowest level since December 1969 when it was 3.5%. Unfortunately, by December 1970 unemployment was up to 6.1%.

The lowest level reached in the 1968-1969 timeframe was 3.4% where it hovered from September 1968 through May 1969. The only other time that unemployment was this low since they began tracking unemployment in 1948 was briefly in 1948 and again in 1951-53.


Jan Feb Mar Apr May Jun Jul Aug Sep Oct Nov Dec
1965 4.9% 5.1% 4.7% 4.8% 4.6% 4.6% 4.4% 4.4% 4.3% 4.2% 4.1% 4.0%
1966 4.0% 3.8% 3.8% 3.8% 3.9% 3.8% 3.8% 3.8% 3.7% 3.7% 3.6% 3.8%
1967 3.9% 3.8% 3.8% 3.8% 3.8% 3.9% 3.8% 3.8% 3.8% 4.0% 3.9% 3.8%
1968 3.7% 3.8% 3.7% 3.5% 3.5% 3.7% 3.7% 3.5% 3.4% 3.4% 3.4% 3.4%
1969 3.4% 3.4% 3.4% 3.4% 3.4% 3.5% 3.5% 3.5% 3.7% 3.7% 3.5% 3.5%
1970 3.9% 4.2% 4.4% 4.6% 4.8% 4.9% 5.0% 5.1% 5.4% 5.5% 5.9% 6.1%

Key September Employment and Unemployment Numbers

  • Adjusted U-3 Unemployment:  3.7% down from 3.9% in August, This is the lowest Seasonally Adjusted Unemployment rate since 1969.
  • Unadjusted U-3 Unemployment:  3.6% down from 3.9% in August and 4.1% in July and 4.2% in June.
  • Unadjusted U-6 Unemployment:   7.1% down from 7.4% in August and 7.9% in July, 8.1% in June, and below record lows of 7.3% in May, and 7.4% in April.
  • Employment: 149.741 million up from 149.226 million originally reported for August.
  • September Labor Force Participation Rate: 62.7% unchanged from August but down from July 62.9%.

See Current Unemployment Chart for more info.

Full Employment is Near – Differential between U3 and U6 nearing September 2006 Lows

Last month we incorrectly reported that the differential between the unadjusted U3 and U6 (reached by subtracting U3 from U6) was at 3.2% when in fact it was only at 3.5% so it still had a little way to go to reach the 3.2% low of September 2006. This month, although both U3 and U6 have fallen the differential remains at the 3.5% level.

U6 minus U3 Unemployment Rate

See Current U-6 Unemployment Rate for more info.

Employment by Sector

The employment “bubble chart” gives us a good representation of how each sector of the economy is doing (employment wise). As we can see from the chart below  [Read more…] about Unemployment Reaches Lowest Point Since 1969

Filed Under: BLS Tagged With: 1969, 2018, Differential, employment, Employment / Population Ratio, Employment by Sector, Labor Force Participation Rate, September, U3 and U6, unemployment rate

Primary Sidebar

Search Site

Sponsored:

URGENT: These Stocks Stand Poised to Benefit from President Trump's Trade Wars!

As the Trump administration moves ahead with aggressive tariff policies on key imports, the mainstream media is scrambling.

This Free Report - which you can download now - reveals the names and ticker symbols of 5 Stock Poised to Benefit Most from President Trump's Tariff Wars.

Click Here to Download Your FREE Stock Report Now.

Recent Posts

  • April 2025 Employment / Unemployment Report
  • Would More Jobs Help Social Security?
  • March 2025- Employment / Unemployment Report
  • February 2025 Jobs Report
  • January 2025 BLS Employment Report

Resources

  • Bureau of Labor Statistics Current Population Survey Monthly survey of households conducted by the Bureau of Census for BLS. It provides data on the labor force, employment, unemployment, etc.
  • Capital Professional Services Providing web design and development and Internet marketing services
  • Elliott Wave University Using the Elliott Wave Principle to improve investment performance
  • Financial Trend Forecaster Featuring Moore Inflation Predictor, NYSE Rate of Change and NASDAQ Rate of change
  • InflationData.com Inflation calculators, databases, etc.
  • Intergalactic Web Designers Web design and development services
  • Your Family Finances

Articles by Category

Articles by Date

Disclaimer

At UnemploymentData.com we are not registered investment advisors and do not provide any individualized advice. Past performance is not necessarily indicative of future performance and future accuracy and profitable results cannot be guaranteed.

Privacy & Terms of Use

Privacy Statement & Terms of Use

Do Not Sell My Information

Copyright © 2025 · News Pro on Capital Professional Services, LLC. All rights reserved · Log in