• About WordPress
    • WordPress.org
    • Documentation
    • Learn WordPress
    • Support
    • Feedback
  • Log In
  • Skip to primary navigation
  • Skip to main content
  • Skip to primary sidebar
  • Home
  • Contact us
  • Related Sites
    • InflationData.com
    • Financial Trend Forecaster
    • Your Family Finances
    • Elliott Wave University
    • Optio Money
  • About
    • Terms of Use
    • Disclaimer & Disclosure
    • Privacy Statement
  • Sitemap
    • 2009-2010 Posts
    • 2011 Posts

UnemploymentData.com

Your Source for Employment and Unemployment Data

Unemployment
  • Charts
    • Current Unemployment Rate Chart
    • Current Employment Rate (Chart and Data)
    • Current Employment vs Unemployment Chart
    • Historical Employment Data
    • Employment Population Ratio
    • Misery Index
  • Unemployment
    • Historical Unemployment Rate Tables
    • What Is U-6 Unemployment?
    • Unadjusted vs. Seasonally Adjusted U-3 Unemployment Rate
    • BLS vs. Gallup Unemployment Numbers
    • Current U-6 Unemployment Rate
    • What is the Labor Force Participation Rate?
    • What is the Real Unemployment Rate?
  • Employment
    • Current Employment Rate (Chart and Data)
    • Historical Employment Data
    • Contacting a Live Person at the State Employment Commission
      • How to Talk to a Live Person at the Virginia Unemployment Commission
      • Florida’s FLUID Unemployment Program
    • Benefits
      • Insurance
      • Retirement
    • Careers
    • Employment Costs
    • Experience
    • Government
    • Job Hunting
      • Interview
      • Resume
  • Find Articles
  • Education
    • Skills
  • General
    • Small Business
      • Outsourcing
    • Success
You are here: Home / Archives for Population Ratio

Population Ratio

February Employment UP – Unemployment Down

March 10, 2018 by Tim McMahon

Seasonally Adjusted Unemployment Rate

On Friday March 9th the U.S. Bureau of Labor Statistics (BLS) released their monthly employment survey results for the month of February.

According to the BLS the Seasonally Adjusted U-3 Unemployment Rate for February is unchanged for the 5th month in a row. That’s right from October through February the Seasonally Adjusted Unemployment rate has been 4.1%.

This is a very low level and we really don’t expect it to get too much lower.

Key February Employment and Unemployment Numbers

  • Adjusted U-3 Unemployment- 4.1% unchanged since October.
  • Unadjusted U-3 Unemployment- 4.4% down from 4.5% January.
  • Unadjusted U-6 Unemployment- 8.6% down from 8.9% in January.
  • Employment 146.696 million up from 145.473 million in January but down from 148.346 million in December and 148.526 million in November.
  • Gallup has discontinued publishing U-6 & U-3 numbers.

See Current Unemployment Chart for more info.

Employment by Sector

The employment “bubble chart” gives us a good representation of how each sector of the economy is doing (employment wise). As we can see from the chart below the only sector to the left of the zero line is Information meaning that all other sectors gained employees in February except information which lost -12,000 employees on a “Seasonally Adjusted” basis.

The biggest gainer was construction (bubble furthest to the right) which added 61,000 jobs, followed by Retail Trade which gained 50,300 jobs and Professional and Business Services which gained 50,000 jobs even manufacturing gained 31,000 jobs. (See the table below the chart for average weekly earnings and other details.)Employment by Sector Bubble Chart


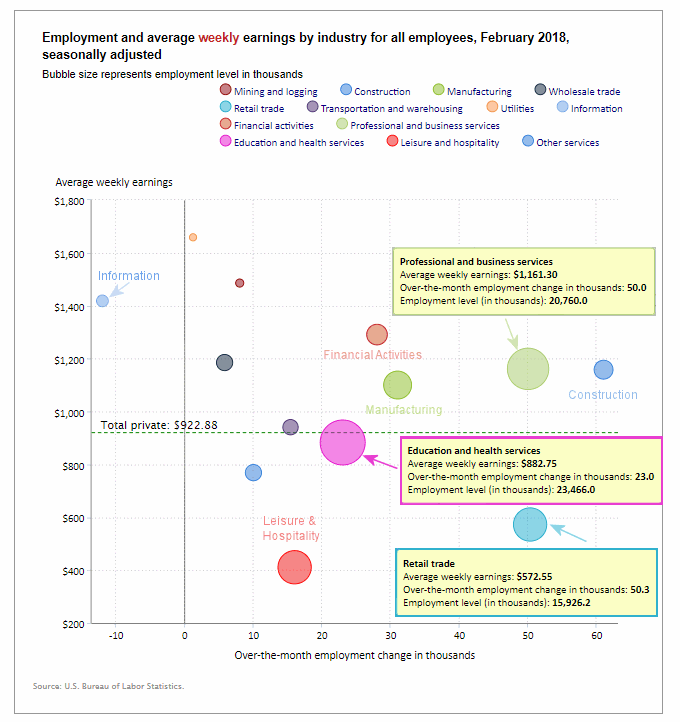
How to read this chart:

Bubbles location on the chart tell us two things:

  • Change in Employment Levels over the most recent month.
  • Average Weekly earnings.
  • The further to the right the bubble the larger the increase in the number of jobs.
  • The higher up on the chart the larger the average salary.

Bubble Size tells us:

  • Total Employment for the sector.
  • Larger bubbles mean more people are employed in that sector.

Employment and Average Weekly Earnings by Industry for All Employees

February 2018, Seasonally Adjusted

Industry Monthly Increase Average Weekly Earnings Employment Level
Total Private Employment 287,000 $922.88 125,819,000
Mining and Logging 8,000 $1,485.78 713,000
Construction 61,000 $1,158.17 7,173,000
Manufacturing 31,000 $1,100.03 12,614,000
Wholesale trade 5,800 $1,185.12 5,956,200
Retail trade 50,300 $572.55 15,926,200
Transportation and Warehousing 15,400 $940.60 5,263,400
Utilities 1,200 $1,658.82 553,400
Information -12,000 $1,418.40 2,748,000
Financial Activities 28,000 $1,290.81 8,547,000
Professional and Business Services 50,000 $1,161.30 20,760,000
Education and Health Services 23,000 $882.75 23,466,000
Leisure and Hospitality 16,000 $410.81 16,262,000
Other Services 10,000 $768.73 5,837,000

U-6 Unemployment

U6 Unemployment
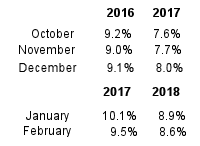
Looking at the broader measure of Unemployment which includes discouraged workers, we see that the U-6 unemployment rate fell from 10.1% in January to 9.5% in 2017 and from 8.9% to 8.6% in 2018.

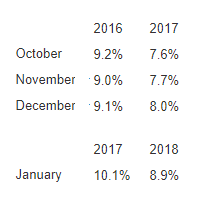
From the table at the left we can also see that U-6 unemployment went from 9.2% in October 2016 to 7.6% in 2017.

Similarly it fell from 9.0% in November 2016 to 7.7% in 2017 and from 9.1% in December 2016 to 8.0% in 2017.

See Unadjusted U-6 unemployment for more info.

Employment

Historical Employment
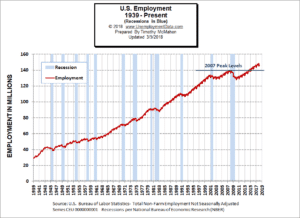
Over the last month, the actual number of people working (not seasonally adjusted) has increased by   [Read more…] about February Employment UP – Unemployment Down

Filed Under: BLS, Employment Tagged With: employment, Employment / Population Ratio, Labor Force, Labor Force Participation Rate, LFPR, Population Ratio, Sector, U-3, U-6, U3, U6

January Unemployment Almost “Record Setting”

February 3, 2018 by Tim McMahon

Seasonally Adjusted Unemployment RateJanuary Unemployment is almost record setting… but not for the reason you might think.

On Friday February 2nd the U.S. Bureau of Labor Statistics (BLS) released their monthly employment survey results for the month of January. According to the BLS the Seasonally Adjusted U-3 Unemployment Rate for January is unchanged for the almost record setting 4th month in a row. That’s right from October through January the Seasonally Adjusted Unemployment rate has been 4.1%.  This is a very low level and we really don’t expect it to get too much lower but the interesting part is that the unadjusted U-3 was 3.9% from October through December (resulting in the adjusted rate being 4.1%) but then in January the unadjusted rate jumped to 4.5% (a 0.6% increase) and the adjusted U-3 remained the same at 4.1%. This is because typically January sees an uptick in unemployment as all the seasonal employees get laid-off. So we would expect some sort of uptick in unadjusted unemployment rate. But because the Seasonally Adjusted U3 was unchanged for the month the current increase in the unadjusted U-3 was actually no greater or less than normal. See Current Unemployment Chart for more info.

U-6 Unemployment

U6 2016 vs 2017Over the same period, Unadjusted U-6 unemployment which is a broader measure of Unemployment including discouraged workers, climbed steadily.

It was 7.6% in October, then 7.7% in November, then 8.0% in December, and finally 8.9% in January.

This is still significantly better than a year ago when in November 2016 Unadjusted U-6  was 9% and had climbed to 10.1% by January 2017.

See Unadjusted U-6 unemployment for more info.

Employment

Historical EmploymentOver the last month, the actual number of people working (not seasonally adjusted) has decreased by [Read more…] about January Unemployment Almost “Record Setting”

Filed Under: BLS, Employment Tagged With: employment, Employment / Population Ratio, Labor Force, Labor Force Participation Rate, LFPR, Population Ratio, Sector, U-3, U-6, U3, U6, unemployment

Primary Sidebar

Search Site

Sponsored:

URGENT: These Stocks Stand Poised to Benefit from President Trump's Trade Wars!

As the Trump administration moves ahead with aggressive tariff policies on key imports, the mainstream media is scrambling.

This Free Report - which you can download now - reveals the names and ticker symbols of 5 Stock Poised to Benefit Most from President Trump's Tariff Wars.

Click Here to Download Your FREE Stock Report Now.

Recent Posts

  • April 2025 Employment / Unemployment Report
  • Would More Jobs Help Social Security?
  • March 2025- Employment / Unemployment Report
  • February 2025 Jobs Report
  • January 2025 BLS Employment Report

Resources

  • Bureau of Labor Statistics Current Population Survey Monthly survey of households conducted by the Bureau of Census for BLS. It provides data on the labor force, employment, unemployment, etc.
  • Capital Professional Services Providing web design and development and Internet marketing services
  • Elliott Wave University Using the Elliott Wave Principle to improve investment performance
  • Financial Trend Forecaster Featuring Moore Inflation Predictor, NYSE Rate of Change and NASDAQ Rate of change
  • InflationData.com Inflation calculators, databases, etc.
  • Intergalactic Web Designers Web design and development services
  • Your Family Finances

Articles by Category

Articles by Date

Disclaimer

At UnemploymentData.com we are not registered investment advisors and do not provide any individualized advice. Past performance is not necessarily indicative of future performance and future accuracy and profitable results cannot be guaranteed.

Privacy & Terms of Use

Privacy Statement & Terms of Use

Do Not Sell My Information

Copyright © 2025 · News Pro on Capital Professional Services, LLC. All rights reserved · Log in